i
國立臺灣大學公共衛生學院流行病學研究所 博士論文
Graduate Institute of Epidemiology College of Public Health
National Taiwan University Doctoral Dissertation
建立以氣候資訊為基礎的台灣登革流行預測模式:
1998-2007 年登革流行病學和氣象學因子之時序分析 Establishment of a Better Prediction System for Dengue
Epidemics in Taiwan: Temporal Analyses of Epidemiological and Meteorological Factors of Dengue during 1998-2007
尚君璽
Chuin-Shee Shang
指導教授:金傳春 博士、方啟泰 博士 Advisors: Chwan-Chuen King, Dr. PH
Chi-Tai Fang, MD, PhD
中華民國 99 年 6 月 June, 2010
誌謝
感謝天父讓我有幸進入博士班就讀,並在八年之內陸續完成了結婚、生育
子女、畢業等大事。一路走來,酸甜苦辣兼而有之,感謝家人、朋友及教會的
支持,特別是外子詠銘的幫助、陪伴,以及父母的栽培與鼓勵;感謝已經在天
上的外婆、祖母的養育之恩,讓我可以也成為照顧別人的人。也感謝過去各個
求學階段的恩師益友,這些教導與砥礪為我日後的研究生涯奠定了重要的基礎。
謝謝金傳春老師將我帶進傳染病的領域,讓我一窺學術殿堂的奧秘;謝謝
方老師費盡心思且無私無我的指導,為人處事及鑽研學問的嚴謹態度都是我的
好榜樣,幫助我可以將畢業論文順利發表於口碑極佳的國際期刊;謝謝媲美智
多星的柳中明老師,常常迅速提供氣象學的豐富資訊及各種疑難排解,總是從
容、溫和又充滿智慧;謝謝張念台老師這幾年來在研究計畫上提供的寶貴指導
與協助,對於提攜後進也是不遺餘力;謝謝梁賡義老師在口試階段的拔刀相助,
百忙之中仍盡力給予詳盡的指導,大師風範令人如沐春風。
謝謝台大提供了絕佳的環境,讓一切的努力與創意都得到百分之百的支
持;在這裡當學生的時間已有十四年,我深深以此身分為榮。古云:登高必自
卑,行遠必自邇;正如今年畢業典禮的主題:千里之行,始於足下。回首過往、
展望未來,我僅以感恩的心情向前邁步,認真迎接另一個精采生涯的開始。
iii
摘要
受登革病毒感染的旅客經常成為散播病毒至其他地區的重要途徑,甚而引
發他國的流行;然而這些感染的旅客入境後和當地氣候、病媒以及本地疫情之
間的互動關係並不清楚。由於境外移入病例與本地登革疫情關係的議題長期受
到忽略,本研究即在探究臺灣地區的境外移入登革病例和氣候因子,對於本地
疫情發生之影響,進而可讓基層與中央衛生人員將危險層級資訊馬上應用於疾
病防控策略。
我們使用羅吉斯(logistic)和普瓦松(Poisson)迴歸模式分析 1998 至 2007
年間臺灣南部地區經實驗室診斷證實的登革確定病例,以區辨在氣候因子的作
用下,境外移入和本地登革病例的時序相關性。結果發現本地登革疫情的發生
與境外移入病例數(2 至 14 週前)、高溫(6 至 14 週前)及低濕度(6 至 20 週
前)之間,具有延遲的相關性。此外,境外移入病例數和本地登革病例數僅在
流行被引發的「初期」階段,才有明顯數量上的相關性;一旦流行持續發生,
此種關係即不復見。另外,根據單變項分析的結論,挑選出的重要氣候因子所
建立的羅吉斯迴歸模式,可以進一步建立登革危險性指標的預警數值。經初步
運算,此法優於僅以前期登革危險性指標(dengue risk index, DRI)值預測本期 DRI
值的效果,在加入氣候因子後,模式預測值與觀察值的相關係數(Spearman
correlation)可達 0.71(屏東地區)、0.84(高雄地區)以及 0.86(台南地區);至於泰國
地區也有 0.66-0.77 的水準。由此可知此法不但適用於台灣登革疫情層級之預
警,也適用於泰國海岸五省的疫情預測。
這些發現顯示,惟有氣象條件適宜時,境外移入登革病例才有可能引發本
地的疫情。據此,經由境外移入病例的快速實驗診斷、早期發現以及管理,可
以遏止其後大規模登革/登革出血熱流行的發生。因此整合氣象資訊的早期警示
監測系統,將是登革疫情尚未成為地方性流行的地區用以成功防治疫情的無價
利器。
關鍵字:登革熱/登革出血熱、本土流行、境外移入病例、氣象、迴歸模式、登
革危險性指標
v
Abstract
Travelers who acquire dengue infection are often routes for virus transmission to
other regions. Nevertheless, the interplay between infected travelers, climate, vectors,
and indigenous dengue incidence remains unclear. The role of foreign-origin cases on
local dengue epidemics has thus been largely neglected by research. This study
investigated the effect of both imported dengue and local meteorological factors on
the occurrence of indigenous dengue in Taiwan.
Using logistic and Poisson regression models, we analyzed bi-weekly,
laboratory-confirmed dengue cases at their onset dates of illness from 1998 to 2007 to
identify correlations between indigenous dengue and imported dengue cases (in the
context of local meteorological factors) across different time lags. Our results
revealed that the occurrence of indigenous dengue was significantly correlated with
temporally-lagged cases of imported dengue (2-14 weeks), higher temperatures (6-14
weeks), and lower relative humidity (6-20 weeks). In addition, imported and
indigenous dengue cases had a significant quantitative relationship in the onset of
local epidemics. However, this relationship became less significant once indigenous
epidemics progressed past the initial stage. Polytomous Logistic regression model
with relevant meteorological variables stepwise selected were able to fitting the value
of Dengue Risk Index (DRI) in both Taiwan and Thailand. The Spearman correlation
between observed DRI and model-expected DRI ranged from 0.71 to 0.86 in Taiwan
and from 0.66 to 0.77 in Thailand, respectively.
These findings imply that imported dengue cases are able to initiate indigenous
epidemics when appropriate weather conditions are present. Early detection and case
management of imported cases through rapid diagnosis may avert large-scale
epidemics of dengue/dengue hemorrhagic fever. The potential application of DRI
with meteorological modeling in both Taiwan and Thailand demonstrated that its
feasibility to be extended to other countries for the current important issue on global
warming and dengue. The deployment of an early-warning surveillance system, with
the capacity to integrate meteorological data, will be an invaluable tool for successful
prevention and control of dengue, particularly in non-endemic countries.
Keywords: dengue, meteorology, climate, weather, regression model, Dengue Risk
Index
vii
Contents
Signature Page(口試委員會審定書) ... i
Acknowledgements(誌謝) ... ii
Chinese Abstract(中文摘要) ... iii
Abstract ... v
List of Figures ... ix
List of Tables ... x
Chapter 1 Introduction ... 1
1.1 The impact of climate on dengue epidemics ... 1
1.2 Unsolved questions ... 2
Chapter 2 Literature Review... 3
2.1 Global status of dengue ... 3
2.2 Dengue in Taiwan ... 3
2.3 The impact of imported cases ... 7
2.4 Meteorological effects ... 8
2.5 Modeling for dengue incidence ... 9
2.6 Potential usage of dengue risk index (DRI) ... 10
Chapter 3 Objectives and Specific Aims ... 13
3.1 Objectives and Specific Aims ... 13
3.2 Hypotheses ... 13
Chapter 4 Materials and Methods ... 15
4.1 Study areas ... 15
4.2 Epidemiological data ... 15
4.3 Meteorological data ... 16
4.4 Thailand’s data ... 17
4.5 Statistical analyses ... 17
Chapter 5 Results ... 22
5.1 Logistic regression models for the occurrence and increase of indigenous dengue cases: Univariate analyses ... 24
5.2 Impact of imported dengue on indigenous dengue at three epidemic phases ... 25
5.3 Poisson regression model fitted with meteorological variables on number of dengue cases ... 25
5.4 The distribution of monthly DRI ... 26
5.5 Correlation between monthly reported and confirmed DRI in Taiwan ... 28
5.6 Comparing with different time unit of DRI ... 28
5.7 Predicting models of DRI ... 28
Chapter 6 Discussion ... 31
6.1 The uniqueness of dengue analyses in Taiwan ... 32
6.2 The combined effect of imported dengue and meteorological factors ... 33
6.3 The effect of vector control on epidemics of dengue... 35
6.4 The increasing severity of dengue/DHF epidemics in Taiwan ... 35
6.5 Better interpretation with logistic and Poisson regression models ... 37
6.6 Application of DRI to dengue control ... 38
6.7 The predictability of newly developed DRI models ... 39
6.8 Limitations ... 40
6.9 Future direction ... 41
Chapter 7 Recommendations ... 43
References ... 44
Tables ... 51
Figures ... 65
Appendix ... 80
ix
List of Tables
Table 1. Abbreviations of variables
Table 2. The definitions of risk category for dengue epidemics
Table 3. The monthly frequency of dengue risk category (DRI) in Taiwan and
Thailand
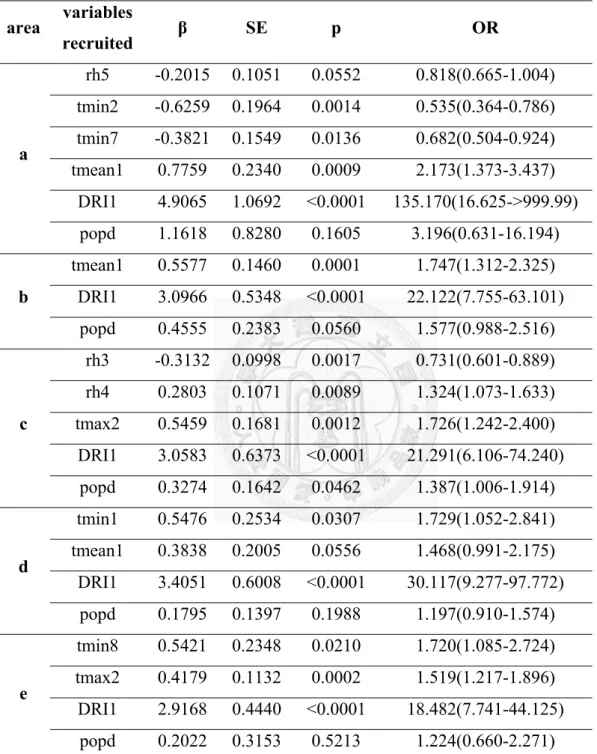
Table 4. Area-specific polytomous logistic regression models based on local
meteorology for predicting dengue risk index (DRI) in Taiwan from 1998 to
2007
Table 5. The consistence of DRI between observed and expected values for dengue
epidemics in Taiwan from 1998 to 2008
Table 6. Area-specific polytomous logistic regression models based on local
meteorology for predicting dengue risk index (DRI) in Thailand from 1996
to 2004
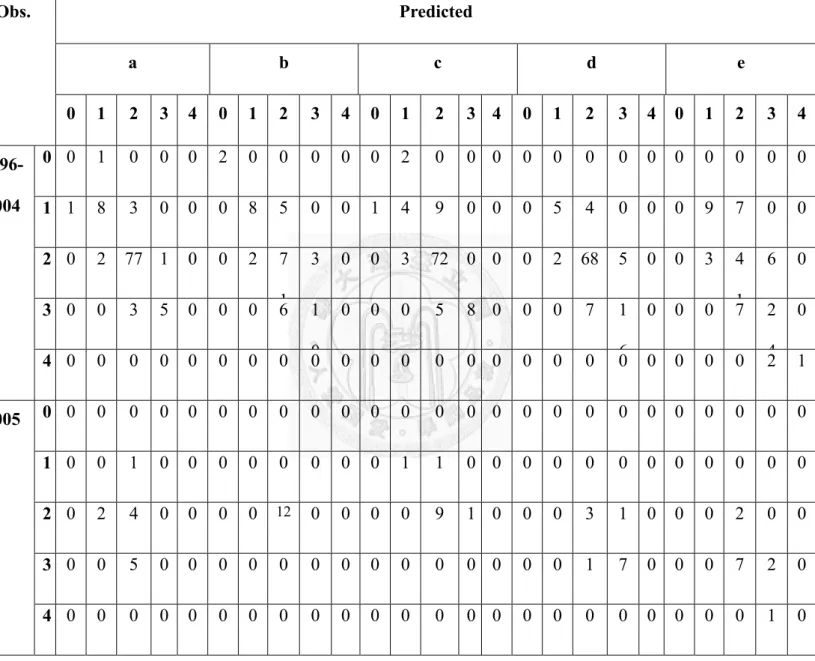
Table 7. The consistence of DRI between observed and expected values for dengue
epidemics in Thailand from 1996 to 2005
List of Figures
Figure 1. The rationale of local climate and imported effects on indigenous dengue
epidemics
Figure 2. Numbers of laboratory-confirmed dengue (including dengue and dengue
hemorrhagic fever) cases in Taiwan, 1998-2007.
Figure 3. Correlation between bi-weekly “occurrence” of indigenous dengue cases
and 1) the number of imported cases as well as 2)meteorological variables
across time lags from 1 to 12 bi-weeks.
Figure 4. Correlation between bi-weekly “increase” of indigenous dengue cases and
1) the number of imported cases as well as 2) meteorological variables
across time lags from 1 to 12 bi-weeks.
Figure 5. Correlation between bi-weekly number of indigenous dengue cases and 1)
the number of imported cases as well as 2) meteorological variables
across time lags from 1 to 12 bi-weeks.
Figure 6. Correlation between bi-weekly number of indigenous dengue cases and
the number of imported cases over time lags from 1 to 12 bi-weeks.
Figure 7. Fitting the number of dengue cases with meteorological regression models
Figure 8. Distribution of monthly Dengue Risk Index in Taiwan and Thailand,
xi
1998-2005
Figure 9. Fitting (1998-2007) and predicting (2008, after red dash line) DRI in
Taiwan with meteorological regression model
Figure 10. Fitting (1996-2004) and predicting (2005, after red dash line) DRI in
Thailand with meteorological regression model
Chapter 1 Introduction
1.1 The impact of climate on dengue epidemics
Dengue/dengue hemorrhagic fever is the world’s most widely spread mosquito-borne
arboviral disease and threatens more than two thirds of the world’s population. Cases are
mainly distributed in tropical and subtropical areas, between 23.5oN and 23.5oS, in accordance
with vector habitats for Aedes aegypti and Ae. albopictus. Climate is believed to have complex
and long-lasting effects on the epidemics of infectious diseases, especially vector-borne
diseases [1-4]. The meteorological factors interact with human and mosquito vector, and affect
the occurrence and distribution of diseases ecologically [5-8] through both infectious agents
and arthropod vectors biologically [9,10].
The possible role of international travel in cross-country and cross-continent transmission
dengue has been identified an increasing public concern in recent years [11-13]. More and
more infectious travellers carry viruses back to home countries, and disperse the virus within
the network established by indigenous populations of both mosquito vectors and human hosts.
Thousands of international travelers infected dengue viruses in endemic areas, where a disease
occurs continuously and with predictable regularity in a specific area or population
(http://www.cdc.gov/ncidod/dvbid/dengue/index.htm), have been speculated as an important
pathway in transmitting the disease into non-endemic areas [14-17]. Potasman et al. have
2
discovered that Israeli travellers were at higher risk for acquiring dengue infection when they
arrived in tropical countries in summer [18]. Seasonality of imported dengue is therefore
supposed to have potentially complex and long-lasting effects on the epidemics of dengue [13].
Nonetheless, some of the previous studies even underestimate or neglected the effects that
imported cases may have on the occurrence of epidemics [19,20]. The interaction between
seasonality and imported dengue is reasonably to play an important role in the occurrence of
indigenous cases, and thus worthy of detailed investigation.
1.2 Unsolved questions
Up to now, the effects of regional weather may have on vector-borne infectious diseases
are not well-understood. The most frequently studied meteorological factors have been
temperatures and rainfall [1,21-23]. However, many other meteorological factors have been
mostly neglected. The time lag between those meteorological factors and the incidence of a
studied disease has generally be overlooked or underestimated in investigating their real
correlations. How to use the best model to consider all important meteorological factors with
time lags and unique epidemiological characteristics of dengue in Taiwan becomes very
important.
Chapter 2 Literature review
2.1 Global status of dengue
Dengue fever is caused by dengue viruses (four serotypes), classified as flaviviridae.
Both the incidence and epidemic areas have been increasing in the past four decades. About
50% of population in the world is under the threat of dengue infection and 100 million cases
occur annually [24]. Its potential severer complications, including dengue hemorrhagic fever
(DHF) and dengue shock syndromes (DSS), result in the leading cause of death in children in
endemic areas [25,26]. Historically, after the first official case report of dengue in the 18th
century, the major epidemics occurred mainly in Asia, especially in South East Asia, such as
Thailand, the Philippines, and Indonesia. Nevertheless, dengue epidemics have also been
frequent in the Pacific islands, South Asia, Australia, Africa, Latin America, etc. Even high
latitude areas are also involved through frequent and instant international transportation
[27,28].
2.2 Dengue in Taiwan
As early in 1870s, there was reported dengue-like disease. Sporadic cases occurred
mainly in Kaohsiung area every two or three years. The disease had not been reoported after
1940s. Dengue reappeared in Pingtung area (Liuchiu islets) in 1981 and Kaohsiung area in
4
1987 with thousands of cases. Hereafter, there are epidemics every year in southern Taiwan.
After 1990, Taichung (1995) and Taipei (1996, 2007) have been also involved in indigenous
dengue.
2.2.1 Surveillance of dengue in Taiwan
Surveillance of dengue in Taiwan is made up of three parts: passive reporting of
dengue, including dengue fever (DF) and dengue hemorrhagic fever (DHF) within 24 hour,
active and semi-active surveillance. In passive surveillance, dengue-like illness reports by
health care workers to local health authorities account for most confirmed dengue cases.
Active surveillance, including volunteer reporting and fever screenings at international
airports (identifying fever cases by infrared thermal scanner, which has been routinely
operated by the government since 2003) [29,30]. In semi-active surveillance, fever cases
are investigated in residential areas, schools, and work places with epidemiological linkage,
and specimens are taken once confirmed dengue cases are identified. These active and
semi-active components, serve to complement and reinforce in support of comprehensive
virus detection. Among active strategies, fever screening detects imported dengue cases
efficiently [30]. All febrile patients identified through fever screening are required to
submit blood samples for testing. In addition, public health professionals at local health
authorities monitor suspected cases for the development of dengue-like symptoms/signs
until dengue virus infection is excluded [31]. These strategies identify and manage
potential dengue cases before they enter into the community. In other words, Taiwan’s
dengue surveillance involves serologically detected mild and asymptomatic dengue cases
that are quite different from many dengue-endemic countries where most of severe DHF
cases are reported with less involving mild dengue cases. Under these circumstances, the
true relationship between meteorological factors and dengue can be appropriately under
investigation.
2.2.2 Case definition of dengue
The current definitions for dengue, including DF, DHF and dengue shock syndrome
(DSS) in Taiwan have been applied since the 1980s. Cases of “probable DF” are patients
with body temperatures >38oC and two or more of the following clinical manifestations:
headache, retro-orbital pain, myalgia, arthralgia, rash, hemorrhagic manifestations and
leucopenia. Cases of “probable DHF” and DSS are further identified based on criteria
established by the World Health Organization [32]. Identified probable dengue cases must
provide blood specimens for laboratory confirmation tests. These laboratory tests include
molecular identification of dengue virus by reverse-transcriptase polymerase chain reaction
(RT-PCR) [33], single or paired serum samples testing for dengue-specific IgM
seropositives, 4-fold dengue-specific IgG serotiter rises (with the exclusion of Japanese
6
encephalitis virus infection) [32], or virus isolation [34,35].
2.2.3 Definition of imported dengue cases
Epidemiological questions such as travel history, incubation period, and first day of
illness were evaluated to identify the possible origin of dengue infection. “Imported
dengue cases into Taiwan” were defined as laboratory-confirmed dengue cases with travel
history to endemic countries within 14 days before the date of onset of dengue (based on
Taiwan-CDC’s definition) [31].
2.2.4 Serotype of dengue viruses in major epidemics
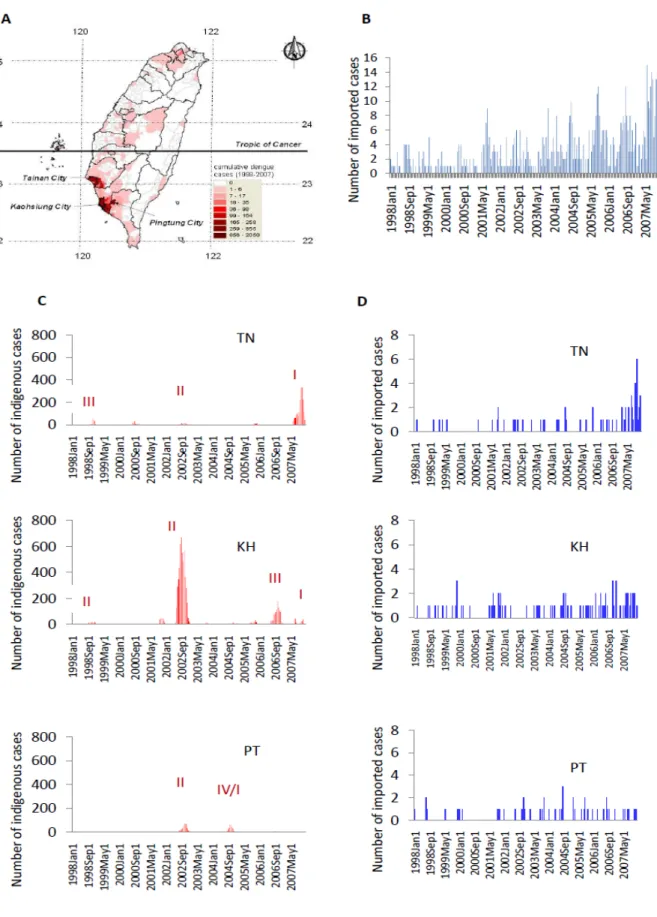
According to the reports of Taiwan-CDC, the major epidemics areas located in
southern Taiwan: TN, KH and PT [31]. Information on the predominant serotype of
isolated dengue viruses (Figure 1C) showed that the dominant serotypes/genotypes of
epidemic DENV varied by year and area [30]. However, in 2002, a DENV-2 epidemic
attacked all these three areas. During our study period, KH had the most frequent
occurrence of dengue epidemics, with epidemics of DENV-2 in 1998 and 2001-2003;
DENV-1 in 2004; DENV-3 in 2006, and DENV-1 in 2007. TN had four major epidemics,
including DENV-3 in 1998 [36], DENV-4 in 2000, DENV-2 in 2002, and DENV-1 in
2007. PT had two major epidemics, including DENV-2 in 2001-2003 and
DENV-1/DENV-4 in 2004. Interestingly, we found that local dengue epidemics, with
geographical variations in these three areas, only had higher numbers of indigenous cases
during certain years.
2.3 The impact of imported cases
2.3.1 International transmission of dengue
Dengue outbreaks initiated by international tourists, immigrants, and foreign workers
have been reported in numerous developed areas and countries [11-13]. Not only
tropical/subtropical areas, but distant areas/countries are also under the threat of dengue
through international tourists, immigrants, foreign workers, and militaries [16,27].
Developed areas and countries have reported outbreaks in the recent decade, including
Hawaii [37] and Texas [38] in the United States, France[17], and Germany [15].
Nevertheless, the potential impact from the complicated interaction among infected
travellers, climate, vectors and incidence is unclear [13,15].
2.3.2 Correlation between season and imported dengue cases
Historically, the link between imported cases and indigenous cases has been
established through phylogenetical analysis and viral sequence comparisons [29,30].
8
However, these retrospective studies are not capable of providing timely, relevant
information about transmission dynamics, nor do they provide quantitative insight for
disease control strategies in a broader context. For example, epidemiological data has
indicated that imported dengue cases enter Taiwan almost every month from other
countries (Figure 1B) but have not always resulted in local dengue epidemics [18,30]. This
suggests that the timing of imported dengue’s entrance may have considerable effect on
domestic dengue epidemics [13,16]. However, the role of these foreign-origin cases in
local dengue epidemics has not yet been quantitatively assessed [20].
2.4 Meteorological effects
Climate has been identified to be correlated with disease incidence and thus may be
usable to predict the occurrence of infectious diseases, especially for those vector-borne ones
which are sensitive to seasonality [4,13,39,40]. Higher temperature is believed to increase the
occurrence of dengue because of it shortens the time of virus replication in mosquito vectors
(known as extrinsic incubation period, EIP) [10]. Warmer condition may also reduce the size of
adult mosquito with higher metabolism rates, and thus require more blood meal through higher
biting rate [41]. Rainfall related factors are also considered positively correlated with the
incidence of dengue by increasing the breeding sites of mosquito vectors [1,21,39]. Rainy days
have been reported significantly associated with DHF incidence in Thailand [42]. Extremely
heavy rains was thought to flush away mosquito eggs, larvae and pupae from the breeding sites
[42]. Nevertheless, a recent study with more precise experiments concluded that the larva and
pupa of Aedes aegypti populations, comparing with Culex pipiens, were slightly affected by
excessive rain [43]
.
They found that the fourth instars of Ae. aegypti were not affected byflushing when exposed for longer rain intervals (30 versus 60 min) or at a colder water
temperature (24 versus 16°C). This difference was most dramatic during the pupal stage.
Higher relative humidity has also been reported correlated with higher mosquito density and
higher vector capacity [44,45] (e.g. “the daffy rate at which future inoculations arise from a
currently infective case, provided that all female adults (the original text: flies) biting that case
become infected” [46]), and thus used for the projection of global dengue [2].
2.5 Modeling for dengue incidence
In order to control the disease, recent studies attempt to predict dengue incidence with
regression models. ARIMA (Autoregressive Integrated Moving Average) has been popular in
time series fitted models designed to simulate or predict the number or incidence of dengue
with meteorological information [5,19,20,47,48]. ARIMA models are based on linear
regression, assuming that dengue incidence is under normal distribution. Although some
10
previous studies fit the incidence pretty well, the disease data is actually count in its nature and
thus need more reasonable assumptions.
2.6 Potential usage of dengue risk index (DRI)
2.6.1 A need for an understandable index
A globally understandable index for epidemics or risk of dengue is needed. Currently,
most countries in the world have individual or international surveillance systems for
dengue with a focus mainly on the total number of cases (e.g. DengueNet of World Health
Organization). If we are able to integrate their information about dengue epidemics with an
indexing system, each country or area may have its specific value within certain period.
This index will be able to alert people before they enter an endemic area of dengue, as well
as governments once they have travelers from high risky countries. One example of
international-accepted indexing system is the ultraviolet index (UVI), which transforms the
daily maximum UVB flux into a digital value, named as UVI [49], and then assigned it
into one of five interpretable ordinal categories: low, moderate, high, very high and
extreme. Another commonly used indexing system is the Pollutant standard index (PSI),
which helps one to be alert on the air pollution condition where he lives or he will visit.
Although the importance of imported cases to local dengue epidemics has been reported
worldwide [12,27], unfortunately, for the travelers, there has been no advice from a system
to quantify the risk of their destinations. Human movements are identified to have impact
on spreading of dengue rather than solely mosquito dispersing [35,50]. The relevance of
different spatial distances are from household, neighborhood, regional to international
spreading [51]. Most strategies for dengue control are limited within a country or an area,
such as insecticide spraying and case notification, however, the management and
prevention for global transmission is lacked.
2.6.2 Categorized number of dengue cases
Previous studies on prediction models for dengue mainly focused on calculating the
number of dengue cases with regression models mostly [5,20,47]. However, this method is
not appropriate especially for those non-endemic areas of dengue because of the
over-dispersion (super high variance) among the numbers of indigenous dengue in different
seasons. On the other hand, it is not necessary for the public to realize the exact case number
if there is an epidemic. Instead, categorization of the case number of dengue into an
accessible risk index may not only enhance the efficiency of disease prediction, but also
become more practical for disease control and prevention.
In this study, we propose a Dengue Risk Index (DRI) by establishing polytomous
(multi-level) Logistic regression models based on the information about local
12
epidemiological data. We applied this concept to calculate area-specific DRI with real data,
and compared the expected values with observed ones in Taiwan and Thailand, two
countries with different status of dengue epidemics. In addition, a preliminary forecasting
method was also developed to illustrate how to implement DRI on dengue predicting.
Chapter 3 Objectives and Specific Aims
3.1 Objectives and specific aims
The study used data of all imported and indigenous dengue cases nationwide that had
been confirmed by the Taiwan-CDC) [31,52] to investigate the relationship between imported
and indigenous dengue, and all concurrent meteorological characteristics with potential for
facilitating disease transmission.
The specific aims of this study were:
1) To investigate the relationship between imported and indigenous dengue, and all concurrent
meteorological characteristics with potential for facilitating disease transmission.
2) To clarify the relationship between imported dengue, local weather, and domestic
epidemics of dengue, and to further identify the role of imported cases (in different phases)
during a dengue epidemic in non-endemic areas such as Taiwan.
To explore the potential usage of categorized case number, named as Dengue Risk Index,
in describing and analyzing the epidemiology of indigenous dengue outbreaks, and to further
establish a predicting system with succinct meteorological regression model.
3.2 Hypotheses
3.2.1 Specific meteorological variables correlated with more indigenous dengue cases
14
3.2.2 Imported dengue cases positively correlated with more indigenous dengue cases
3.2.3 Dengue risk index is able to reflect the number of confirmed/reported dengue cases
3.2.4 Previous dengue risk index correlate with current dengue risk index, thus is able to
predict
3.2.5 Specific meteorological variables selected in a regression model are able to fit the
distribution of dengue risk index
Chapter 4 Materials and methods
4.1 Study areas
Confirmed indigenous dengue cases in three epidemic areas in Southern Taiwan [Tainan
(TN), Kaohsiung (KH), and Pingtung (PT)] were investigated. All three areas had identified
both Aedes aegypti and Ae. albopictus mosquitoes as vectors for transmitting dengue virus. KH,
including both metropolitan Kaohsiung and Kaohsiung County (total area is 2,946.27 km2, and
total population was 2,770,050 in year 2008), had served as the location for the majority of
Taiwan’s dengue epidemics involving all four serotypes of dengue viruses. Smaller scale
epidemics of dengue also occurred in both TN and PT, located adjacent to Kaohsiung. For this
study, TN included Tainan City and County (total area is 2,191.65 km2, and total population
was 1,873,678 in year 2008), while PT referred to Pingtung City and County (total area is
2,775.60 km2, and total population was 884,067 in year 2008). The subtropical climate of
southern Taiwan presents an annual hot and rainy summer season lasting from June to August
and daily mean temperatures ranging from 18o to 32oC year round.
4.2 Epidemiological data
Information on these confirmed cases of dengue fever (DF) and dengue hemorrhagic
fever (DHF) were obtained from Taiwan-CDC from 1998 to 2007 through dengue surveillance
16
in Taiwan. Date of onset of dengue illness, age, gender, clinical manifestations, reporting
hospital, and laboratory results were all thoroughly documented for each dengue case.
4.3 Meteorological data
We systematically collected daily weather data for Taiwan that was publicly available
through the 26 branch stations of the Central Weather Bureau (http://www.cwb.gov.tw/). The
meteorological variables analyzed in this study were selected after comprehensive evaluation of
all available data with biological relevance to vectors or cases of dengue, including daily mean
temperature, daily maximum temperature, daily minimum temperature, daily mean relative
humidity, daily mean wind speed, daily accumulative rainfall, daily accumulative rainy hours,
daily sunshine accumulation hours, daily mean sunshine rate (from sunrise to sunset), and daily
sunshine total flux. Unlike weather stations in Tainan and Kaohsiung, Pingtung County’s
station is located a far distance from Pingtung City, where the majority of Pingtung’s dengue
cases occurred. We therefore used weather data collected by the Environment Protecting
Agency (EPA) at their station in Pingtung City. This EPA weather station was only able to
provide data regarding daily mean temperature, daily maximum temperature, daily minimum
temperature, daily mean wind speed, and daily accumulative rainfall. We then substituted
Kaohsiung’s data for Pingtung’s meteorological variables not provided by the EPA because of
Pingtung City’s close proximity to Kaohsiung City.
4.4 Thailand’s data
Thailand has been an important origin country of dengue viruses that result in local
epidemics [30]. Datasets were available for related analyses through international cooperation.
Considering the similar meteorological and demographical situation of dengue to Taiwan, five
coastal provinces in Thailand were selected to compare with the model fitting in Taiwan. The
five provinces are (a) Phetchaburi, (b) Prachuap Khirikhan, (c) Chumphon, (d) Surat Thani and
(e) Nakhon Sitammarat. Since there were only reported dengue cases available in Thailand’s
data, we replaced confirmed dengue by reported dengue in Thai’s models. Both meteorological
and epidemiological data were kindly offered by Dr. Mathuros Tipayamongkholgul in Mahido
University, Thailand.
4.5 Statistical analyses
All laboratory-confirmed daily dengue cases, according to the date of onset of dengue
illness, were summed into total case numbers in bi-weekly intervals for data analysis. The mean
value of each meteorological variable was also calculated for each biweekly interval.
Abbreviations of all variables analyzed are listed in the Table. As the effects of imported
18
dengue and meteorological factors on indigenous dengue logically had a time lag, we thus
tested different time lags for each variable from lag 1 up to lag 12 (lag 1 representing two
weeks, lag 2 representing four weeks, and so on)
4.5.1 Logistic and Poisson regression models
Logistic regression was used to analyze the correlation between the
occurrence/increase of indigenous dengue and the number of imported cases, as well as the
correlation between the occurrence/increase of indigenous dengue and each meteorological
variable across various time lags (from 2 weeks to 24 weeks). Poisson regression was used
to analyze the correlation between the number of indigenous dengue cases and the number
of imported cases, as well as the correlation between the number of indigenous dengue
cases and quantitative data of each meteorological variable across time lags from 2 weeks
to 24 weeks. Regression with the negative binomial model [53] was used for
over-dispersed data. All models were adjusted by area (two dummy variables, area_KH
and area_TN), popd (area-specific population density), and sine24 plus cosine24 (the
oscillatory sine and cosine functions were used to model seasonal variations of dengue
cases [54] ).
4.5.2 Three phases in epidemics outbreak
Because the quantitative relationship between indigenous and imported dengue cases
may exist only at the onset of local dengue epidemics, we further divided all bi-week
intervals into three categories for further analysis: 1) Period of “low intensity
transmission”: From March to May during our study period, 94.44% (170/180) of bi-week
intervals during these three months had no indigenous dengue cases in these studied areas.
2) Period of “early phase of outbreaks”: Those bi-week intervals presenting <10
indigenous dengue cases for months excluding March to May. 3) Period of “late phase of
outbreaks”: Those bi-week intervals presenting ≧10 indigenous dengue cases. Further
information on these regression models are listed in the Appendix 1.
4.5.3 The contents of regression models
1. Modeling the temporal correlation between “Occurrence” of indigenous dengue and
variables: Occurrence (y/n) ~ sin24 + cos24 + two dummy variables for areas+
population density + tested lagged variable, link = logistic, family = binomial
2. Modeling the temporal correlation between “Increase” of indigenous dengue and
variables: Increase (y/n) ~ sin24 + cos24 + two dummy variables for areas+
population density + tested lagged variable, link = logistic, family = binomial
3. Modeling the temporal correlation between the number of indigenous dengue and
variables: Case (count) ~ sin24 + cos24 + two dummy variables for areas+ population
density + tested lagged variable, link = log-linear, family = negative binomial
20
4. Modeling the temporal correlation between the number of indigenous and imported
dengue in Period of “low intensity transmission” (Those bi-week intervals were from
March to May):
Case (count) in Period of “low intensity transmission”~ sin24 + cos24 + two dummy
variables for areas+ population density + tested lagged variable, link = log-linear,
family = Poisson
5. Modeling the temporal correlation between the number of indigenous and imported
dengue in Period of “early phase of known outbreaks” (Those bi-week intervals
presenting <10 indigenous dengue cases for months excluded March to May):
Case (count) in Period of “early phase of known outbreaks”~ sin24 + cos24 + two
dummy variables for areas+ population density + tested lagged variable, link =
log-linear, family = Poisson
6. Modeling the temporal correlation between the number of indigenous and imported
dengue in Period of “late phase of known outbreaks” (Those bi-week intervals
presenting≧10 indigenous dengue cases):
Case (count) in Period of “late phase of known outbreaks”~ sin24 + cos24 + two
dummy variables for areas+ population density + tested lagged variable, link =
log-linear, family = negative binomial
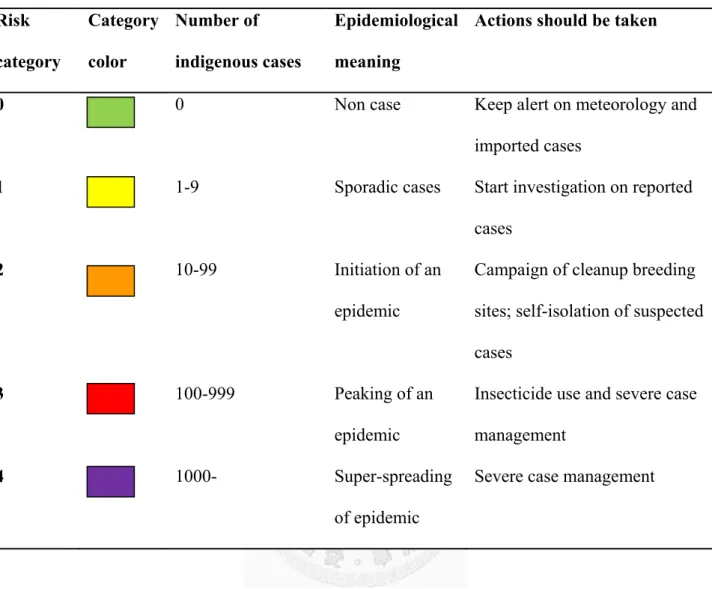
4.5.4 The definition of Dengue Risk Index (DRI)
Five categories (Table 2) were distinguished and identified by a digit number of 0, 1,
2, 3 and 4 respectively, representing different levels of indigenous dengue condition based
on the number of indigenous cases confirmed during a time interval, e.g. one month or two
weeks. The cut-off points of categories are 0, 10, 100 and 1000, which are not only
mathematically meaningful, but also epidemiologically. For most non-endemic countries
of dengue, there is usually zero indigenous cases, thus “0” is supposed to be a major group
for case number (color green). When there are cases no more than 10, it may just because
of sporadic diseases initiated by imported cases (color yellow). Furthermore, if case
number gets to between 10 and 99, it may represent a limited, local epidemic is happening
(color orange). An epidemic is obviously spreading if cases are over 100 (color red). The
situation of dengue is out of control when the number indigenous cases is higher than
1,000 (color purple).
4.5.5 Meteorological regression model
Statistical significant variable in univariate analyses were recruited into regression
model selection. Relevant variables selected by stepwise procedure were used to fit
observed and expected DRI, but also conduct out-of-fit to verify the prediction with
different datasets. In Taiwan’s part, these models were applied to calculate the expected
22
DRI for each bi-week interval during 1998 to 2007. Furthermore, out-of-fit of fitted
models were performed with data of year 2008 to predict the values of DRI. Similarly,
Thailand’s data from 1996 to 2004 were used to build up regression models, and year 2005
to predict DRI.
4.5.6 Comparison of different DRI forecasting methods
In order to validate the meteorological regression models in the use of predicting
DRI, we performed two other strategies for comparison by applying both Taiwan’s and
Thailand’s data from 1998 to 2005. As for forecasting, two classical approaches are
usually concerned. First is “continuous method”, which means predicting according to
what just happened. It is to move DRI curve with a certain lag forward as the prediction.
The second one, “historic method”, is predicting with the mean value of the past years. For
example, if we want to predict monthly DRI in 2001, the mean DRI of each month from
1991 to 2000 may be conducted to predict.
In order to testify the consistence between observed and expected values, Gamma,
Kendall’s Tau-b, Stuart’s Tau-c and Spearman’s rank correlation on ordinal data were
conducted. All formulas are adapted from User’s Manual of SAS and listed in Appendix 2.
Two-tailed p < 0.05 was regarded as statistically significant. The statistical analysis was
conducted using S-PLUS Enterprise Developer Version 8.0.4 (TIBCO Software Inc., Palo Alto,
CA, USA) and SAS 9.1.3 Service Pack 4 (SAS Institute Inc., Cary, NC, USA).
24
Chapter 5 Results
5.1 Logistic regression models for the occurrence and increase of indigenous dengue
cases: Univariate analyses
Figure 3 displays estimates of regression coefficients of independent variables (Xs) in the
logistical regression model for the “occurrence” of indigenous dengue cases. We found that the
variables of the number of imported cases (imported, p = 0.0023~0.0315) and daily
maximum/mean/minimum temperatures (tmax/tmean/tmin, p = 0.0002~0.0495) were positively
correlated. On the contrary, relative humidity (rh) was negatively correlated with indigenous
case occurrences (p <0.0001 ~ p = 0.0433). These findings indicate that an increase in imported
cases, in conjunction with warmer and drier weather, is favorable for the occurrence of
indigenous dengue. Among other meteorological variables, one sunshine related variable and
wind speed did not exhibit consistently significant relationships with indigenous dengue (data
not shown). However, Figure 4 reveals that, the influence of both imported cases and weather
conditions on the “increase” of indigenous dengue was less significant. In addition, when
binary outcomes were replaced with indigenous case counts (Figure 5), the quantitative
relationships between imported and indigenous dengue cases became insignificant.
5.2 Impact of imported dengue on indigenous dengue at three epidemic phases
In Figure 6, we observed variation in the impact of imported dengue at different epidemic
phases (please see definitions in Methods). Using Poisson models, we found that the imported
dengue cases were significantly correlated with indigenous dengue with lag 4 (i.e. 8 weeks)
only in periods of “low intensity transmission” (Figure 6A). However, this relationship was
more statistically significant in the “early phase of outbreaks” (Figure 6B). Imported dengue
had their greatest impact on epidemics during this phase. When local epidemics entered a
period of “late phase of outbreaks”, these correlations disappeared (Figure 6C), suggesting
that imported cases were unlikely to have influence on indigenous cases during this period.
These findings may indicate that imported dengue cases initiate local dengue cases almost
exclusively during the onset of an epidemic.
5.3 Poisson regression model fitted with meteorological variables of dengue cases
We attempted to fit the numbers of dengue cases with Poisson regression models, but it
did not show satisfactory results because the large variances of case numbers led to
over-dispersion.
5.3.1 Square root of case number
As shown in Figure 7A, although the square roots of case number replaced the case
26
numbers to lower the variance, the fitted case numbers are still out of expectation. The
same situation was also observed in using cubic root of case numbers.
5.3.2 Principal component analysis
To reduce the number of independent variables, we then compiled different time
lags of the same variable, i.e. factor of relative humidity (RH) may represent original rh
lag 1~8 with different weighted or adjusted process. Nevertheless, the fitting result for
the numbers of dengue cases was still poor (Figure 7B). In addition, the different lag of a
same variable is not independent one another, so the application of PCA is inappropriate.
5.3.3 Zero-inflated Poisson
In order to overcome the problem that zero dengue cases occurred over half of
time intervals, we used zero-inflated Poisson regression models to fit the numbers of
dengue cases. Unfortunately, the variation among numbers of dengue cases were too large
to fit Poisson distribution and the model fitting thus failed.
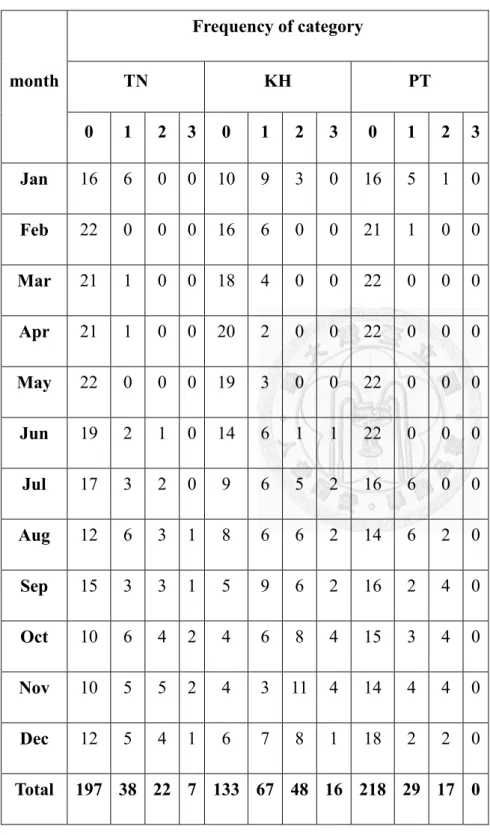
5.4 The distribution of monthly DRI
5.4.1 DRI in Taiwan and Thailand.
Figure 8A and 8B demonstrates monthly DRI from January 1998 to December
2005 in Taiwan and Thailand, respectively. (Taking the year of 1998 as an example, the
Taiwan’s health authority could be aware of the earlier peaking of DRI in Thailand. On the
contrary, if tourists from Thailand planned to visit Taiwan in 2002, they would have better
to be notified about the trend in increasing DRI in those months before August.
The temporal distributions of DRI in Taiwan and Thailand were very different. As
shown in Table 3A, the percentages of bi-weekly DRI (levels of 0, 1, 2, 3) in Taiwan
during 1998-2008 were 69.19% (548/792), 16.92% (134/792), 10.98% (87/792) and 2.90%
(23/792), respectively. The majority was level 0 (no confirmed indigenous dengue), and
most (58.18%, 64/110) of higher DRI (including level 2 and level 3) appeared in autumn
(September to November). On the other hand, the distribution of monthly DRI in Thailand,
listed in Table 3B was 1.33% (8/600), 12.67% (76/600), 66.50% (399/600), 18.83%
(113/600) and 0.67% (4/600) from 1996 to 2005. Level 2 was the most frequent level of
DRI, and higher DRIs were usually observed in summer (June to August). More frequent,
earlier and higher DRI in Thailand than in Taiwan actually reflect different endemicity of
dengue in the two countries. In other words, Thailand’s DRIs were earlier and higher than
Taiwan’s.
28
5.5 Correlation between monthly reported and confirmed DRI in Taiwan
The Pearson correlation coefficient between the number of confirmed and reported
dengue cases was 0.9833 (p<0.0001). Meanwhile, this Pearson correlation coefficient between
these numbers of confirmed dengue cases and DRI was 0.5770 (p<0.0001). On the other hand,
the Spearman correlation coefficient between these numbers of confirmed dengue cases and
DRIs was 0.9925 (p<0.0001), and such a coefficient between current DRI and previous DRI
was 0.7196 (p<0.0001). This analysis means that DRI is able to represent the tendency of
dengue incidence, as well as to be predicted by the DRI value of the previous month.
5.6 Comparison with different time unit of DRI
Daily levels of DRIs and the numbers of confirmed dengue cases were significant
correlated (R2=0.6780, p<0.0001), as well as biweekly DRIs and biweekly case numbers
(R2=0.9958, p<0.0001), and monthly DRIs and monthly case numbers (R2=0.9925, p<0.0001).
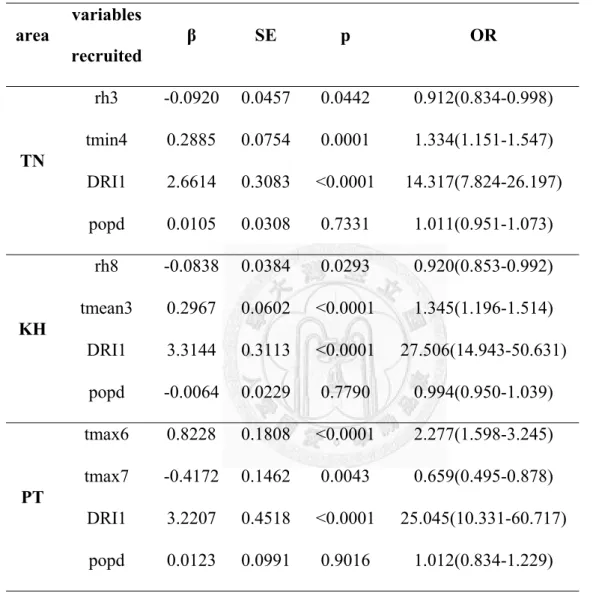
5.7 Predicting model of DRI
5.7.1 Meteorological models
5.7.1.1 Model fitting (1998-2007) and prediction (2008) in three areas in Taiwan
Table 4 shows area-specific regression models for indigenous DRI established
with local meteorological data during 1998 to 2007 in Taiwan. Selected weather
variables are temperatures and relative humidity with different time lag in different
areas. The DRI of previous bi-week explained most of correlation in models.
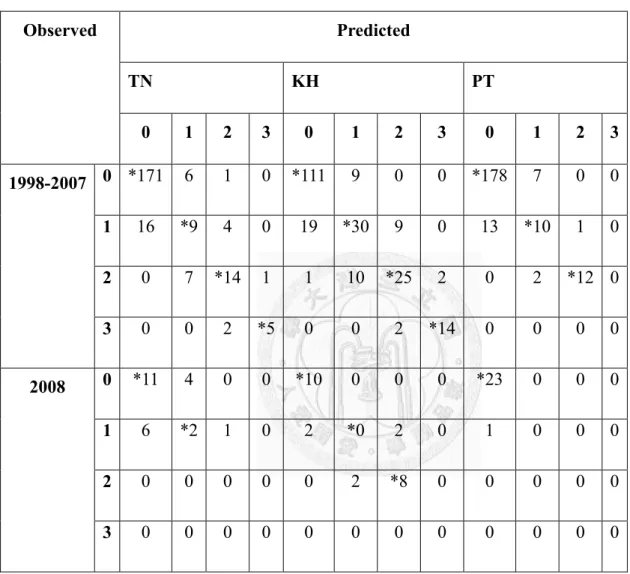
We examined the consistency comparison of observed and expected values of
DRI by area in Table 5A, and observed high concordance. The correlation diagnoses
in Table 5B support this finding. However, the harmony relationship disappeared in
area TN in 2008, the year after the ever largest epidemic of dengue in 2007. Figure 8
compares the two values with plotting curves, and the values of year 2008 after dash
line are out-of-fit. Most of time two curves go together, including most level zero and
infrequent level 3 in KH (2002, 2006) and TN (2007).
5.7.1.2 Model fitting (1996-2004) and prediction (2005) in five coastal provinces in
Thailand
Similar results were found in Thailand. In Table 6, most models include
relative humidity and temperatures in different time lags. The simplest model is area b,
province Prachuap Khirikhan, contains only daily mean temperature at lag 1 (tmean1).
The concordance between observed and expected values of DRI in Table 7 is
satisfying through areas during 1996 to 2004, while the predictability for DRI in year
2005 (Table 7B) is not stable in area a (province Phetchaburi) and e (province Nakhon
30
Sitammarat). The consistency between observed and expected category values is
varied among different provinces. Figure 9 compares the two values with plotting
curves, and the values of year 2008 after the red dash line are out-of-fit. The two
curves match most of time (Spearman correlation=0.66~0.77 in Table 7).
5.7.2 Comparison with different methods
In Table 7B and Table 5B, all fitted and predicted DRI were compared with the
correlation between current DRI and previous DRI (e.g. fitting with only previous DRI
and without meteorological variables). The results show that although the predictability
of DRI1 is good, the values fitted with regression models with meteorological variables
are better than the values of only previous DRI.
Chapter 6 Discussion
This study examined all laboratory-confirmed dengue cases detected through a
combination of active, semi-active, and passive surveillance, and found that imported dengue
are able to serve as an initial facilitator, or spark, for domestic epidemics. Nevertheless,
imported dengue cases do not have a noteworthy effect from March to May, during the low
transmission period of dengue in Taiwan. When these sparks meet suitable weather conditions,
the tinder, local dengue epidemics result. Eventually, this relationship does not persist once
biweekly indigenous case numbers rise over ten, indicating that a local epidemic has occurred.
Our findings thus provide evidence that a significant quantitative relationship between
Taiwan’s imported and indigenous dengue case numbers exists solely at the onset of an
epidemic and in the context of appropriate meteorological conditions. In addition, we also used
dengue risk index to describe the different endemicity of dengue in Taiwan and Thailand.
Although the DRI values in previous time intervals are able to fit current DRIs, we found
logistic regression models with meteorological variables improve the correlation between
observed and expected DRIs. The following discussion will focus mostly on the two major
parts of the results – the role of imported cases and meteorological factors and the dengue risk
index modeling.
32
6.1 The uniqueness of dengue analyses in Taiwan
To the best of our knowledge, this is the first study to simultaneously identify the
relationship between indigenous and imported dengue cases in the context of meteorological
factors. Our findings provide a highly accurate epidemiological portrait of dengue in Taiwan
because of the following components of the research: First, a better surveillance system was
instituted to actively rather than passively detect dengue cases. This system was also
laboratory-based to minimize confounding infection and manifestations [29,33,55,56]. Second,
we avoided a potential bias as a result of delays in dengue notification by analyzing all
confirmed dengue cases in accordance to their onset dates of illness rather than their reporting
dates. Third, all the dengue cases we analyzed are laboratory-confirmed plus the fact that fever
surveillance at airport to pick up mild cases and semi-active serological surveillance involving
even asymptomatically infected cases. All together makes our data source is closer to wide
spectrum of dengue infection, quite different from only severe dengue hemorrhagic cases are
required to be reported in many South East Asian countries where dengue has been endemic
and hyper-endemic.
6.2 The combined effect of imported dengue and meteorological factors
Because the numbers of imported dengue cases that initiate indigenous cases have been
increasing in non-endemic areas such as Taiwan [15,16,29,30] (further supported by the high
nucleotide identities of dengue viruses isolated from travelers with travel history to endemic
countries [29,30,33,36,57]), this study ventures to provide epidemiological evidence of the
combined impact of both imported dengue and weather conditions on local outbreaks.
Climate factors have provided helpful clues for monitoring dengue’s transmission in
affected areas [1,4,10,58]. Higher temperature has the effect of shortening the time intervals of
extrinsic incubation in the mosquito life cycle [10,59] and is positively correlated with more
occurrences of indigenous dengue in this study. This is consistent with previous findings that
demonstrate the suitability of warm or hot weather for the survivorship of adult mosquitoes and,
thus, dengue transmission [45,58]. In addition, although increased rainfall has been shown to
increase the number and quality of mosquito breeding sites (as well as the density of resting
sites) [1], lower rainfall and relative humidity (RH) were significantly related to indigenous
dengue in this study.
The correlation between lower RH and indigenous dengue with time lags was also
observed in previous studies in Thailand [60,61]. We explain this phenomenon as follows.
Drier conditions may facilitate dengue transmission through the increase of water storage
34
behavior, which result in an increase of breeding sites for Aedes mosquitoes, particularly in
areas without reliable water supplies [62-64]. Although piped water supply is available in 90%
of Taiwan (http://www.water.gov.tw/eng/08statistics/ sta_a_main.asp?bull_ id=4341), water
storage for gardening or agricultural use is popular during water restriction period in the dry
season, October to April, in southern Taiwan. In fact, a previous field survey identified water
buckets as the most common breeding sites of Ae. aegypti in southern Taiwan [65].
Entomologically, lower RH (50% vs. 90%) aids higher flight speed of female adult Ae. aegypti
at temperatures higher than 21 degrees of Celsius [66] thus facilitating dengue transmission.
This may explain why both RH and rainfall showed a negative correlation with the number of
indigenous dengue (Figure 4) and, that while higher temperatures occurred during July to
September in the summer of Taiwan, the number of indigenous dengue cases usually peak in
October-November.
On the other hand, although the correlation between drier conditions and increased
transmission is unlikely to be caused by higher temperatures, we acknowledge that the effects
of meteorological factors have a complex relationship. Unlike the consistent negative
correlation across lags 3-8 (rain) and lags 4-10 (rainhr) in Figure 4, the positive correlation of
“rain” and “rainhr” in Figure 3 occurred only in lag 9, and was therefore most likely a random
statistical anomaly rather than a conclusive finding. We believe that weather-based mechanisms
that support the proliferation of indigenous dengue therefore need further region-specific
investigation and more international collaboration.
6.3 The effect of vector control on epidemics of dengue
We consider that vector control efforts on dengue cases do not affect outbreak
initiation, but rather the size and magnitude of an outbreak. A dengue notification delay of over
one month allows for two transmission cycles, and increases the potential for a large outbreak
[67]. Vector control operations in Taiwan are unlikely to influence imported cases to initiate
local dengue epidemics because they are implemented after case notification [31]. By the time
indigenous dengue cases increase, the relationship with imported cases disappear (Figure 5C).
Hence, the focus of this study was to verify the correlation between imported dengue and the
onset of local dengue epidemics under appropriate weather conditions.
6.4 The increasing severity of dengue/DHF epidemics in Taiwan
Under suitable weather conditions, dengue viruses introduced via travelers are likely to
result in further domestic spread and subsequent occurrence of epidemics. In addition, the
introduction of more virulent genotypes of dengue viruses has been documented as a potential
factor for driving new epidemics [68-70]. For example, Thai strains belonging to the
36
1980-1994 clade within the genotype I of dengue virus serotype 1 (DENV-1) were replaced by
a 1990-2002 clade [30]. Additionally, an old clade in genotype I of DENV-3 during 1976-1978
was also replaced by a new 1991-2002 clade in genotype II [29,30]. Furthermore, cosmopolitan
genotypes of DENV-2, the causing agent of Taiwan’s largest-scale epidemic of dengue/DHF in
last thirty years, had been gradually and effectively replacing Asian genotype 2 in the
Philippines since 1998 and entered Taiwan in 2001 [71]. This cosmopolitan genotype of
DENV-2 is different from the Asian 1 and Asian 2 genotypes of Taiwan’s DENV-2 isolates
from 1981 to 1998 and the American/Asian genotype of Taiwan’s isolates in 2005, when the
majority of dengue cases were dengue fever [72]. In other words, the more virulent
genotypes/strains of the same serotype that have emerged during later years have resulted in
more severe and/or larger-scale epidemics of dengue/DHF in many Asian countries [68,70].
Based on phylogenetic analyses of dengue viruses isolated from imported cases [30] at
the micro-level, we find that local dengue epidemics in Taiwan typically originate in South
East Asia. It is therefore imperative to establish a stable surveillance system to detect the spread
of different genotypes of DENV. Currently, Taiwan’s comprehensive dengue surveillance
system is evolving and, hopefully, it may continuously monitor the possible evolution of
DENV in SE Asian countries through international collaboration. We believe that global
warming may have further impact on the incidence of imported dengue cases and future
dengue/DHF epidemics [73]. Advanced research integrating virus displacement and
meteorology will be necessary to provide a fuller understanding of both the macro and micro
changes contributing to the increasing severity of dengue/DHF epidemics.
6.5 Better interpretation with logistic and Poisson regression models
In order to construct the best possible regression models to reflect meteorological
conditions, we built alternative statistical models to demonstrate the role of imported cases in
the onset of dengue epidemics. Previous modeling studies using ARIMA (Autoregressive
Integrated Moving Average) found that the number of imported dengue cases was not
associated with the incidence of local dengue [19,20]. ARIMA examined a linear relationship
between case numbers of imported dengue cases and incidence of indigenous dengue cases
over several time lags. However, the quantitative relationship between imported and indigenous
dengue was likely limited to the onset (i.e. early phase) of outbreaks, and was therefore not
subject to linear modeling. We believe these conclusions by logistic and Poisson regression
models are not only demonstrable in countries with distinct seasonality, but also applicable in
non-endemic areas of dengue. However, meteorological conditions may need to be modified
for countries in higher altitudes.
38 6.6 Application of DRI to dengue control
This study performed a new categorical system, Dengue Risk Index, to quantify the risk
of local epidemics of dengue with both Taiwan and Thailand’s data. The risk of indigenous
dengue is able to be forecasted with previous case number and weather, such as weather
forecasting, as an early warning signal. Using real-time meteorological and epidemiological
information, public health officials are able to apply this DRI system and then easily
communicate with its prediction results to the public and international travelers. The timeliness
is better than currently used surveillance systems of dengue focused on human cases reporting
or entomological survey for earlier prevention and control of dengue before an epidemic starts.
For practical concerns, it is supposed to be more convenient to apply DRI in routine
surveillance. Since the calculation of DRI is to sum up total case numbers, once case are
confirmed, DRI is able to be announced immediately. Every month or two weeks, each country
or region may have area-specific real-time monthly or bi-weekly DRI. Accompanying with
weather forecasting information, region-specific DRI can be projected. In addition to evaluate
traveling risk, the most important usage of predicting DRI is for governmental disease
prevention and control. Moreover, international collaboration on dengue control will be
feasible through sharing newest nationwide DRI data from open-channel internet system.
6.7 The predictability of newly developed DRI models
Comparing with case number prediction in a variety of mathematical models for dengue
epidemics, polytomous (ordinal) logistic category models have much less variance in
distributed numbers. Therefore, it is much less fluctuated but more informative. The
cumulative-odds model in polytomous logistic regression is often considered most appropriate
in dealing with categorized data [74]. It is thus straightforward to interpret the effect of
independent variables with odds ratio by regression models.
The correlations of local weather variables with DRI in Taiwan were similar to in
Thailand, although their statuses of dengue endemicity were different. Temperatures and
relative humidity are the two statistically significant weather variables in regression models
after stepwise variable selecting process. Higher temperatures, including daily
mean/minimum/maximum temperature, and lower relative humidity were observed related with
higher DRI. However, when more than one lags of the same weather variable were selected, the
coefficient became puzzling. These regression models are not able to afford comprehensive
details, but offer a simple and direct method to detect possible occurrence of local dengue
epidemics.
The non-endemicity of Taiwan’s dengue status was observed in DRI exploration. The
annual local epidemics of dengue, caused by different serotypes and/or genotypes of dengue
40
viruses, have been mostly initiated by imported cases in the past three decades [30]. Therefore,
mean DRI in most months within one year is zero. Even the epidemics start, high values of DRI
seldom appear and usually vanish in winter. On the contrary, mean DRI in Thailand is two and
number of cases peak before summer.
6.8 Limitations
This study had notable limitations. First of all, meteorology alone does not initiate an
epidemic. Herd immunity also plays a decisive role in the spread of disease. Once a new or
more virulent genotype/strain of dengue virus is introduced, public health officials should alert
the public and implement prevention efforts regardless of meteorological conditions. Second,
local entomological data from Taiwan’s entomology surveillance was not included.
Non-government scholars do not have access to such data prior to 2002. Furthermore, the data
was divided by village or “Li” – the basic administration unit in Taiwan, and was not
systematically collected with a standardized process. Therefore, we did not use entomological
data because of its lack of consistency and inability to adequately represent the locations
covered in our study. Lastly, although socioeconomic status may influence vector habitat [75],
it was assumed to be relatively stable during the studied ten years.
6.9 Future direction
As an increase in viremic international travelers has led to global increasing DHF case
numbers to surge in recent two to three decades [24], efficient measures have to be instituted to
prevent imported dengue cases from igniting local dengue/DHF epidemics. Additionally, it has
been previously found that DHF cases with higher viral load [76] appeared when the number of
dengue fever cases increased rapidly, particularly in areas with higher dengue clusters [77].
Advanced investigation and integration of immunological, virological, meteorological, and
entomological findings with prevention/control strategies will support a more comprehensive
understanding of the mechanisms that initiate dengue epidemics, and will help guide realistic
public health interventions in the era of rapid globalization and climate change [78].
The established DRI method from this dissertation research using ordinal logistic
regression incorporating with Taiwan’s data first and then extended to Thailand’s data imply
that DRI is a feasible approach from the initial concept of prediction with different warning
color flags to implementation for travelers crossing different countries. For public health
practical application, it is necessary to investigate the feasibility by using more data obtained
from different regions, such as other countries in the South East Asia, Caribbean and South
America, and to testify the reliability of meteorology-based DRI on epidemics prediction across
different geographical areas and climate zones. Using data of case number on WHO’s website
42
and the same log scale of dengue cases for different countries, the overall picture of where is
global endemicity of dengue with higher risk levels, better than case number alone, is easily
understandable to general public and local/regional public health officials. Future efforts in
combining with local weather information into regression models, the possible impact of
climate change on increasing DRI is able to be quantified and supported with probability
calculation. In other words, this study and further investigation efforts will enlighten decision
makers by providing an evidence-based projection of how many people will be under the risk
of dengue in the future.