S EISMIC B EHAVIOR OF RC C OLUMNS WITH V ARIOUS T IE C ONFIGURATIONS
By Y. L. Mo,
1Member, ASCE, and S. J. Wang
2ABSTRACT: To expedite the fabrication of reinforcement cages of columns, a new configuration of transverse reinforcement with alternate ties for columns is proposed. To evaluate the effect of such a configuration on the seismic performance of the column, nine reinforced concrete columns with a cross section of 400 ⫻ 400 mm were tested. Except for the transverse reinforcement, all columns were designed according to the seismic pro- visions of the American Concrete Institute. The tie configuration and axial load were the two main parameters investigated in the experimental program. It was found from the test results that the proposed configuration of transverse reinforcement provides comparable or improved seismic performance in terms of member ductility and energy dissipation capacity to those usually used in design, and the requirement for compression lap splice in the ties is also adequate when the proposed alternate configuration of transverse reinforcement is used.
FIG. 1. Categories of Reinforcement Configurations
INTRODUCTION
The current design code requirements [Canadian Standards Association (CSA) 1994; American Concrete Institute (ACI) 1995; Standards Association of New Zealand (SANZ) 1995]
for the proportioning of confinement reinforcement do not re- late the required amount of transverse reinforcement to rein- forcement configuration. Recently Sheikh and Khoury (1997) proposed a performance-based approach for the design of con- finement reinforcement in tied columns. The effectiveness of confining steel primarily depends on the volume of concrete that can be confined and the distribution of confining pressure.
The function of the transverse reinforcement also is highly affected by the distribution of longitudinal and transverse re- inforcement and the extent of transverse restraint provided to the longitudinal bars. Sheikh and Khoury (1997) divided re- inforcement configurations into three categories (Fig. 1): (1) Category I, where only single-perimeter hoops are used as confinement reinforcement; (2) Category II, where, in addition to the perimeter hoops supporting four corner bars, at least one middle longitudinal bar at each face is supported at alter- nate points by hooks that are not anchored in the core, whereas at other points the supporting hooks are anchored in the core;
and (3) Category III, in which a minimum of three longitudinal bars are effectively supported by tie corners on each column face and hooks are anchored into the core concrete.
Reinforcement cages for reinforced concrete (RC) structures are traditionally connected by tie wire; however, robots in a factory using tack welds to improve productivity can now pre- fabricate them. Some construction firms have done a great deal of research into robotics and semiautomated construction equipment. The purpose has been to improve the field pro- ductivity of craftsmen as a hedge against the labor shortages that are reportedly beginning to occur in the construction mar- ket (Neilsen 1992). To maintain the competitive building con- struction, it is essential to increase what one worker can do while continuing to provide the quality that is expected by owners and the construction companies. The effect of tack weld on the ductility and strength of rebars has been studied
1Prof., Dept. of Civ. and Envir. Engrg., Univ. of Houston, Houston, TX 77204-4791; formerly, Prof., Dept. of Civ. Engrg., Nat. Cheng Kung Univ., Tainan 701, Taiwan.
2Res. Asst., Nat. Ctr. for Res. on Earthquake Engrg., Taipei 106, Tai- wan.
Note. Associate Editor: Brad Cross. Discussion open until March 1, 2001. To extend the closing date one month, a written request must be filed with the ASCE Manager of Journals. The manuscript for this paper was submitted for review and possible publication on March 2, 1999.
This paper is part of the Journal of Structural Engineering, Vol. 126, No. 10, October, 2000.䉷ASCE, ISSN 0733-9445/00/0010-1122–1130/
$8.00⫹ $.50 per page. Paper No. 20373.
elsewhere (Mo and Kuo 1995). Recently a new configuration of transverse reinforcement with alternate ties for RC columns was proposed by Mo and Hwang (1999). It is shown in their study that the lap splice length of the alternate ties used as shear reinforcement is sufficient when the compression lap splice requirement (ACI 1995) is satisfied. In this paper, the RC columns with alternate ties are further compared to those with code-specified stirrups by tests to investigate the effect of configuration of transverse reinforcement on the seismic behavior of RC columns. In total, nine RC columns were tested. It was found from the test results that the configuration of transverse reinforcement with alternate ties provides better seismic performance than those configurations usually used.
RESEARCH SIGNIFICANCE
A new configuration of transverse reinforcement with alter- nate ties was proposed recently (Mo and Hwang 1999) to op- timize the fabrication process of reinforcement cages. It was found from Mo and Hwang (1999) that the lap splice length of the alternate ties is sufficient when the compression lap splice requirement according to the 1995 ACI code is satisfied.
In this test series, nine RC columns with a cross section of 400 ⫻ 400 mm were tested to investigate the effect of the configuration of transverse reinforcement on the seismic be- havior of RC columns. The effect of axial force on such col- umns also is studied.
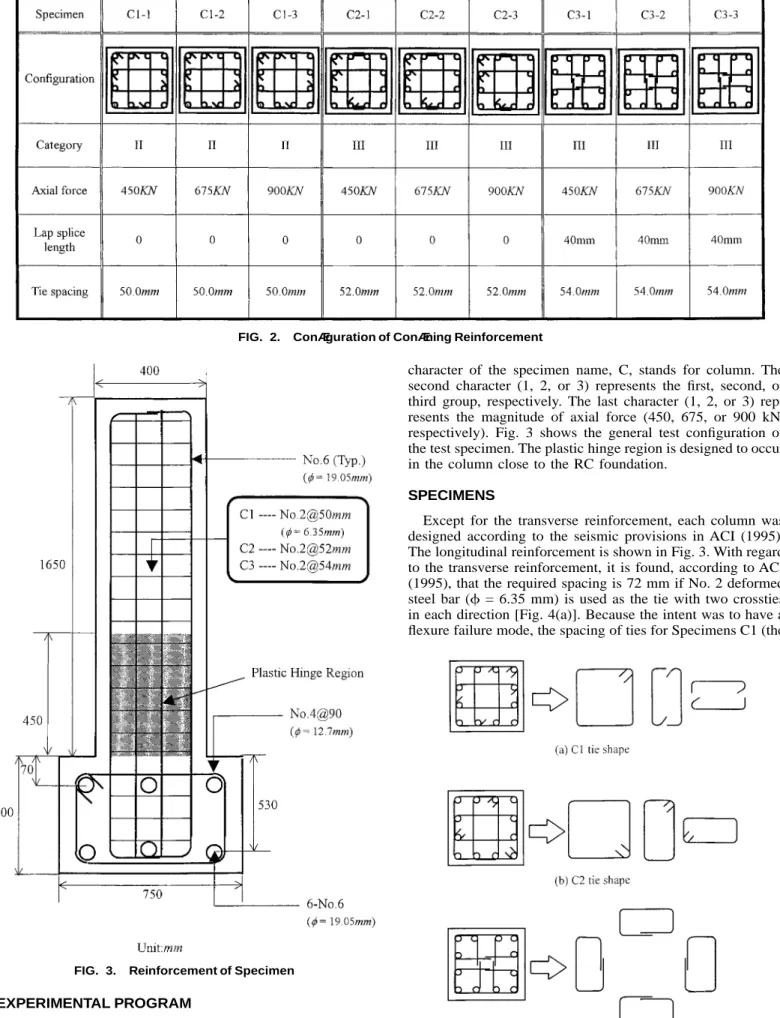
FIG. 2. Configuration of Confining Reinforcement
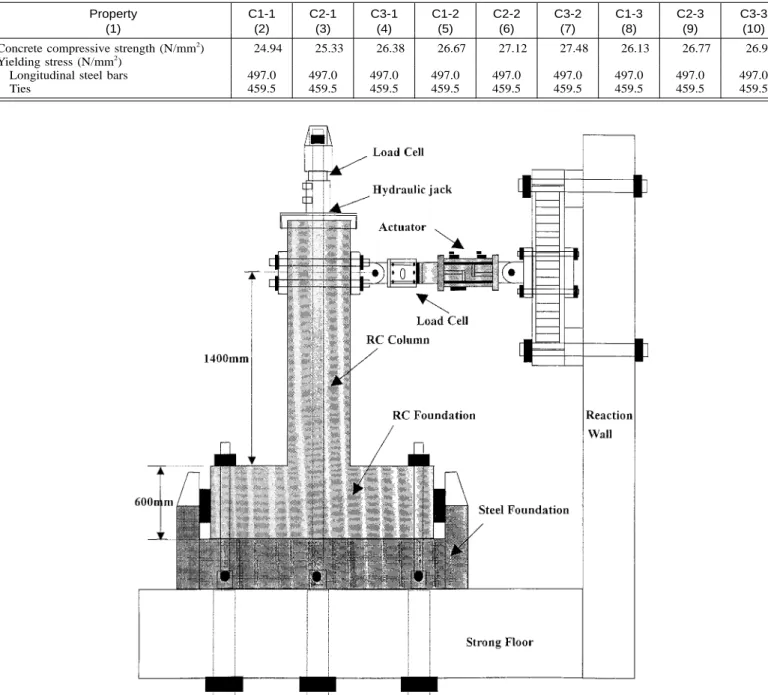
FIG. 3. Reinforcement of Specimen
FIG. 4. Tie Shape
EXPERIMENTAL PROGRAM
In the test program, the parameters investigated are config- urations of transverse reinforcement and axial force. As shown in Fig. 2, nine RC columns were designed and tested. The first
character of the specimen name, C, stands for column. The second character (1, 2, or 3) represents the first, second, or third group, respectively. The last character (1, 2, or 3) rep- resents the magnitude of axial force (450, 675, or 900 kN, respectively). Fig. 3 shows the general test configuration of the test specimen. The plastic hinge region is designed to occur in the column close to the RC foundation.
SPECIMENS
Except for the transverse reinforcement, each column was designed according to the seismic provisions in ACI (1995).
The longitudinal reinforcement is shown in Fig. 3. With regard to the transverse reinforcement, it is found, according to ACI (1995), that the required spacing is 72 mm if No. 2 deformed steel bar ( = 6.35 mm) is used as the tie with two crossties in each direction [Fig. 4(a)]. Because the intent was to have a flexure failure mode, the spacing of ties for Specimens C1 (the
FIG. 5. Test Setup
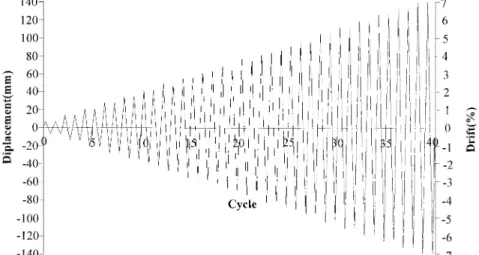
TABLE 1. Material Properties of Specimens Property
(1)
C1-1 (2)
C2-1 (3)
C3-1 (4)
C1-2 (5)
C2-2 (6)
C3-2 (7)
C1-3 (8)
C2-3 (9)
C3-3 (10) Concrete compressive strength (N/mm2) 24.94 25.33 26.38 26.67 27.12 27.48 26.13 26.77 26.90 Yielding stress (N/mm2)
Longitudinal steel bars 497.0 497.0 497.0 497.0 497.0 497.0 497.0 497.0 497.0
Ties 459.5 459.5 459.5 459.5 459.5 459.5 459.5 459.5 459.5
first group) is designed to be 50 mm, according to ACI (1995).
In the second group of transverse reinforcement, closed loops are used instead of separate crossties [Fig. 4(b)]. To obtain the same ratio of confinement reinforcement as that in the first group, the spacing of ties for Specimens C2 is found to be 52 mm. In the third group of transverse reinforcement the pro- posed alternate tie configuration [Fig. 4(c)] is used. If the cross section of Specimens C1 with four bars to resist shear force is simulated by the alternate configuration of transverse rein- forcement, both ends of the alternate ties need to have a lap splice, as shown in Fig. 2 for Specimens C3. It should be noted that the lap splice length of Specimens C3 is 40 mm, based on the requirement of ACI 12.16.1 (ACI 1995) for compres- sion lap splice. Also, the spacing of ties for Specimens C3 is found to be 54 mm to keep the same ratio of confinement reinforcement as in the first and second groups. Based on the reinforcement configuration category defined by Sheikh and Khoury (1997), the category for each of the nine specimens also is indicated in Fig. 2. These alternate ties, aimed at au- tomation in construction, are currently promoted by the con-
struction industry in Taiwan. Table 1 indicates the concrete compressive strengths and reinforcing steel strengths used in the specimens. It should be noted that tack welding was not used in all nine specimens tested in this study because the main purpose of this research is to investigate the effect of tie configuration on seismic performance of RC columns only.
TEST SETUP AND LOADING SEQUENCE
A schematic drawing of the test setup is shown in Fig. 5.
The specimen was mounted vertically with the bottom of the RC foundation resting in a steel foundation. The end of the column was loaded by a hydraulic jack and controlled to pro- vide a constant axial force varying from 450 to 900 kN (i.e., from 0.1 f⬘Ac g to 0.2 f⬘A )c g . The column was subjected to re- versed cyclic loading by an actuator that was horizontally mounted to a reaction wall. The actuator had a capacity of 500 kN and was capable of moving the column 150 mm in both positive and negative directions. A displacement of 150 mm corresponds to a column drift (ratio of horizontal displacement
TABLE 2. Experimental Results of All Specimens
Speci- men
(1)
Yielding Displacement
(mm)
⫹ (2)
⫺ (3)
Aver- age
(4)
Yielding Load (kN)
⫹ (5)
⫺ (6)
Aver- age
(7)
Ultimate Displacement
(mm)
⫹ (8)
⫺ (9)
Aver- age (10)
Maximum Load (kN)
⫹ (11)
⫺ (12)
Aver- age (13)
Ductility Factor
⫹ (14)
⫺ (15)
Aver- age (16)
Energy dissipation
(kN-mm) (17)
Failure mode
(18) C1-1 16.34 15.73 16.04 215.82 213.16 214.49 85.05 90.98 88.02 251.02 248.97 250.00 5.21 5.78 5.50 344,675.2 Flexure C2-1 17.41 17.57 17.49 208.63 196.29 202.46 98.62 103.43 101.03 248.05 238.53 243.29 5.66 5.89 5.78 472,665.3 Flexure C3-1 17.02 17.08 17.05 201.54 202.12 201.83 97.69 100.80 99.25 234.62 252.44 243.53 5.74 5.90 5.82 431,643.4 Flexure C1-2 17.64 17.48 17.56 242.66 241.47 242.07 95.46 93.47 94.47 267.58 261.47 264.53 5.41 5.35 5.38 463,477.0 Flexure C2-2 16.74 18.46 17.60 236.08 265.14 250.61 100.21 98.41 99.31 260.50 285.64 273.07 5.98 5.33 5.65 515,284.9 Flexure C3-2 19.12 16.96 18.04 240.72 242.68 241.7 107.24 99.79 103.52 259.52 282.47 271.00 5.61 5.87 5.74 525,245.4 Flexure C1-3 17.71 17.73 17.72 245.85 246.12 245.97 82.10 104.17 93.14 305.12 305.48 305.30 4.64 5.88 5.26 471,402.8 Flexure C2-3 17.75 17.95 17.85 271.98 242.63 257.31 93.35 97.57 95.46 303.76 305.12 304.44 5.25 5.44 5.35 473,566.4 Flexure C3-3 19.60 16.00 17.80 277.99 223.88 250.94 88.61 103.31 95.96 299.56 302.73 301.15 4.52 6.46 5.49 596,957.6 Flexure Note: ⫹ means positive direction; ⫺ means negative direction; ultimate displacement = displacement corresponding to 80% of maximum load in descending branch.
FIG. 6. Displacement History
to column length) of 10.72%. Each specimen was instru- mented with load cells, displacement transducers, and strain gauges to monitor the behavior during testing.
The specimens were tested under displacement control. The displacement was increased by 7 mm (i.e., column drift of 0.5%) for every two cycles. The displacements followed a pre- determined displacement history defined in terms of column drift percentage. The displacement routine, shown in Fig. 6, consists of cycles with column drifts up to 7.0%. The displace- ment cycles were repeated to measure the strength degra- dation.
TEST RESULTS General Observations
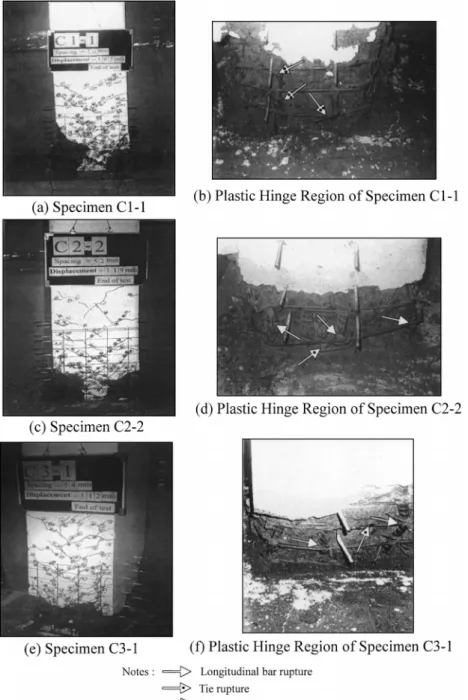
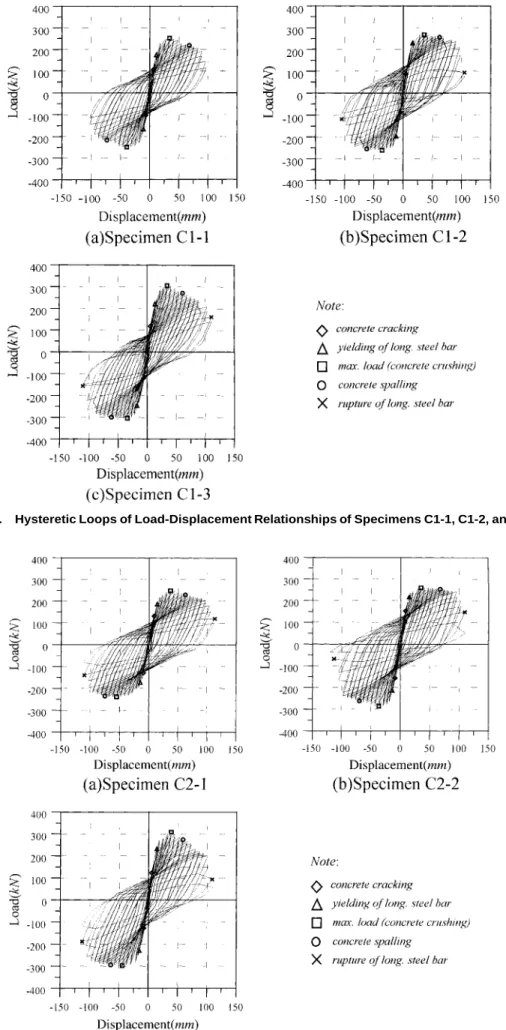
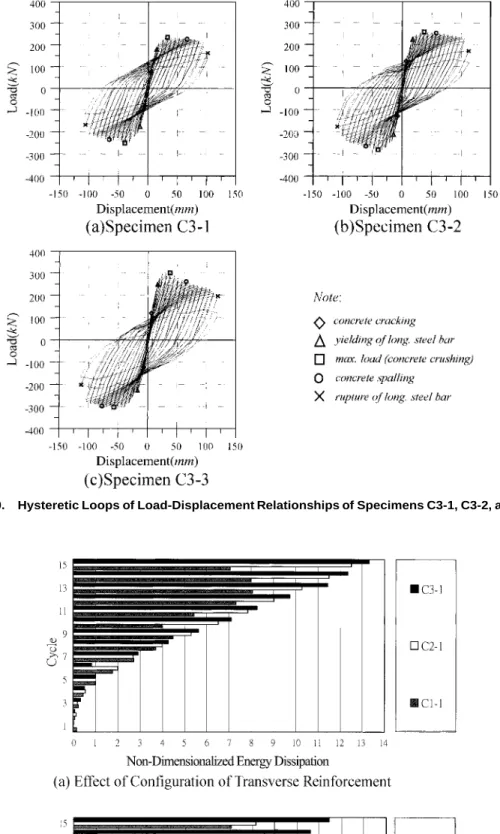
In all specimens the load at cracking varies from 75 to 159 kN, whereas the yield load and the maximum load varied from 201.5 to 278 kN and from 234.6 to 305.5 kN, respectively (Table 2). The first crack occurred in the direction perpendic- ular to the column axis in the plastic hinge region. Afterward, increasing loads produced more cracks in the plastic hinge region and the crack region increased gradually (Fig. 7). After the longitudinal bars yielded in tension, diagonal shear cracks occurred. Spalling of the concrete cover was followed by loos- ening of the crossties for the first group [Fig. 7(b)] and rupture of the ties for the second and third groups [Figs. 7(d and f)].
Finally, the longitudinal steel bars ruptured in all specimens except Specimen C1-1 (Figs. 8 – 10). The failure mode is flex- ure for all specimens.
Hysteretic Loops
The hysteretic loops of the load-displacement relationships for the first, second, and third groups are shown in Figs. 8 – 10, respectively. The concrete cracking, yielding of longitu- dinal steel bars, concrete crushing, concrete spalling, and rup- ture of longitudinal steel bars of each column also are indicated in Figs. 8 – 10. It can be seen from Figs. 8 – 10 that the structural behavior for each of the specimens is similar.
Based on the hysteretic load-displacement relationships, de- tailed comparisons of the specimens are made below, including ductility factor, dissipated energy, effect of axial force, and effect of configuration of transverse reinforcement.
Ductility Factor and Dissipated Energy
The ductility factor is defined as the displacement at a point corresponding to 80% of the maximum horizontal load on the descending branch divided by the displacement at the occur- rence of yielding of longitudinal steel bars. The dissipated en- ergy is determined by integrating the areas bounded by the hysteretic loops (Figs. 8 – 10). Table 2 also gives the experi- mental results of the ductility factor and dissipated energy for all specimens. In general, specimens with crossties have smaller dissipated energy. It can be seen from Table 2 that specimens with alternate ties have greater ductility; in contrast, specimens with crossties have less ductility. The nondimen- sionalized energy dissipation per cycle relationships are indi- cated in Fig. 11. It should be noted that the dissipated energy was divided by the energy dissipation bounded by the fifth
FIG. 7. Failure Modes and Crack Patterns
cycle to obtain the nondimensionalized energy dissipation for each cycle. For the effect of configuration of transverse rein- forcement, it can be seen from Fig. 11(a) that in the first sev- eral cycles the specimens in the third group do not necessarily have greater dissipated energy. However, in the final several cycles the specimens in the third group have greater dissipated energy. For the effect of axial load it also can be seen from Fig. 11(b) that specimens with higher axial load have greater dissipated energy when the ultimate state is reached. The rea- son is that higher axial load results in greater maximum load, which in turn produces greater area (dissipated energy) bounded by the load-displacement curve, as shown in Fig. 12.
Effect of Axial Force
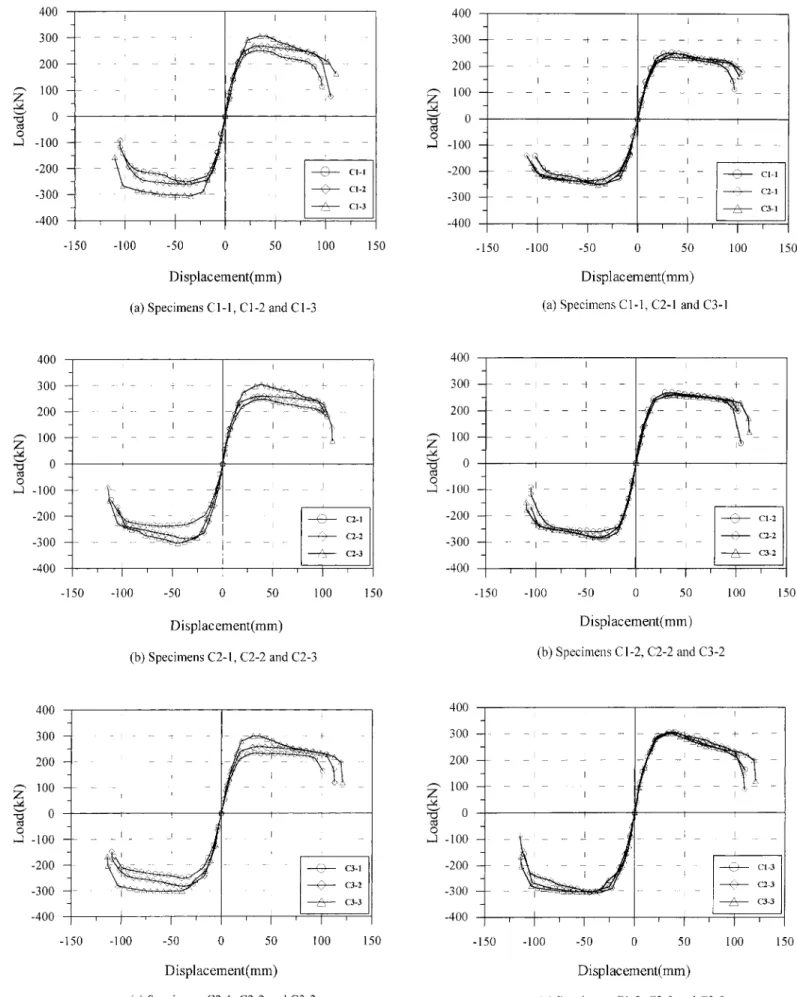
Fig. 12 shows the comparisons of lateral load-displacement envelopes for the three groups of columns with the same re- inforcement configurations and material strengths, but differ- ent axial force levels. As can be seen in Fig. 12, an increase in axial force typically results in a higher lateral load-carrying capacity for the columns. The smaller negative slopes in the
descending branch of the envelopes for the columns with higher axial forces indicate more significant P ⫺ ⌬ effects.
From Fig. 12 and Table 1, it can be concluded that, for the columns with a transverse reinforcement design satisfying the current design provisions (ACI 1995), the increase of axial force ratio from 0.1 to 0.2 implies a reduction of the displace- ment ductility for all three groups.
Effect of Configuration of Transverse Reinforcement
Fig. 13 shows the effect of configuration of the transverse reinforcement on the horizontal load-displacement curve. It can be seen from Table 2 and Fig. 13(c) that the performance of Specimens C2-3 and C3-3 is slightly better than Specimens C1-3 and C2-3, and for the remaining two groups with less axial forces the differences are smaller [Fig. 13(a and b)]. In other words, Specimen C3-3 is superior to Specimens C1-3 and C2-3 and the lap splice length of the stirrups based on the compression lap splice requirement (ACI 1995) was adequate.
FIG. 8. Hysteretic Loops of Load-Displacement Relationships of Specimens C1-1, C1-2, and C1-3
FIG. 9. Hysteretic Loops of Load-Displacement Relationships of Specimens C2-1, C2-2, and C2-3
FIG. 10. Hysteretic Loops of Load-Displacement Relationships of Specimens C3-1, C3-2, and C3-3
FIG. 11. Energy Dissipation
FIG. 12. Effect of Axial Load on Load-Displacement Relation- ships
FIG. 13. Effect of Configuration of Transverse Reinforcement on Load-Displacement Relationships
CONCLUSIONS
To expedite the fabrication of reinforcement cages of col- umns, a new configuration of transverse reinforcement for RC columns is proposed. The seismic performance of the new configuration of transverse reinforcement is examined by tests.
The experimental results show that the new configuration of transverse reinforcement with alternate ties provides compa- rable or improved seismic performance than typical configu- rations normally used in construction. Finally, it is further es- tablished that current ACI requirements for compression lap splices is adequate when the proposed configuration of trans- verse reinforcement with alternate ties is used.
ACKNOWLEDGMENTS
Support for this research by Tainan Construction Co., Ltd., Taiwan, is gratefully acknowledged. The measurement equipment was financially supported by a research grant from the National Science Council, NSC 86-2621-P-006-028, Taiwan.
APPENDIX. REFERENCES
American Concrete Institute (ACI). (1995). ‘‘Building code requirements for reinforced concrete.’’ ACI 318-95, Detroit.
Canadian Standards Association (CSA). (1994). ‘‘CAN code for design of concrete structures for buildings.’’ 9CAN3-A23.3-M94, Rexdale, Ont., Canada.
Mo, Y. L., and Hwang, M. L. (1999). ‘‘New configuration of lateral steel for RC columns.’’ Pract. Periodical on Struct. Des. and Constr., ASCE, 4(3), 111–118.
Mo, Y. L., and Kuo, J. Y. (1995). ‘‘Effect of welding on ductility of rebars.’’ J. Mat. in Civ. Engrg., ASCE, 7(4), 283–285.
Neilsen, R. W. (1992). ‘‘Construction field operations and automated equipment.’’ Automation in Constr., 1(1), 35–46.
Sheikh, S. A., and Khoury, S. S. (1997). ‘‘A performance-based approach for the design of confining steel in tied columns.’’ ACI Struct. J., 94(4), 421–431.
Standards Association of New Zealand (SANZ). (1995). ‘‘NZS code of practice for the design of concrete structures.’’ Parts 1 and 2, Welling- ton, New Zealand.