Two-dimensional refractive index distribution measurement
of a GRIN lens
H. C. Hsieh
*, Y. L. Chen, W. T. Wu, W. Y. Chang, and D. C. Su
Department of Photonics and Institute of Electro-Optical Engineering,
National Chiao-Tung University, 1001 Ta-Hsueh Road, Hsinchu 30050, Taiwan, ROC
ABSTRACT
Based on the Fresnel’s equations and the phase-shifting method, an alternative method for measuring the refractive index distribution of a GRIN lens is presented. A linearly/circularly polarized light in order enters a modified Twyman-Green interferometer, in which an electro-optical modulator is used as a phase shifter. In the interferometer, the light beam is divided by a beam-splitter into two beams, a reference beam and a test beam. After they are reflected by a plane mirror and the tested GRIN lens, respectively, they are combined together and pass through an analyzer. The analyzer extracts the same polarized components to interfere each other, and the full-field interference signals produced by the components of the s- and the p-polarizations can be obtained. The full-field interference signals are taken by a CMOS camera. The phase differences can be obtained by using the four-step phase-shifting interferometric method. Substituting these two groups of data into special equations derived from Fresnel equations, and the two-dimensional refractive index distribution of the GRIN lens can be calculated. Its validity is demonstrated and has some merits such as simple optical configuration, easy operation and high resolution.
Keywords: Circularly polarized light, refractive index, GRIN lens, phase-shifting interferometry, electro-optic modulator
1. INTRODUCTION
The gradient-index (GRIN) lens is widely used in many fields such as the fiber communication, biomedical and industrial applications [1-2]. The correctness and symmetry of the refractive-index distribution directly influence its product quality. Therefore it is necessary to identify the full-field refractive index distribution of the GRIN lens in advance. Several apparatus [3-9] have been developed to measure the two-dimensional refractive index of the optical waveguide or the GRIN lens, and they have good results. In our previous paper [10], we developed a method to measure the two-dimensional refractive index distribution of a GRIN lens based on the oblique incident approach without the matching liquid. However, the camera must be set obliquely to grab the images in order to correct the ratio of lateral scales, and the depth of field of the imaging lens limits the oblique angle of the measured sample. For a larger oblique angle, the images are easy to be obscured. To overcome these drawbacks, an alternative method for measuring the two-dimensional refractive index distribution of the GRIN lens based on the Fresnel’s equations and the four-step phase-shifting interferometric technique. A circularly/linearly polarized light in order enters a modified Twyman-Green interferometer, in which an electro-optical modulator is used as a phase shifter. In the interferometer, the light beam is divided by a beam-splitter into two beams, a reference beam and a test beam. They are reflected by a plane mirror and the tested GRIN lens, respectively; they are combined together and pass through an analyzer. The analyzer extracts the same polarized components to interfere each other, and the full-field interference signals produced by the components of the s- and the p-polarizations can be obtained. The interferograms are collected and imaged by a set of imaging lenses to a CMOS camera. Next, the four-step phase-shifting interferometric technique is applied and two groups of four interferograms are taken by the CMOS camera under the condition that an additional phase difference π/2 is added
*[email protected]; phone +886-3-573-1951; fax +886-3-571-6631
Interferometry XV: Applications, edited by Cosme Furlong, Christophe Gorecki, Erik L. Novak, Proc. of SPIE Vol. 7791, 77910A · © 2010 SPIE · CCC code: 0277-786X/10/$18 · doi: 10.1117/12.860352
Proc. of SPIE Vol. 7791 77910A-1
EU
AL
FA1
between the two successive interferograms. The interferograms are sent to a personal computer to be analyzed and two dimensional phase distribution can be calculated. Then, substituting the data of these two groups into the special equations derived by using Jones calculus and the Fresnel’s equations, and the two dimensional refractive index distribution of the GRIN lens can be obtained. Its validity is demonstrated and has some merits such as simple optical configuration, easy operation and high resolution.
2. PRINCIPLE
2.1 The relation between the refractive index and the interference signal
The optical configuration of this method is shown in Fig. 1. For convenience, the z-axis is chosen along the light propagation direction, and the y-axis is along the vertical direction. After a linearly polarized light at 45° to the x-axis passes through an electro-optic modulator (EO) driven by a voltage power supply (VPS), its Jone’s vector can be expressed as [11] 2 2 ' ( ) 0 1 1 1 2 0 i i E EO E e e Γ Γ − = Γ ⎛ ⎞ ⎛ ⎞ ⎜ ⎟ =⎜ ⎟ ⎜ ⎟ ⎝ ⎠ ⎜ ⎟ ⎝ ⎠ 2 2 1 2 i i e e Γ Γ − ⎛ ⎞ ⎜ ⎟ = ⎜ ⎟ ⎜ ⎟ ⎝ ⎠ , (1)
where EO and E are the Jones matrices of the EO, and the incident light. From eq. (1), it can be seen that there is an additional phase difference Γ between the s- and the p-polarizations. Here, Γ is introduced by the EO which acts a
Fig. 1. Schematic diagram of this technique. LS: laser light source; EO: electro-optic modulator; VPS: voltage power supply; LVA: linear voltage amplifier; Q: quarter-wave plate; BS: beam-splitter; M: mirror; G: GRIN lens; AN: analyzer; IL: imaging lens; C: CMOS camera.
Proc. of SPIE Vol. 7791 77910A-2
phase-shifter. Then, the light beam enters a modified Twyman-Green interferometer, which consists of a beam-splitter BS, a quarter-wave plates Q2 with the fast axis at 45° with respect to the x-axis, a reference mirror M, a test GRIN lens
G, an analyzer AN with the transmission axis at 0° with respect to the x-axis, an imaging lens IL, and a CMOS camera C. In this interferometer, two optical paths are (1) BS Æ Q2 Æ M Æ Q2 Æ BS Æ ANÆ IL Æ C (the reference beam),
and (2) BS Æ S Æ BS Æ ANÆ IL Æ C (the test beam). Their amplitudes can be derived and expressed as
1 1 ( (0 ) 2( 45 ) 2(45 ) 1) i d r BS E = A N o ⋅R ⋅Q − o ⋅M Q⋅ o ⋅E ⋅eϕ 1 /2 2 /2 2 0 1 0 0 1 1 1 1 1 0 0 0 0 2 1 2 1 2 r d r i i m i i i m r e i i e e r i i e e ϕ ϕ ϕ Γ − Γ − ⎛ ⎞ ⎛ ⎞ ⎛− ⎞ − ⎜ ⎟ ⎛ ⎞ ⎛ ⎞ ⎛ ⎞ =⎜ ⎟⎜⎜ ⎟⎟ ⎜ ⎟⎜ ⎟ ⎜− ⎟ ⎜ ⎟ ⎝ ⎠⎝ ⎠ ⎝ ⎠⎝ ⎠ ⎝ ⎠ ⎜ ⎟ ⎝ ⎠ 1 ( /2) 2 1 0 2 d r i m ir e ϕ ϕ Γ − − ⎛ ⎞ = ⎜ ⎟ ⎝ ⎠, (2) and 2 1 ( (0 ) 1) i d t B S E = A N o ⋅ ⋅G R ⋅E ⋅eϕ 2 /2 2 /2 2 1 0 0 0 1 0 0 0 0 2 r d r i i i i i r e e e r e e ϕ ϕ ϕ Γ − Γ − ⎛ ⎞ ⎛ ⎞ ⎜ ⎟ − ⎛ ⎞⎛ ⎞ =⎜ ⎟⎜ ⎟⎜⎜ ⎟⎟ ⎜ ⎟ ⎝ ⎠⎝ ⎠⎝ ⎠ ⎜ ⎟ ⎝ ⎠ 2 ( /2) 2 1 0 2 d r i r e ϕ ϕ Γ+ − ⎛ ⎞ = − ⎜ ⎟ ⎝ ⎠. (3)
Here, RBS, M and G are the reflection matrix of the BS, M and G; rm and r are the reflection coefficients of the M and
the G; ϕ and d1 ϕ are the phase variations due to the optical path lengths of the reference and test beam, respectively. d2
r
ϕ is the phase difference between x- and y-polarizations coming from the reflection at BS. Thus, the interference signals recorded by the C can be written as
2 A 1 1 0 1 1 co s( 1) r t I E E I γ ϕ = + = + ⋅ Γ + 2 2 1 2 1 2 cos ( ) 2 r rm r rm 2 d d π ϕ ϕ ⎧ ⎡ ⎤⎫ = ⎨ + − ⎢Γ + − − ⎥⎬ ⎣ ⎦ ⎩ ⎭, (4)
where I01, and γ1 and ϕ are the mean intensity, the visibility and the phase of the interference signal, respectively. From 1
Eq. (4), we have
1 ( 1 2) 2 d d
π
ϕ = − ϕ −ϕ . (5)
Secondly, the quarter-wave plate Q1 with the fast axis at 45° to the x-axis is inserted into the optical setup as shown in
Fig. 1 and the light becomes
2 1 1 2 2 (45 ) 1 1 1 2 i i E Q E i e i e Γ Γ − = ⋅ ⎛ ⎞ ⎜ ⎟ − ⎛ ⎞ = ⎜− ⎟⎜ ⎟ ⎝ ⎠⎜ ⎟ ⎝ ⎠ o
Proc. of SPIE Vol. 7791 77910A-3
cos( ) sin( ) 1 2 2 2 cos( ) sin( ) 2 2 i Γ Γ ⎛ − ⎞ ⎜ ⎟ − = ⎜ ⎟ Γ Γ ⎜ + ⎟ ⎜ ⎟ ⎝ ⎠ 2 1 2 1 1 1 2 2 i i i e e i Γ −Γ − ⎛ ⎞ ⎛ ⎞ = ⎜ ⎟ + ⎜ ⎟ − ⎝ ⎠ ⎝ ⎠ . (6)
From Eq. (6), we can see that there is a phase difference Γ between the right- and the left- circular polarizations. The amplitudes of the reference beam and the test beam can be derived as above and expressed as
1 2 ( (0 ) 2( 45 ) 2(45 ) 2) i d r B S E = A N o ⋅R ⋅Q − o ⋅M Q⋅ o ⋅E ⋅eϕ 1 /2 /2 cos( ) sin( ) 0 1 0 0 1 1 1 1 1 2 2 0 0 0 0 2 1 2 1 2 cos( ) sin( ) 2 2 r d r i m i i m r e i i i e r i i e ϕ ϕ ϕ − ⎛⎜ Γ − Γ ⎞⎟ ⎛ ⎞ ⎛− ⎞ − ⎛ ⎞ ⎛ ⎞ ⎛ ⎞ − =⎜ ⎟⎜⎜ ⎟⎟ ⎜ ⎟⎜ ⎟ ⎜ ⎟ ⎜ ⎟ − ⎜ Γ Γ ⎟ ⎝ ⎠⎝ ⎠ ⎝ ⎠⎝ ⎠ ⎝ ⎠ ⎜ + ⎟ ⎝ ⎠ 1 ( /2) 1 1 [cos( ) sin( )] 0 2 2 2 d r i m i+ r Γ Γ e ϕ −ϕ ⎛ ⎞ = + ⎜ ⎟ ⎝ ⎠, (7) and 2 2 ( (0 ) 2) i d t BS E = A N o ⋅ ⋅G R ⋅E ⋅eϕ 2 /2 /2 cos( ) sin( ) 1 0 0 0 1 2 2 0 0 0 0 2 cos( ) sin( ) 2 2 r d r i i i r e i e r e ϕ ϕ ϕ − ⎛⎜ Γ − Γ ⎞⎟ ⎛ ⎞ − ⎛ ⎞⎛ ⎞ − =⎜ ⎟⎜ ⎟⎜⎜ ⎟⎟ ⎜ ⎟ Γ Γ ⎜ ⎟ ⎝ ⎠⎝ ⎠⎝ ⎠ ⎜ + ⎟ ⎝ ⎠ 2 ( /2) 1 1 [cos( ) sin( )] 0 2 2 2 d r i i− r Γ Γ e ϕ −ϕ ⎛ ⎞ = − ⎜ ⎟ ⎝ ⎠. (8)
Here the interference signals measured by the C can be written as
2 B r2 t2 I = E +E 02 2 cos( 2) I γ ϕ = + ⋅ Γ + , (9)
where I02, γ2 and ϕ are the mean intensity, the visibility and the phase of the interference signals, respectively. From 2
Eqs. (7) and (8), the phase can be calculated and written as
1 1 2 2 2 2 2 sin( ) cot ( ) m d d m r r r r ϕ ϕ ϕ = − ⎡⎢ − ⎤⎥ − ⎢ ⎥ ⎣ ⎦. (10)
According to Fresnel equations [12], r can be derived by substituting Eq. (5) into Eq. (10) and expressed as
2 2
1 1 2
2
cos cos cot 1
cot m 1 n r r n ϕ ϕ ϕ ϕ − + + − = = + , (11)
where n is the refractive index of G. Equation (11) can be rewritten as
Proc. of SPIE Vol. 7791 77910A-4
2 2
2 1 1 2
2 2
2 1 1 2
cot cos cos cot cot cos cos cot
m m m m r r n r r ϕ ϕ ϕ ϕ ϕ ϕ ϕ ϕ − + + = + − + . (12)
Subsequently, the refractive index distribution n(x,y) can be calculated by substituting the associated data ϕ and 1 ϕ can 2 into Eq. (12).
2.2 Phase measurement with the phase-shifting interferometric technique
The phase-shifting interferometric technique [12] is applied to measure the two-dimensional phase distribution ϕ( , )x y . The CMOS camera takes four interferograms by changing the voltage applied to the EO. An extra phase difference π/2 is added between two successive interferograms. The intensities of these four interferograms can be written as
[
]
1( , ) 0( , ) 1 cos(0 ( , ) I x y =I x y + +ϕ x y , (13a)[
]
2( , ) 0( , ) 1 cos( / 2 ( , ) I x y =I x y + π +ϕ x y , (13b)[
]
3( , ) 0( , ) 1 cos( ( , ) I x y =I x y + π ϕ+ x y , (13c) and[
]
4( , ) 0( , ) 1 cos(3 / 2 ( , ) I x y =I x y + π +ϕ x y . (13d)By solving the simultaneous equation, we get
1 4 2 1 3 ( , ) ( , ) tan ( , ) ( , ) I x y I x y I x y I x y ϕ= − ⎛ − ⎞ ⎜ − ⎟ ⎝ ⎠. (14)
Finally, substituting the measured data of ϕ and 1 ϕ into Eq. (12), then the two-dimensional refractive index distribution 2 can be estimated under the condition rm and φ are specified. r
3. EXPERIMENTS AND RESULTS
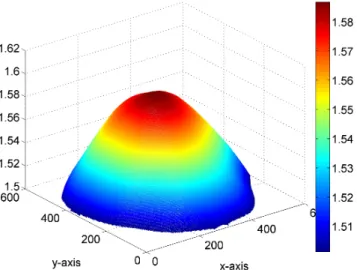
In order to show the feasibility, we tested a GRIN lens (ALC-18) with diameter 1.8mm. An He-Ne laser with 632.8 nm wavelength, a CMOS camera (Baslar/A504k) with 600×600 pixels and 8-bit gray levels were used. An electro-optic modulator (New Focus/model 4002) with a 148V half-wave voltage was also used. In our experiments, rm and φ were r measured to be 0.99 and 84.63°, respectively. Four interferograms were taken as the additional phase equals to 0, / 2π , π , and 3 / 2π . The interferograms were sent to a personal computer, and they were analyzed with the software “Matlab” (MathWorks Inc.). For easier reading, n(x,y) is displayed in color as shown in Fig. 2 and the associated refractive index contour was also depicted in Fig. 3.
4. DISCUSSION
To collect the reflected parallel beam from the GRIN lens and magnify the object simultaneously, it is better to use the imaging lens IL composed of a microscopic objective (MO) and a doublet (DL). Because the IL is an afocal optical system, the GRIN lens needs to be located in the front focal plane of the MO and the image plane of the CMOS camera should be correspondingly located in the rear focal plane of the DL. The transverse magnification of the IL in our experiments is -4.
The errors in the phase measurements in this method may be influenced by the following factors: (1) Characteristic phase error
The errors in V and Vπ directly introduce a systematic error Δφ0 to the characteristic phase φ0. The resolution of V from
the power supplier is ΔV1 = 0.016 V. Also Vπ can be measured [13] and its error is estimated ΔV2 = 0.015 V. Hence the
Proc. of SPIE Vol. 7791 77910A-5
Fig. 2. Two-dimensional refractive index distribution of the GRIN Lens.
Fig. 3.Refractive index contour of the GRIN Lens.
error of ϕ can be estimated and expressed as 0 2 2 1 2 0 0 ( V V1 ) ( V2/Vπ)
ϕ ϕ ⎡ ⎤
Δ = ⋅ Δ⎣ + Δ ⎦ . Because 1.5≤ ≤n 1.6, ϕ and 1 ϕ 2 can be assumed as φ1 ≈ 0° and 63.5° ≤ϕ2≤67.5°. Substitute them in turn intoϕ , the associated errors can be derived 0
as Δφ01 = 0° and Δφ02 ≈ 0.01°, respectively.
(2) Phase-resolution of the phase-shifting interferometry
The gray levels of minima and maxima of the interferograms are 0 and 255, respectively, as the phase-shifting interferometry is fully utilized. Thus, the theoretical resolution of the phase-shifting interferometryis about
360 1.406 256 s φ = = ° .
Proc. of SPIE Vol. 7791 77910A-6
(3) Polarization-mixing error
Owing to the extinction ratio effect of a polarizer, the mixing of light polarization occurs. In our experiments, the extinction ratio of the polarizer (Japan Sigma Koki, Ltd.) is 1 10× −5. It can be estimated in advance to modify the measured results. So, the polarization-mixing error can be decreased to ∆φp = 0.03° with this modification [14].
Consequently, the total errors of ∆φ1 and ∆φ2 are ∆φ1 = Δφ01 + Δφs + ∆φp = 1.436 and ∆φ2 = Δφ02 + Δφs + ∆φp = 1.446°,
respectively. From Eq. (14), the error of refractive index measurement in this method can be derived and expressed as
1 2 1 2 n n n ϕ ϕ ϕ ϕ ⎛ ∂ ⎞ ⎛ ∂ ⎞ Δ =⎜ ⎟⋅ Δ +⎜ ⎟⋅ Δ ∂ ∂ ⎝ ⎠ ⎝ ⎠
(
)
2 2 1 2 1 1 2 1 2 1 2 2 2 2 2 1 2 2 2 1 1 2sin sin 2 2 cos cos cot cos cos cot cos sin cos cos cot
m m r r ϕ ϕ ϕ ϕ ϕ ϕ ϕ ϕ ϕ ϕ ϕ ϕ ϕ ϕ ϕ Δ + Δ + − = ⎡ ⎤ + ⎢ + − + ⎥ ⎣ ⎦ . (15)
Substitute rm = 99 %, ϕ ≈ 0° and 1 63.5° ≤ϕ2≤67.5° into Eq. (15), ∆n ≈ 0.006 can be obtained.
In our previous oblique incidence method [10], the camera is set obliquely to correct the ratio of lateral scales, and the images are easy to be obscured for a larger oblique angle due to the limitation of the depth of field. In this paper, it is easy to align the imaging system with the normal incidence and get clear images. However, the oblique method is more sensitive for the phase variation by the variation of the refractive index. Its ∆n is around 3 10× −4, which is better than this method.
5. CONCLUSION
In this paper, an alternative method for measuring the two-dimensional refractive index of a GRIN lens has been proposed by combining Fresnel equations and the phase shifting interferometry. A circularly/linearly polarized light enters a modified Twyman-Green interferometer, and the full-field interference signals are taken by the CMOS camera. The two dimensional phase distribution can be obtained by using the four-step phase-shifting method. Substituting these two groups’ data of phase distribution into the special equations derived from Fresnel equations, and then the two-dimensional refractive index of the GRIN lens can be calculated. The validity of this method has been demonstrated. It has the merits of the phase shifting interferometry. In addition, it is simple and easily operated.
REFERENCES
[1] L. Cai, M. Zhang, P. Ye, and T. Li, “Polarization independent 4-stage OTDM multiplexer using plated GRIN lens,”
Opt. Express 16, 12544-12549 (2008).
[2] Y. Wu, J. Xi, M. J. Cobb, and X. Li, “Scanning fiber-optic nonlinear endomicroscopy with miniature aspherical
compound lens and multimode fiber collector,” Opt. Letters 34, 953-955 (2009).
[3] R. Oven, “Measurement of two dimensional refractive index profiles of channel waveguides using an
interferometric technique,” Appl. Opt. 48, 5704-5712 (2009).
[4] N. M. Dragomir, X. M. Goh, and A. Roberts, “Three-dimensional refractive index reconstruction with quantitative
phase tomography,” Microsc. Res. Tech. 71, 5-10 (2008).
[5] Y. Youk and D. Y. Kim, “A simple reflection-type two-dimensional refractive index profile measurement technique
for optical waveguides,” Opt. Commun. 262, 206-210 (2006).
[6] D. Vazquez, E. Acosta, G. Smith, and L. Garner, “Tomographic method for measurement of the radient refractive
index of the crystalline lens. II The rotationally symmetrical lens,” Opt. Soc. Am. A 23, 2551- 2565 (2006).
Proc. of SPIE Vol. 7791 77910A-7
[7] Y. F. Chao and K. Y. Lee, “Index Profile of Radial Gradient Index Lens Measured by Imaging Ellipsometric
Technique,” Jap. Jour. Appl. Opt. 44, 1111-1114 (2005).
[8] Z. Liu, X. Dong, Q. Chen, C. Yin, Y. Xu, and Y. Zheng, “Nondestructive measurement of an optical fiber
refractive-index profile by a transmitted-light differential interference contact microscope,” Appl. Opt. 43, 1485- 1492 (2004).
[9] M. Ray, S. K. Sarkar, A. Basuray, and N. SoodBiswas, “Measurement of refractive index profile of GRIN glasses,”
SPIE 4417, 483- 488 (2001).
[10] H. C. Hsieh, Y. L. Chen, W. T. Wu, and D. C. Su, “Method for measuring the refractive index distribution of a
GRIN lens with heterodyne interferometry,” Proc. SPIE 7390, 73900G (2009).
[11] B.E.A. Saleh and M.C. Teich, “Fundamentals of Photonics,” Wiley, New York, 702 (1991). [12] K. J. Gasvik, “Optical Metrology,” 3rd ed., John Wiley, 280 (2002).
[13] Q. Dou, H. Ma, G. Jia, Z. Chen, K. Cao, and T. Zhang, “Study on measurement of linear electro-optic coefficient of
a minute irregular octahedron cBN wafer,” Opt. Laser Technol. 39, 647-651 (2007).
[14] M. H. Chiu, J. Y. Lee, and D. C. Su, “Complex refractive-index measurement based on Fresnel’s equations and uses
of heterodyne interferometry”, Appl. Opt. 38, 4047-4052 (1999).
Proc. of SPIE Vol. 7791 77910A-8