國立台灣大學理學院地質科學系 博士論文
Department of Geosciences College of Science National Taiwan University
Doctoral Dissertation
台北都會區山腳活斷層之地震地質研究
Earthquake Geology of the Active Shanchiao Fault in the Taipei Metropolis, Taiwan
陳致同 Chih-Tung Chen
指導教授:盧佳遇 博士 詹瑜璋 博士 Advisors: Chia-Yu Lu, Ph.D.
Yu-Chang Chan, Ph.D.
中華民國 101 年 1 月
January, 2012
i
ii
誌 誌 誌 誌謝 謝 謝 謝
進入台大已接近十年,就讀研究所更已整整六年,能夠走到今日、在這裡思 索從何下筆致謝,皆仰賴師長、同窗、家人,與學校社會環境的栽培、照顧與支 持,實在是萬分幸運。幸好論文裡有這個章節,讓學生能仔細咀嚼這些年來的歷 程軌跡,找出論文成形的背後支柱與動力,在此略表謝忱!
首先要感謝我的導師-盧佳遇老師,這麼多年來無私的教導所學所知,從方 方面面啟發學生,主動提供或為學生爭取機會與各種補助,在此同時給予最大的 空間讓學生學習發展;不論在專業研究上,抑或是工作事務,與人生價值態度,
盧老師都展現了最珍貴的身教與言教。同為導師的詹瑜璋老師在研究學業之路上 不斷的引導學生,長年的循循善誘讓學生能在學術的十里霧中逐步摸索出自己的 路,在一次次的討論中學生獲得的不只是科學上的新視野與觀念糾正,更有做人 處世的歷練與原則。李建成老師是這份論文關鍵的指導老師,從學生在中研院暑 期生的研究初體驗至今,不間斷的指導與討論,尤其是台北盆地相關文章的投稿 過程老師辛勤的教導改正,為學生的成長付出非常多心血。老師辛苦了,真是謝 謝!
除了導師以外我還有許多老師長期指導引領我:鄧屬予老師自大二開啟了我 的地質生涯,學生不論在台北盆地、台灣板岩帶、甚至遠到四川,老師都毫不吝 嗇的將所知所得指導分享給學生,討論中老師所給予的鼓勵與肯定真是學生學海 茫茫中的定心丸;陳于高敬愛的歪老師,感謝您從大二起就一路照看學生,給予 學生眾多的發展學習機會以及諸多關鍵的建議,讓學生能不斷的向前進展;胡植
慶老師自大三一直很看重學生,在meeting 與野外時的討論,課務上的信任,特
別是重要科學資料的分享,讓學生在學術上能跨出第一步(07 年的文章)並持續前 進;賈儀平老師從學生進入地質系以來就很關照學生,不時給予寶貴意見與鼓 勵,口試當天更慷慨借出教室解救了學生!羅清華老師雖然日理萬機卻持續關心 學生,力挺學生拿回院長獎,更在研究與文章上給了非常多關鍵的意見與肯定;
鍾孫霖老師從大學的指導到學生板岩帶的研究討論幫助甚多;黃武良老師是我大 學時的導師,老師的關懷讓學生能平穩發展;江博明老師、劉平妹老師、劉聰桂 老師、魏國彥老師、楊燦堯老師、宋聖榮老師、陳文山老師、鄧茂華老師、洪淑 惠老師、吳逸民老師、沈川洲老師、林立虹老師、徐澔德老師、林忠成老師、郭 本垣老師、李德貴老師、饒瑞鈞老師、林殿順老師、李元希老師、胡賢能老師,
您們在研討會、書報討論、野外、實驗等等的場合機會曾經給予學生建議鼓勵與 指導,在此一並致謝!
感謝口試委員們仔細檢閱學生的論文、排除萬難前來為學生考試提出珍貴的 建議與關鍵的問題。朱傚祖朱爺不知已帶領學生野外教學多少次,學生每有一些 學術上的想法與新結果朱爺總是不厭其煩的聽學生報告然後跟學生熱切討論,對 學生的文章更是幫助甚多;張中白老師也是多年來一直關心學生,不論是台灣還 是四川的工作老師既建議又鼓勵,跟老師談天喝小酒超開心的;李通藝老師多年
iii
前就關心過學生的學業,口試更是提出重要的問題非常感激;林正洪老師在口試 時提出許多問題與建議,以及地震相關的意見很是要緊。謝謝老師們~
自從大三加入盧爺實驗室,同門的師兄弟姊妹實是惠我良多:葉恩肇葉教授 多年來熱忱的討論與建議;張國楨學長與陳柔妃學姐在各項工作特別是西進四川 的引領照顧與資源的慷慨分享;焦中輝學長長年業界經驗分享,和您一同奮鬥真 是榮幸;吳方義旺旺學長(與陳怡吟小啾同學)是我的領門人,讓我順利融入研究 室生活;王芳琳學姐我們長年相互打氣,你要繼續加油;林義凱學長多年指引一 同出任務;大總管王釋賢學長這些年實在是多虧有你,幫了太多忙,不知該如何 言謝;陳麗雯學姐感謝你的諸多幫忙與討論,祝你順利!徐乙君小可愛同學還有 潘昌志阿樹同學,回想當年太麻里看日出飆吉普車切薄片推砂箱,一起打拼還要 謝謝你們對我的包涵;陳建宏與黃欽煌,同窗與共事辛苦你們了;謝謝你們!
在地質系行走多年我仰賴許多系上學長姐、同學與學弟妹的支持、陪伴與鼓 勵。一定要寫在前面的是黃鐘學長,感謝你的幫忙讓我入行,一路至今八年有餘 不管是學業、研究、野外、還是學生生活的方方面面多謝你的帶引與作伴!特別 要感謝的是歪老師大軍中的賴光胤蛋哥,你現在可是我們詹門的老大請您多多指 教;鍾令和阿和感謝你多年來的討論與鼓勵,等著參加你的口試啦;郭昱廷鴉哥、
姜宏偉菇哥、黃韶怡韶子姐、林殷田帥學長、張瀞之學姐、李珀儂學長、林蔭學
長、巫姿萱烏茲,不論是去中橫暑地當助教同時自我鍛鍊、或是去舊金山AGU
出國打天下,感謝你們讓我加入也幫我許多忙。同樣在野外與AGU 幫忙與作伴
的景國恩學長、李政益Sep、莊勻睿 Ray、黃信樺信業哥等等,謝謝!一同書報
討論以及常常一同野外、出任務的老胡實驗室同胞們,何宛芸kukuli、黃孟涵學
長、曾佳漢學長、唐昭榮學長、吳育雅老師、吳秋雅學姐、謝有忠學長、陳致言 學長、楊宜蓉學姐、邱俊穎蚯蚓、李易叡小猛、黃筱婷、邱詠恬、童忻、彭葦、
Maple、冠翔、宣維、宛君、喬茵,謝謝你們的討論、幫忙、支持與作伴,你們 都是最好的夥伴!感謝奎含與鄭小雅在研究最初期時的共同打拼與長期支持,慶
怡一路以來諸多幫忙還有多年來的NASA 月曆,還有我的大學同學們黃琳、聖
元、曉明、洪小四、陳大吟、賢元、吳阿笨,以及語涵Kitty、胖達,感謝有你
們一起努力互相砥礪!楊欣穎火星娘娘、張英如仙女學姊、郭力維學長、周祐民 學長、賴昱銘學長、李曉芬學姐、傅慶洲學長、張佳菱學姐、洪瑋立學長、莊佩 娟學姊、許緯豪學長、施國偉、阿刀、皇伶、韻如、心怡會長、嘉俞、淵淑、乙 嘉、張冕、劭璿、致展…看來沒法齊列,但我們都曾一同野外工作或是深入討論 給我很多啟發,請容我說:謝謝你!
除了台大我也在中研院地球所受到好多照應,羅秋月學姊我真是太感謝你
了,你越來越漂亮可愛小baby 也會很快來報到啦~周素卿學姊如果沒有您的開示
開導大家應該都已經hold 不住崩潰了…虎兒學姊在中研院看著我長大,這一切
都多虧學姊照顧!淑貞感謝你好多的幫忙與關心!王興桂學長跟小紅雖然已經 被油公司挖角去發財,還是要感謝你們許多的幫忙照應~感謝葉致翔學長的好多 討論,學長加油!牟鍾香牟牟學姐也是!以及楊天南學長、張書豪學長、已經高
iv
就中央大學的黃文正學長,與姜彥麟山豬學長~還要感謝李家慶學長在拉曼光譜 儀使用上的協助。我的許多高中與社團同學也在我的這段求學過程給我很多鼓 勵、增廣見聞視野與紓發牢騷,特別是馬丘(子軒)與猴哥(國璨),真是謝謝了。
一路上還有很多台灣以外老師與友人指導與幫助過我,特別是法國蒙波利埃 的Jacques Malavieille, Serge Lallemand 與 Alain Chauvet,在天國的安爺爺 Jacques Angelier,巴黎的 Olivier Beyssac 及 Martine Simoes,在 Grenoble 的 Anne-Marie Boullier,還有我的 Montpellier 朋友們(Marie, Marienne, Maryse, Audrey, Angelique, Christopher, Theo, Clement, Remi, Vincent)。美國則有紐約的吳大銘老師,康州的 Timothy Byrne,賓州的 Donald Fisher,
加州理工的Steven Kidder,印地安納的 Robert Wintsch。大陸四川地礦部的潘桂
棠老師,丁俊所長,王劍副所長,尹福光主任,劉宇平研究員與李建忠研究員。
還有日本的岡本和明(Kazuaki Okamoto),瑞士的 Sean Willett 等人,在此一並致 謝!Thank you! Merci beaucoup!
寫在最後卻是最重要最根本的,感謝我的家庭給了我這麼好的根基讓我能追 求我的夢想,父母給我完整全人的教育以及全力的支持,使我不斷的改進自我,
還有彥文的陪伴。謹獻上最真摯的謝意。
v
摘要
擁有近千萬居民的台北都會區面臨多樣的地震災害潛在來源,包括臺灣島周
圍造山與隱沒系統相關震源,以及都會區內的活斷層「山腳斷層」。山腳斷層為
一東傾之正斷層,斷層線位於台北盆地西緣,其活動主控了台北盆地的生成以及 盆地內四十萬年來七百餘公尺厚河相為主沉積物的堆積。潛在的地震可能造成台 北都會區大規模的災害,特別是沿著地表斷層線附近地帶、斷層上盤位移量較大 地區、以及震央附近地區。為了增進對此活動斷層基本性質的了解,本研究分析 了台北盆地地區的水準資料、地形資料與鑽井資料,並更清楚解析斷層實際所在 位置、斷層的活動情形、斷層帶構造與斷層幾何。近三十年來(1975-2003)的水準 資料顯示,台北盆地的地表垂直變形主要受控於受壓含水層孔隙水壓變化造成的 含水層與阻水層變形;考慮自現地實驗觀察所估計的沉積物壓密速率,以及含水 層孔隙水壓回覆造成的彈性回彈,盆地西緣五股至新莊地區有較高的下陷速率,
指示山腳斷層目前正在潛移。台北盆地西緣山腳斷層帶的數值高程地形模型分析 以及現地實測結果可以追蹤描繪出一系列右階雁行排列的斷層相關地形崖,與斷 層的左移性質有關。為了探討較長時間尺度斷層的活動情形,首先選取了斷層中 段五股地區岩性紀錄與定年資料相當完備三口鑽井的沖積物進行沉積相與年代 的整理分析,對比全球海水面變化曲線,以構造剖面回復方式重建了山腳斷層帶 自末次冰期以來的生長斷層演育。由生長斷層的同構造沉積物堆疊架構顯示山腳 斷層自末次冰期以來持續活動,斷層帶是由一高角度的主斷層以及西側一較低角 度的分支斷層所組成,因斷層含有左移的分量而呈現負花狀構造。兩萬三千年來
主斷層的平均垂直向構造滑移速率約為2 mm/yr 而分支斷層約為 1 mm/yr,而九
千至八千四百年前的六百年區間內我們紀錄到特別高量的構造沉陷(主斷層 7.4
米,分支斷層3.3 米),與前人提出該時段內曾發生古地震的觀察相吻合。在山腳
斷層帶中北段的蘆洲剖面亦觀察到了相似的負花狀構造並且可判釋出多條分支
斷層的存在,斷層上盤末次冰期以來之構造沉陷速率約為3 mm/yr 與五股剖面估
算所得相當接近,顯示如此之負花狀生長斷層是山腳斷層帶的共同特徵。將地表 地形與地下構造對比顯示地形崖多對比至較西側/外側之分支斷層,主斷層的斷 層跡則已被快速的侵蝕與堆積作用完全抹除,因此山腳斷層在地表上的分布並非 一單獨的線形,而是一個可達數百公尺寬的斷層帶。在生長斷層分析中,末次冰 期末期因大漢溪襲奪事件而在台北盆地形成的景美沖積扇礫石層因其形成迅
vi
速、分布廣泛、頂面形貌較規則平整、井下辨認容易,成為同構造生長沉積物中 紀錄與估計山腳斷層長期、綜合同震與間震期完整地震循環的垂直位移相當可靠 的指準層。整合盆地內超過五百口鑽井資料可見此指準層-景美礫石層頂部-已被
山腳斷層明顯強烈變形,並呈現roll-over 的單斜褶皺形態;末次冰期以來斷層最
大位移位於斷層中段的蘆洲至五股地區,並迅速向南減少,向西也快速減少但至 盆地中心後減少速度變緩。斷層造成指準層位移的量值與分布為斷層的幾何形貌 所控制,本研究選取垂直斷層線的五股-三重-台北區域的景美礫石層頂部深度變 化進行模擬,以簡單的彈性半空間邊界元素數值模擬法嘗試解析山腳斷層在上部
地殼的幾何形貌;模擬結果顯示山腳斷層在淺部傾角約75 至 85 度接近垂直,然
而在三至五公里深處急遽轉折至近水平15 至 5 度,呈現強烈的匙狀幾何,指示
山腳斷層在地下三至五公里深處與造山時期的逆衝斷層結合並構造反轉重新滑 動。考量山腳斷層為一可能發震的斷層,而全球至今尚未紀錄到低角度正斷層所 產生的中大型地震,低角度正斷層的發震機制亦缺乏適當的力學解釋,同時進入 台灣造山帶的中國大陸邊緣在造山運動之前發育有許多地塹相關的正斷層為先
存弱面,故此研究在上述幾何組合下又在深部加上一60 度的高角度斷面;模擬
結果顯示若在地下八公里深處斷層面由近水平角度轉折為60 度可獲得較前述相
當甚至更好的擬合結果,隱示山腳斷層可能不僅重新活化了造山時期的逆衝(底 脫)斷層也同時活化了前造山時期正斷層系統。在全球許多後造山伸張環境的地 震研究指出活動斷層斷面傾角急遽轉折處常為中大型地震的孕震發震位置,而 2004 年發生於台北盆地以東四獸山地區的中型地震其震源機制解與上述雙斷坡 斷層幾何模型的深部斷坡相吻合,震源深度接近斷坪-斷坡轉折處,進一步支持 此幾何的可靠性,並對大台北都會區的地震災害、以及台灣北部山脈垮塌轉型伸 張的大地構造運動有重大意義。
vii
Abstract
The Taipei Metropolis, home to some 10 million people, is subject to seismic hazard from not only ground shaking in thick alluvial deposits due to distant faults or sources scattered throughout the Taiwan region, but also active faulting directly underneath. Northern Taiwan including the Taipei region is currently affected by post-orogenic (Plio-Pleistocene arc-continent collision) processes related to backarc extension of the Ryukyu subduction system. The Shanchiao Fault, an active normal fault outcropping along the western boundary of the Taipei Basin and dipping to the east, is investigated here for the areal extent and magnitude of its recent activity.
Based on growth faulting analysis in the Wuku profile in the central portion of the fault, the Shanchiao Fault is found to be incessantly active since about 23 ka with an averaged tectonic subsidence rate about 3 mm/yr. A geologic profile across the north-central portion of the fault zone in the Luzhou area reveals similar main-branch fault half-negative flower structural pattern and slip rates observed in the Wuku profile, a phenomenon we interprete to originate from the geometry of the basin basement and the strong rheological contrast between unconsolidated basin sediments and basement rocks. One key horizon within the growth sediments – the top of the Jingmei Formation which was an alluvial fan formed rapidly when a major drainage reorganization occurred during the Last Glacial Maximum – is noted to serve as the marker of tectonic subsidence since its inception around 23 ka. A determination and compilation of the depths of the Jingmei Formation top horizon from nearly 500 borehole records within the Taipei Basin demonstrates that the hanging-wall of the Shanchiao Fault is deformed in a roll-over fashion with up to three branch faults sub-parallel to the main fault in the several-hundred-meter wide fault zone, and the offset is largest in the Wuku-Luzhou area in the central portion of the fault and decreases toward the southern tip of the fault. Along traces of the branch faults subtle fault-related geomorphic scarps can be mapped which exhibit a right-stepping en-echelon pattern, indicating recent sinistral transtensional faulting. Contemporary tectonic subsidence revealed by leveling data across the Taipei Basin during 1975 to 2003 was concentrated again in the Wuku-Luzhou near-fault hanging-wall area, probably representing an interseismic fault behavior. An attempt to resolve the poorly-known subsurface geometry of the Shanchiao Fault is carried out by simple elastic dislocation modeling of the surface deformation recorded by the Jingmei Formation top horizon compilation, which is representative of the latest Quaternary period as it spans probably more than 10 earthquake cycles. Preliminary results suggest that the Shanchiao Fault possesses shallow listric geometry where the low-dipping part may be inherited from the negative tectonic inversion of former thrusts, while deeper rift-related normal faults is also likely to be reactivated. Such constraints and knowledge are crucial in earthquake hazard evaluation and mitigation in the Taipei Metropolis, and in understanding the kinematics of transtensional tectonics in northern Taiwan.
viii
Contents
口試委員會審定書……….i
誌謝………ii
中文摘要………v
Abstract………vii
Contents………viii
List of figures………...…xii
List of tables……….xv
Chapter 1: Introduction………..1
Chapter 2: Thirty-Year Land Elevation Change from Subsidence to Uplift Following the Termination of Groundwater Pumping and Its Geological Implications in the Metropolitan Taipei Basin, Northern Taiwan………..………..4
2.1 Introduction………4
2.2 Regional Setting……….…7
2.2.1 Geological Background……….7
2.2.2 Hydrogeologic Framework and Utilization of Groundwater…………..10
2.3 Analyses and Results………12
2.3.1 Description of Data Analyses ……….12
2.3.2 Results of Post-Pumping Land Elevation Change………...13
2.4 Mechanics of Land Elevation Changes during Post-Pumping……….17
2.4.1 Near Surface Soil Compaction (the Shallow Component) ……….17
2.4.2 Tectonic Load (the Deep and Crust-Scale Component) ……….20
2.4.3 Deformation of Aquifers (the Intermediate Component) ………...20
2.4.4 Synthesis and Discussion………22
2.5 Summary.………..28
Chapter 3: Growth Normal Faulting at the Western Edge of the Metropolitan Taipei Basin since the Last Glacial Maximum, Northern Taiwan……….….29
3.1 Introduction………..29
3.2 Geological Setting………30
3.3 The Active Shanchiao Fault……….33
3.4 Reconstruction of Geological Profile across the Shanchiao Fault…………..34
3.4.1 Stratigraphic Correlation between the Boreholes………34
3.4.2 Stratigraphic Architecture of the Shanchiao Fault Zone……….44
3.5 Reconstruction of Growth Faulting History……….46
3.5.1 Sea Level Fluctuation and Sedimentation in the Taipei Basin…………46
3.5.2 Restoration by a Simple Back-Stripping Method………48
3.5.3 Evolution of Sedimentation vs. Growth Faulting………51
ix
3.6 Discussion………55
3.6.1 Tectonic Loading Rates and Earthquake Events……….55
3.6.2 Correlation between Surface Topography and Sub-Surface Geology….58 3.7 Concluding Remarks………60
Chapter 4: Fault Zone Characteristics and Basin-wide Distribution of Post-Last Glacial Maximum Tectonic Subsidence of the Active Shanchiao Fault in the Metropolitan Taipei Basin, Northern Taiwan……….61
4.1 Introduction………..61
4.2 Regional Setting………...62
4.2.1 Geology of the Taipei Basin………62
4.2.2 The Active Shanchiao Fault………64
4.3 Fault Zone Geomorphology……….67
4.3.1 North of the Tanshui River (Beitou Area) ………..67
4.3.2 Wuku Area………...71
4.3.3 Hsinchuang-Shulin Area……….75
4.4 Fault Zone Structure……….80
4.4.1 Growth Faulting at the Wuku Profile in the Central Portion of the Fault………....80
4.4.2 Structure and Growth Faulting at the Luzhou Profile in the North-Central Portion of the Fault……….82
4.4.3 Geological Interpretation of the Shulin Profile in the Southern End of the Fault……….………90
4.5 Distribution of Tectonic Subsidence since the Last Glacial Maximum across the Taipei Basin……….…………91
4.5.1 Jingmei Formation Top Horizon as a Key Marker………91
4.5.2 Data and Result………...91
4.5.3 Factors Affecting the Depth Distribution of the Jingmei Formation Top Horizon………93
4.6 Discussions………...96
4.6.1 Delineating the Shanchiao Fault Zone………96
4.6.2 Characteristics of the Fault Zone Structure………...98
4.6.3 Extent of the Magnitude and Rate of Fault-Related Vertical Deformation since the Last Glacial Maximum………..……..101
4.7 Summary………103
Chapter 5: Active Post-Collisional Normal Fault Reactivating Syn-Convergence Thrust Detachment and Involvement of Deep-Seated Pre-Orogen Rift Faults: a Case Study of the Shanchiao Fault in the Taipei Metropolis, Northern Taiwan………..104
x
5.1 Introduction………104
5.2 Regional Setting……….107
5.2.1 The Taiwan Orogen and Post-Collisional Tectonics in Northern Taiwan………..107
5.2.2 The Active Shanchiao Fault………..110
5.3 Reconstruction of Late-Quaternary Post-Last Glacial Maximum Vertical Tectonic Deformation………111
5.3.1 The Jingmei Formation Top Horizon as a Key Marker…………..111
5.3.2 Mapping of Tectonic Subsidence across the Taipei Basin………112
5.4 Half-Space Elastic Dislocation Modeling……….119
5.4.1 Model Setup………..119
5.4.2 Fault Plane Models with Uniform Dip………..121
5.4.3 Fault Plane Models with Listric Geometry………...123
5.5 Discussions……….126
5.5.1 Shallow Crust Fault Geometry and Its Relation with Syn- Convergence Thrust Detachment………...……...126
5.5.2 Deeper Fault Geometry and the Low-Angle-Normal-Fault Enigma….127 5.5.2.1 Global Debate on Seismogenesis on Low Angle Normal Faults………..127
5.5.2.2 Half-Space Elastic Dislocation Modeling of Fault Plane Models with Double-Ramp Geometry………..…………128
5.5.2.3 The Role of Pre-Orogen Rift Normal Faults on Post-Collisional Extension Tectonics………...……….130
5.5.3 Seismic Hazard Implication………..131
5.6 Concluding Remarks………..133
Charpter 6: Conclusions and Future Scope………..134
6.1 Mapping the Shanchiao Fault with Illumination of Fault Zone Structure….134 6.2 Continued and Ongoing Activity of the Shanchiao Fault since 23 ka to Present Constrained by Growth Faulting Study and Leveling Data Analysis………..…134
6.3 Joint Reactivation of Syn-Convergence Thrust and Pre-Orogen rift fault by the Shanchiao Fault during Orogen Wedge Collapse….…………..………..134
6.4 Future scope: unresolved Dilemmas and Some Directions for Further Investigations……….……135
References………..137
Appendices……….148
A1. Note on Chapter 2 (Chen C.-T. et al., 2007, Engineering Geology)……….148 A2. Note on Chapter 3 (Chen C.-T. et al., 2010, Terrestrial, Atmospheric, and
xi
Oceanic Sciences) ………..167 A3. Note on other published manuscript (Chen C.-T. et al., 2011, Terra Nova)..188
xii
List of Figures
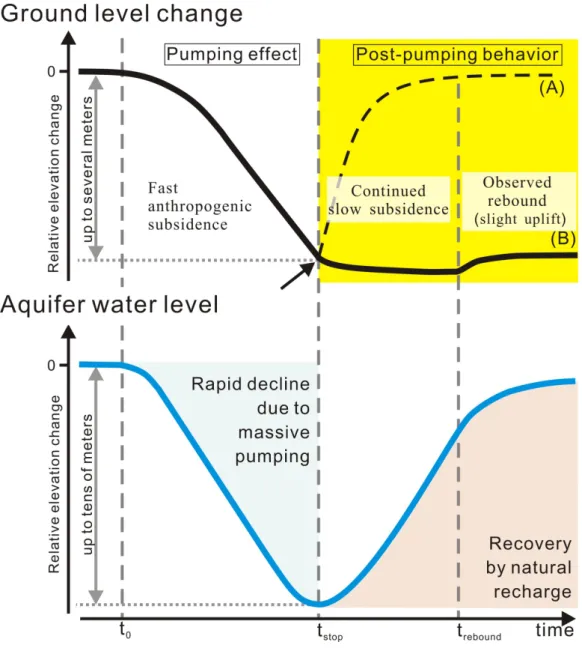
Fig. 2-1. General conceptual model of ground elevation change due to short- and long-term artificial piezometric head drawdown and recovery. ...………...…5 Fig. 2-2. (a) Tectonic framework of Taiwan. (b) Geological outline of the Taipei
area (c) Simplified geological cross section of the Taipei Basin……….9 Fig. 2-3. (a) Cumulated subsidence in the Taipei Basin from 1955 to 1991. (b)
Stratigraphic and aquifer architecture of late Quaternary deposits within the basin. (c) Piezometric head records since 1972 to 2003….…………..………..11 Fig. 2-4. Distribution of the benchmarks analysed in this study.……….13 Fig. 2-5. Contour maps of observed land surface elevation change in Phase 1
(1975-1989) of post-pumping period……….………15 Fig. 2-6. Contour maps of observed land surface elevation change in Phase 2
(1989-2003) of post-pumping period………..16 Fig. 2-7. Evolution of ground elevation change rate in post-pumping period in
Wuku and central Taipei areas from 1975 to 2003……….………17 Fig. 2-8. (a) Isopach of the Holocene clayish sediments (topmost 50-m deposits)
in Taipei basin. (b) Estimated soil compaction rate.……….….19 Fig. 2-9. Mechanisms of three depth-related components responsible for land
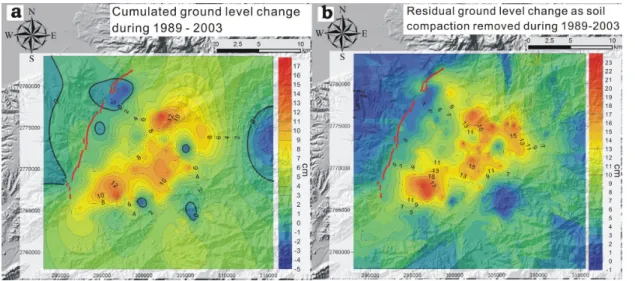
elevation change in Western Taipei (Wuku) and Central Taipei. ...………...23 Fig. 2-10. Ground level changes during Phase 2 of post-pumping period. (a)
Cumulated change. (b) Residual change as soil compaction removed. …………25 Fig. 2-11. A schematic model for evaluating aquifer elastic rebound during the
Phase 2 of the post-pumping period. ………..……...27 Fig. 3-1. (A) General tectonic framework of Taiwan. (B) Simplified geology of
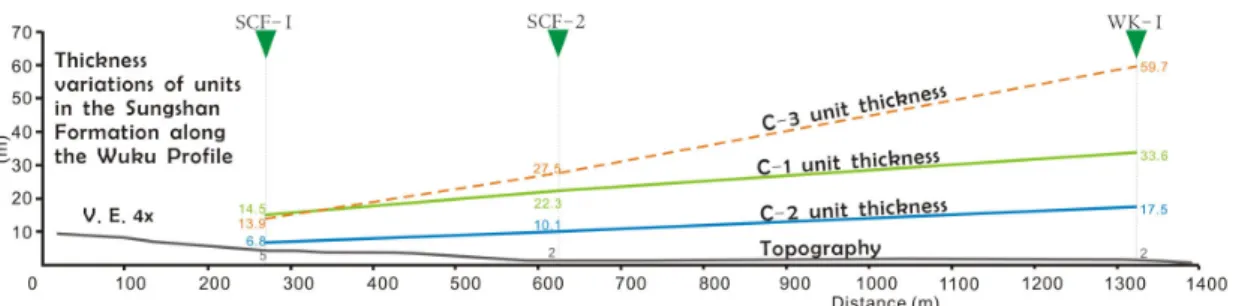
the Taipei area. (C) Geological cross section of the Taipei Basin. ...………..…...31 Fig. 3-2. (A) Map of the Wuku area. (B) Interpreted Wuku geological profile. ….…35 Fig. 3-3. Stratigraphic correlation between boreholes of the Wuku profile. ...……..39 Fig. 3-4. Thickness variations of units in the Sungshan Formation along the Wuku
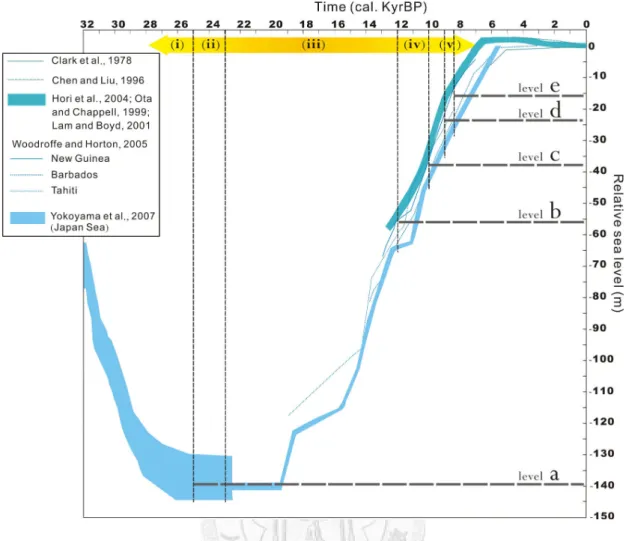
Profile.………45 Fig. 3-5. Eustatic sea level changes since 30 ka. ………...………..47 Fig. 3-6. Back-stripping method and reconstruction of cumulative deformation on
the Shanchiao Fault since the LGM of about 23 ka. …..………..….50 Fig. 3-7. Interpreted sedimentation and growth faulting and post-LGM
development history of the Shanchiao Fault zone in the Wuku profile. ………...54 Fig. 3-8. (A) Sedimentation rate and tectonic subsidence rate of the C1 and C2
units at the Wuku boreholes. (B) Accumulative vertical slips for the Shanchiao fault since the LGM in the Wuku Profile………...………57 Fig. 3-9. Schematic 3-D diagram of the fault zone in the Wuku area, central
xiii
portion of the Shanchiao Fault. ……….………..….59 Fig. 4-1. (A) General tectonic framework of Taiwan. (B) Simplified geology of
the Taipei area. (C) Geological cross section of the Taipei Basin. ……..………..66 Fig. 4-2. Map of the surface trace of the Shanchiao Fault in the Beitou area………..69 Fig. 4-3. Topographic profiles across the Shanchiao fault in the Beitou Area……….70 Fig. 4-4. Map of the surface trace of the Shanchiao Fault in the Wuku area.………..73 Fig. 4-5. Topographic profiles in the Wuku Area……….74 Fig. 4-6. Map of the surface trace of the Shanchiao Fault in the
Hsinchuang-Shulin area. ..……….77 Fig. 4-7. Topographic profiles in the Hsinchuang-Shulin area. …………..…………78 Fig. 4-8. High-resolution topographic measurements in the northern Hsinchuang-
Shulin area……….……….79 Fig. 4-9. (A) Map of the Luzhou area. (B) Interpreted Luzhou geological profile….84 Fig. 4-10. Stratigraphic correlation between boreholes of the Luzhou Profile. ….….85 Fig. 4-11. Depth variations of the Jingmei Formation top horizon and the
deduced tectonic subsidence rates since ~ 23 ka in the Luzhou Profile. …..….…88 Fig. 4-12. (A) Sedimentation rate and tectonic subsidence rate of the C1 and C2
units at the Luzhou boreholes. (B) Accumulative vertical slips for the Shanchiao fault since the LGM in the Luzhou Profile………...…89 Fig. 4-13. Basin-wide compilation of depth distribution of the Jingmei
Formation top horizon………..92 Fig. 4-14. Variations of the Jingmei Formation top horizon depth, and the deduced
tectonic subsidence amount and rate in the Wuku-Sanchung-Taipei profile. ………...94 Fig. 4-15. Variations of the Jingmei Formation top horizon depth, and the
deduced tectonic subsidence rate in the Wuku-Hsinchuang-Banchiao profile. ....95 Fig. 4-16. Updated mapping of the Shanchiao Fault zone………...97 Fig. 4-17. Schematic 3-D diagram of the fault zone in the Wuku-Luzhou area,
central portion of the Shanchiao Fault. ……….………….……….100 Fig. 4-18. Cartoon exhibiting the deformation of the Jingmei Formation top
horizon by the Shanchiao Fault. ………...……….………..102 Fig. 5-1. (a) Tectonic framework of Taiwan. (b) Simplified geology of the Taipei
area. (c) Simplified geological cross section of the Taipei Basin. ……..……...106 Fig. 5-2. Lithostratigraphic log of the Taipei Basin sediments ……….109 Fig. 5-3. Basin-wide compilation of depth distribution of the Jingmei
Formation top horizon………113 Fig. 5-4. Basin-wide varioation of post-LGM tectonic subsidence revealed by the
depth distribution of the Jingmei Formation top horizon………...…114
xiv
Fig. 5-5. Variations of the Jingmei Formation top horizon depth, and the deduced tectonic subsidence amount and rate in the Wuku-Sanchung-Taipei profile. ...115 Fig. 5-6. Settings of the uniform dip and listric models in elastic half-space
dislocation modeling………120 Fig. 5-7. (A) Normalized vertical offset values by the Shanchiao Fault recorded
by the Jingmei Formation top horizon. (B) Modeling outcomes of the uniform dip models. ……….…..122 Fig. 5-8. Modeling outcomes of the listric models………124 Fig. 5-9. Settings of the double-ramp models in elastic half-space dislocation
modeling. ……….…………..………..128 Fig. 5-10. Modeling outcomes of the double-ramp models……..……….129 Fig. 5-11: Interpretation of modeling results on the upper crust geometry of the
Shanchiao Fault. ………..132
xv
List of Tables
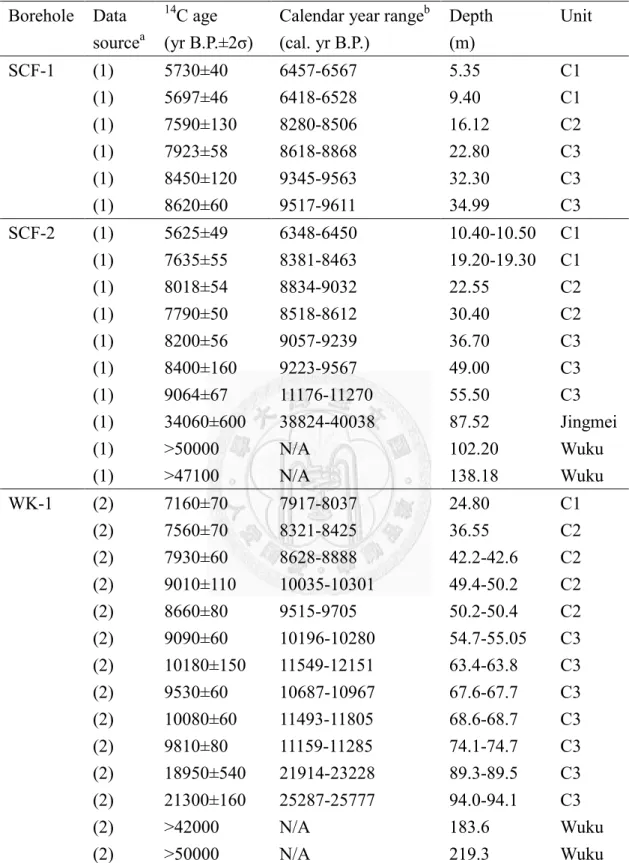
Table 2-1: The in situ compaction in clayey layers of top 50 m basin sediments recorded by Lin et al. (1999). ………..………..20 Table 3-1: Radiocarbon age data of the three boreholes along the Wuku Profile……40 Table 3-2: Thermal luminescence (TL) ages. Data from Lin et al., 1999………41 Table 3-3: Lithofacies of the Wuku Profile………..42 Table 3-4: Sedimentation rate and inferred tectonic subsidence rate of the
Shanchiao Fault zone in the Wuku Profile since ~9 ka. ...……….56 Table 4-1: Radiocarbon age data incorporated in the Luzhou Profile………..86 Table 5-1: Borehole records of Jingmei Formation top horizon in the Wuku-
Sanchung-Taipei profile. ………...………..…………116
1
Chapter1: Introduction
The Taipei Metropolis area, the political and economical capital of Taiwan with several million inhabitants and my hometown as well, situates in a complex geologic environment with numerous imposing geological hazard (Chan et al., 2010). One recognized but poorly understood, yet probably the most devastating kind of hazard is the potential earthquakes generated by the Shanchiao Fault (e.g. Shyu et al., 2005).
Through decades of devoted research this active normal fault is known to govern the development the Taipei Basin and is responsible for accommodating the extension in the northern tip of the island during post-collisional collapse of the Taiwan Orogen (Wang Lee et al., 1978; Teng et al., 2001; Rau et al., 2008). The details and recent activities of the Shanchiao Fault, in contrast, remain elusive owing to the lack of surface outcrops and related seismicity. Series of deep boreholes penetrating the entire basin deposits to reach the basement carried out by the Central Geological Survey shed light on the possible locations of the surface fault trace (Lin, 2001) and allowed ventures to investigate its paleoseismic history (Huang et al., 2007). Despite the efforts mentioned above along with other geodetic (e.g. Yu et al., 1999a), geophysical (e.g. Wang and Sun, 1999) and geochemical (e.g. Walia et al., 2005) inquiries, key parameters of this active fault including the exact location of the surface trace, geomorphic fingerprint of faulting, fault geometry in the near surface to the upper crust, and rate of deformation of contemporary to long-term time scales, went unconstrained or debated, although they bear critical clues to the seismic hazard evaluation and mitigation as well as the understanding of post-orogenic tectonics in northern Taiwan. A multi-discipline approach is therefore presented in this thesis aiming at characterizing the Shanchiao Fault, based mainly upon the extreme wealth of leveling and borehole records across the Taipei Basin thanks to the plentiful previous works and the efforts by the Central Geological Survey in collecting and making public the precious data.
The itinerary of the work generally follows the present-to-past and surface-to-deep tracks in unraveling the properties the fault. Leveling data of past four decades is first examined for signs present-day fault activities, and growth sediment accumulation from borehole correlations yield millennial to late-Quaternary fault vertical offset rates. Fault-related scarps are found to represent only part of the complex fault zone at shallow underground from borehole synthesis, which denotes a half-tulip structure inherited from the transtensional nature of fault movement. Growth faulting analysis revealed an intimate coupling between sea level rise and normal faulting since the Last Glacial Maximum (LGM) in the fault zone along much of the Shanchiao Fault, which permits fault slip rate estimations noted previously and identification of a key
2
tectonic subsidence marker, the Jingmei Formation top horizon. The horizon depth distribution across the basin is converted to estimates of post-LGM vertical fault offset, which demonstrate the extent and magnitude of fault-induced deformation in the Taipei Basin. Finally the tectonic subsidence variation deduced from horizon depth normal to the fault strike is modeled to resolve the upper crustal geometry of the Shanchiao Fault. These results are presented in four chapters; each of the chapters is an independent manuscript published (information listed in the Appendix section) or under preparation for submission. Briefing of these chapters is outlined below:
Chapter 2: Leveling across the Taipei Basin during 1975 to 2003 is analyzed to
illuminate the modern vertical ground motion. Initially intended to elucidate and quantify contemporary tectonic subsidence rate, the subsidence and uplift of basin floor observed during the period was dominated by aquifer deformation as residual compaction caused by preceding severe groundwater pumping and elastic rebound due to pore-pressure recovery in natural recharge. Other than the intermediate depth (about 50 to 100 m deep) aquifer component, shallow soil compaction of the most recent sediments contributed significant subsidence in several areas and an attempt was made to quantify this natural subsidence. After tentative removing of soil compaction and discussion on extent of aquifer elastic rebound, enhanced subsidence was still found along the western margin of the Taipei Basin in the near-fault hanging-wall region, which serves to be a solid proof of ongoing modern fault creep although the exact amount of slip rate is not obtainable.Chapter 3: Basin sediments of three well-documented boreholes (SCF-1, SCF-2 and
WK-1) across the central Shanchiao Fault zone in Wuku area is analyzed in the light of growth faulting. The stacking pattern of sediments in the fault zone is controlled by the sea level change and modified by normal faulting. During the LGM the basin was in an eroding environment until the captured Tahan River laid down a massive alluvial fan across the basin as the Jingmei Formation which capped the entire fault zone. The hanging wall and extensional fault block within the fault zone were subsequently down thrown by the fault, and with the rising sea level growth sediments were first accumulated on the hanging wall and progressively onlapped to the extensional fault block and then the footwall. The latest Sungshan Formation as the sediments covering the Jingmei Formation contains horizons downward-displaced towards east, providing estimations on regional sedimentation rates on the footwall (SCF-1) and additional tectonic subsidence rates on the extensional fault block (SCF-2) and the hanging wall (WK-1) since 8.4 ka to present and 9 to 8.4 ka. From the offset pattern of the horizons in the Sungshan Formation and the top of the Jingmei Formation, the fault located between SCF-1 and 2 is a branch fault while the majority of slip occurred on the main3
fault between SCF-2 and WK-1, together they consist of a half-tulip structure.
Chapter 4: This chapter intends to summarize the available surface and shallow
underground data to give a thorough picture of the Shanchiao Fault zone and the deformation it exerted across the Taipei Basin. Fault zone topographic analysis is first presented delineating series of right-stepping en-echelon vague scarps. In examining fault zone structure a comparable but more detailed half tulip structure is revealed in the Luzhou Profile northwards of the Wuku Profile with similar growth strata stacking fashion, suggesting this kind of fault zone configuration is operating along its entire length and is probably the result of basement geometry and the strong rheological contrast between the basement rock and the loose basin sediments. The Shanchiao Fault is therefore better mapped as a several hundred-meter wide fault zone instead of a single fault line. The Jingmei Formation top horizon in the base of growth sediments deposited during the recent eustatic rise serves to be a clear and widespread tectonic subsidence marker since the LGM ~ 23 ka, and a basin-wide compilation of its depth and the calculated vertical offset demonstrates that the hanging wall is deformed into a prominent roll-over monocline with tectonic subsidence decreases systematically towards the southern tip of the fault.Chapter 5: Deformation in the Shanchiao Fault hanging wall normal to the strike is
most likely to reflect its underground fault plane geometry, which was unknown due to lack of constraints. Based on the Jingmei Formation top horizon offset data compiled in Chapter 4, different geometric configurations are tested against the geological constraints using simple half-space elastic dislocation modeling. Drastic listric geometry at shallow depth is needed to produce the pronounced roll-over folding immediately east of the fault. At further depth a steeper fault patch is likely to take over the extensional detachment inverted from the syn-convergence Hsinchuang Thrust considering the fitting of model outcomes with tectonic subsidence in the eastern half of the basin, the existence of pre-orogen normal fault underneath the fold-thrust pile, the few but well-resolved steep-dipping normal faulting focal mechanisms, and the debated seismogenic ability of extensional detachment. The Shanchiao Fault is hereby proposed to possess a ramp-flat-ramp (double-ramp) geometry reactivating both syn-convergence thrust and pre-orogen rift normal fault, and the seismic hazard this geometry may imply is discussed.4
Chapter 2: Thirty-year land elevation change from subsidence to uplift following the termination of groundwater pumping and its geological implications in the Metropolitan Taipei Basin, Northern Taiwan
2.1 Introduction
Excessive groundwater utilization in agricultural and urban area is known to cause rapid human-induced land subsidence and pose severe problems including damage to building and infrastructures, exhaustion of groundwater resources, increase of risks of inundation, and inland sea water intrusion, as documented in many places around the world (e.g. Bangkok, Thailand, Phien-wej et al., 2006; Jakarta, Indonesia, Abidin et al., 2001; Ravenna, Italy, Teatini et al., 2005; Pingtung Plain, Taiwan, Hu et al., 2006).
Pumping-induced subsidence is resulted primarily from irreversible compaction of aquitard material composed of fine-grained silt and clay layers during prolonged drainage process, and from minor amount of presumably elastic compaction from compression of coarse-grained conglomerate and sand deposits in aquifers (Holzer, 1984; Waltham, 2002). Ground surface change due to pumping generally reflects the response to dropping piezometric level (Fig. 2-1). Ban or controls on pumping are the actions usually taken by many authorities to mitigate the hazards, and regional groundwater table rises accordingly due to natural groundwater recharge. Ground elevation change during groundwater recovery after long-term extensive pumping should exhibit some amount of uplift. This effect is considered to be originated from relaxation of elastically compressed aquifer materials when pore-pressure regained, as illustrated by injection experiment carried out at the severely subsided Wilmington oilfield in the Long Beach harbour area of California (Allen and Mayuga, 1969), a phenomenon commonly referred as elastic rebound (Waltham, 2002).
Characterization of such post-pumping behaviour, however, has not yet been studied in detail.
Typical ground response during fast artificial recharge for short-period pumping tests (e.g. Cappa et al., 2005) is well known as curve A in Fig. 2-1, indicating immediate and direct coupling of changes between ground elevation and hydraulic head. On the other hand, ground surface variations following cessation of prolonged groundwater pumping are mainly characterized by a transition of minor movements from subsidence to uplift (curve B in Fig. 2-1), as reported in Venice, Italy (e.g., Gatto
5
and Carbognin, 1981). It demonstrates a more complicated scheme when groundwater production is of greater spatial and temporal scales. Characteristics and mechanisms of regional land elevation change, particularly the elastic rebound after experiencing basin-wide groundwater over-extraction, remain unclear. The history of pumping and recovery of the groundwater in the Taipei basin in northern Taiwan, therefore, provides a good opportunity for better understanding of this post-pumping mechanism.
Fig. 2-1. General conceptual model of ground elevation change due to artificial piezometric head drawdown and recovery. Note that two different post-pumping behaviours of ground level change: (a) short-term pumping test and (b) long-term artificial pumping. See text for details.
6
The Taipei City is the political and economical centre of Taiwan (Fig. 2-2a) with dense population of about 3 million habitation and another several million inhabitants in the surrounding suburban areas. Like many big cities in the world, early development of the Taipei city was partly facilitated by its rich groundwater resources.
However, unrestriction of groundwater over-pumping resulted in both dry-ups of wells and severe land subsidence, especially during 1955 – 1970 (Hwang and Wu, 1969; Wu, 1987). In order to prevent more ground subsidence and further associated damage, the government put a stop on the use of groundwater in the Taipei Basin during the early 1970s. Rapid land subsidence has therefore significantly decreased (Wu, 1987), and the groundwater table was gradually recovered and became approximately stable since late 90s (Chia et al., 1999; Fig. 2-3c). In this paper, we intend to examine recent vertical change of ground surface in response to the post-pumping ground water recharge in more details. Thanks to several annually measured levelling routes across the Taipei Basin, we are able to reconstruct the history of the land vertical change following the recharge of the aquifers.
Furthermore, while severe anthropogenic land subsidence has been stopped in the Taipei metropolitan area, concerns on potential earthquakes and related geohazards due to possible reactivation of the active Shanchiao fault continue to be discussed (e.g., Teng et al., 2001; Shyu et al., 2005; Huang et al., 2007). Taiwan is situated in a plate boundary between the actively converging Eurasian and Philippine Sea plates beginning about 5 Ma (Suppe, 1981; Teng, 1990). At present, the collision process is manifested in southern and central Taiwan as demonstrated by the intense crustal shortening, according to data from the GPS and seismic networks of Taiwan. In contrast, north-eastern Taiwan underwent post-collisional processes and has been considered to be incorporated in the opening of the southern Ryukyu back-arc system (Teng et al., 2000a), as evidenced by the presence of Quaternary extensional structures (Lee and Wang, 1988; Lu et al. 1995) and extensional earthquake focal mechanisms (Yeh et al., 1991; Kao et al., 1998). The Shanchiao Fault, which bounds the western edge of the Taipei Basin, has attracted attention in terms of earthquake hazards during the last decades. Tectonic subsidence related to this possible active fault is illuminated through recent levelling data, and should have an influence on the land elevation change in the Taipei Basin especially in the western part.
Levelling data in the Taipei area from 1975 to 2003 postdating the massive groundwater exploitation is utilized in the present study to examine the general conceptual model relating ground level response to recharge of aquifers. The various depth-related processes responsible for the observed occurrences of subsidence and uplift are discussed, including shallow soil compaction, crustal-scale tectonic
7
movement, and irreversible compaction and elastic rebound within aquifer. A schematic model explaining recent 30 years land elevation change in the Taipei Basin is proposed.
2.2 Regional setting
2.2.1 Geological background
The Taipei region can be divided into four geological domains (Fig. 2-2b): (1) the Foothills, hilly terrains north, east, and south of the Taipei Basin, consisting of fold-and-thrust belt of Miocene continental margin sedimentary packages; (2) the Tatun and Kuanyinshan volcanoes, north and northwest of the Taipei Basin, piled up of late Quaternary andesitic volcanic formations; (3) the Linkou Tableland, west of the Taipei Basin, covered by Quaternary thick lateritic conglomerates as an ancient fan-delta which rests above Miocene/Pliocene sedimentary rocks (Chen and Teng, 1990); (4) the Taipei Basin, a triangular-shaped half-graben filled with late-Quaternary fluvial deposits since about 0.4 Ma (Wei et al., 1998; Teng et al., 2001), which lie uncomformably over the deformed Miocene sedimentary packages.
The late-Quaternary deposits of the Taipei basin form an asymmetric wedge shape in thickness: reaching a maximum depth of about 700 m in the western margin and gradually becoming thinner toward the east and south (Fig. 2-2c). These unconsolidated deposits in the Taipei basin are divided into four lithostratigraphic units (Teng et al., 1999), from bottom to top (Fig. 2-3b): (1) the lowest Banchiao formation, consisting of fluvial sand, mud and conglomerates, with minor pyroclastic debris and thick varved mud in the upper section; (2) the Wuku formation, consisting of fluvial sand and conglomerates with minor mud and lateritic conglomerates; (3) the Jingmei formation, comprising of lateritic alluvial-fan conglomerates; (4) the Sungshan formation, composed of estuary interbedded sand-mud deposits. The basin deposits are marked by prominent facies changes and most of the sedimentary layers laterally pinch out rapidly. However, the widespread lateritic gravel of the Jingmei formation and the varved layers in upper Banchiao formation serve as basin-wide marker beds (Teng et al., 1999).
Brief geological evolution of the Taipei Basin is summarized in the following, based on previous studies. In Pliocene, the Taiwan Orogeny has initiated as the Luzon Arc of the Philippine Sea plate approaching to continental margin of Eurasia (e.g.
Suppe, 1981). The Miocene shallow marine sedimentary rocks of the Taipei area were deformed into imbricated fold and thrust sheets with several major faults including the Hsinchuang, Kanjiao, and Taipei Faults (Fig. 2-2b, c) as mountainous ranges (Ho, 1975; Wang-Lee et al., 1978). While the orogeny reached climax in northern Taiwan about 2 Ma, the Paleo-Tanshui River, the major river in the Taipei Basin, produced the
8
Linkou fan-delta around the ancient mountain front thrust (Chen and Teng, 1990), the Hsinchuang Fault which runs approximately parallel to the western margin of the Taipei basin (Teng et al., 2001). The compressive stress regime of the northernmost Taiwan appeared to cease during the middle to late Quaternary (Lee and Wang, 1988).
The eruption of the Tatun volcanism to the north of the Taipei Basin might reflect the onset of regional extension which was interpreted to be related to the Okinawa trough back-arc opening and/or lateral extraction in the corner of plate convergence (Lee and Wang, 1988; Lu et al., 1995; Hu et al., 2002). Subsidence along western margin of the Taipei basin is interpreted to result from the repeated normal faulting on the Shanchiao Fault as tectonic inversion on the Hsinchuang thrust fault (Chiu, 1968;
Hsieh et al., 1992). It turned the Taipei area from rugged mountains into a sediment-receiving basin. The accumulation of fluvial and lacustrine sediments was estimated to be started at about 0.4 Ma (Wei et al., 1998; Teng et al., 2001). Since then the Taipei Basin has kept expanding due to continual asymmetric subsidence along the Shanchiao fault in the western edge of the basin (Wang-Lee et al., 1978). Under the combining influences of sea level fluctuations, volcanic activities, drainage system changes, and tectonic processes, the basin was filled with various types of sediments, including alluvial, lacustrine, marine and pyroclastic deposits, as mentioned above.
As a consequence, the Shanchiao Fault, which separates the Linkou Tableland from the Taipei Basin, is considered the major active structure responsible for accommodating the extension across the Taipei region and thus for the formation of the half-graben Taipei Basin (Teng et al., 2001). Shallow seismic reflections across the Shanchiao Fault imaged an offset of Holocene sediments at shallow tens of meters depth (Wang and Sun, 1999). GPS surveys of the Taipei area showed extension with a rate of 0.08 ± 0.02 µstrain/yr in the direction of SEE - NWW across the fault (Yu et al., 1999a). Huang et al. (2007) correlated stratigraphy of three sets of boreholes across the Shanchiao Fault, and identified three paleoseismic events within the Holocene time (8400-8600, 9000-9300, and 11100 years b.p.). Geomorphology analysis also exhibits series of scarps closely related to the development of the Shanchiao Fault (Chen et al., 2006). Thus the Shanchiao Fault is considered active (as stated in reports of Central Geological Survey, Chang et al., 1998 and Lin et al., 2000).
9
Fig. 2-2. (a) Tectonic framework of Taiwan. The converging rate and direction of Philippine Sea Plate relative to Eurasia plate is adapted from Yu et al. (1999b) and Zang et al. (2002). (b) Four geological domains of Taipei area (see text for details).
The thin grey lines within the Taipei Basin are the basement depth contour of 100 m interval (after Teng et al., 2001). The red line along the western margin of the Taipei Basin is the Shanchiao Fault (after Chen et al., 2006). The black dots mark local district names in the Taipei Basin: 1. Guandu, 2. Wuku, 3. Shulin, 4.
Zhonghe, 5. Jingmei, 6. Sungshan, 7. Dazhi, 8. central Taipei, 9. Banchiao. (c) Simplified geological cross section of the Taipei Basin (modified from Teng et al., 1999). The Hsinchuang, Kanjiao, and Taipei Faults are inactive thrust faults (denoted with grey arrows) which slipped during the collision phase in the Taipei area.
10
2.2.2 Hydrogeologic framework and utilization of groundwater
Four major aquifers, which generally correspond to the stratigraphic formations, have been defined in the late-Quaternary sediments of the Taipei Basin (Fig. 2-3b; Wu, 1987). The topmost free aquifer (Aquifer 0), which extends from ground surface to depth around 50 m (except in the western edge of the basin being deeper to about 120 m in maximum), is composed of interbedded clay, sand and pebbles. Aquifer 0 is thus considered to correspond to the Sungshan formation. The confined Aquifer 1 sits at depth between 50 to around 100 m (again except in the western edge of basin, about 115-140 m) in the conglomerate layer covered by laterite. This conglomerate layer is interpreted to correspond to the Jingmei formation, with hydraulic diffusivity around 0.12 to 0.18 m2/s and storage coefficient ranging from 0.001 to 0.004 (Chia et al., 1999). The lower aquifers (Aquifer 2, 3) are present approximately 100 to 130 m and 140 to 160 m underground (depths for the central portion of the basin), as two layers of conglomerates within the Wuku and Banchiao formations, respectively (Fig. 2-3b).
Among them Aquifer 1 appeared to be the major groundwater source of the pumping wells in the Taipei Basin. The groundwater of the lower three aquifers comes mainly from two of the major rivers in the Taipei basin, the Xindian River and the Dahan River (Fig. 2-3a). On the other hand, rainfall is the major water source for Aquifer 0 (Chia et al., 1999).
First massive utilization of groundwater source in the Taipei Basin (primarily Aquifer 1) was initiated by an English engineer W. K. Bardon in 1895. Under his advisory the government set up 150 wells (Wu, 1987). Since then the number of wells was rapidly increasing and the groundwater resource drained twice in 1906 and 1960 to early 1970s. The second event was accompanied by severe land subsidence.
Piezometric head of Aquifer 1 decreased more than 40 m and reached the lowest point around 1975 (Wu, 1987; Chia et al., 1999; Fig. 2-3c). The basin-wide subsidence resulted from over-pumping was particularly concentrated in the central portion of the Taipei Basin where maximum land subsidence exceeded 2 m (Fig. 2-3a), corresponding to the site of major pumping at that time. Severe restriction taken by the government on groundwater pumping in the early 1970s had successfully stopped the fast decline of groundwater table which immediately began to rise as the piezometric head having gradually recovered 30-40 m in 30 years (Chia et al., 1999;
Cho, 2006; Fig. 2-3c). Water resource of the Taipei metropolitan since the 1970s has been supplied by surface water mainly from two reservoirs in upstream Dahan and Xindian Rivers.
11
Fig. 2-3. (a) Cumulated subsidence in the Taipei Basin from 1955 to 1991 (after Lin et al., 1999). Contour interval is 0.25 m. Borehole sites: A: Wuku (WK-1), B:
Sanchung (SC-1), C: Banchiao (PC-2), D: Shingongyuan (Shingongyuan No.1).
Groundwater monitoring wells: i: Wuku, ii: Sanchung, iii: Shingtien Palace, iv:
Sungshan. (b) Stratigraphic architecture of late Quaternary deposits within the basin, along with the four aquifers (modified from Teng et al., 1999). (c) Piezometric head records of Aquifer 1 at four monitoring wells since 1972 to 2003 (Chia et al., 1999; Cho, 2006).
12
2.3 Analyses and results
2.3.1 Description of data analyses
For the purpose of monitoring the land subsidence due to groundwater pumping, several levelling routes were established by government authorities since 1948 in the Taipei basin. More than 406 benchmarks were constructed in different periods of the levelling (Fig. 2-4). Most of the benchmarks were installed on concrete foundation or rock basement. In this study, we analysed the levelling data from 1975 to 2003, in order to decipher effects of post-pumping. Only benchmarks with repeated measurements were taken into account. The observed elevations from these surveys were orthometrically corrected. The more recent data (since 1989) were additionally corrected for temperature variations for rod and instrumental biases. The levelling was deployed conventionally by closing a series of double-run sections. These data sets called TWVD2001 (TaiWan Vertical Datum, the reference of absolute elevation of benchmarks, calculated from the tide data of Keelung tide station) are stored in archive centre of the Ministry of the Interior and Land Subsidence Prevention and Reclamation Corp of National Chengkung University. The survey adopted the standard procedures of the first order high precision levelling, which is of a standard error of about 2√D mm, where D is the distance of measurement (unit of km). As a result, the uncertainties of the elevations for each benchmark during surveys are usually within 1-3 mm.
For the sake of discontinuity of measurements, we divided the data into 7 periods from 1975 to 2003 (1975-1980, 1980-1985, 1985-1989, 1989-1994, 1994-1996, 1996-2000, and 2000-2003). For each period, the elevation changes of the benchmarks are transferred to elevation change rates, in order for comparison. Based on the rates of elevation change for each benchmark, we then construct contour map of land change for each period (1975-1989 for Fig. 2-5 and 1989-2003 for Fig. 2-6), adopting the commonly used extrapolation technique of kriging (Olivier and Webster, 1990). For each period, the contours were derived from data of more than 76 benchmarks. Note that ground level fluctuation shown outside the basin plain is mostly a result of extrapolation which may contain large errors and should not be taken into account.
13
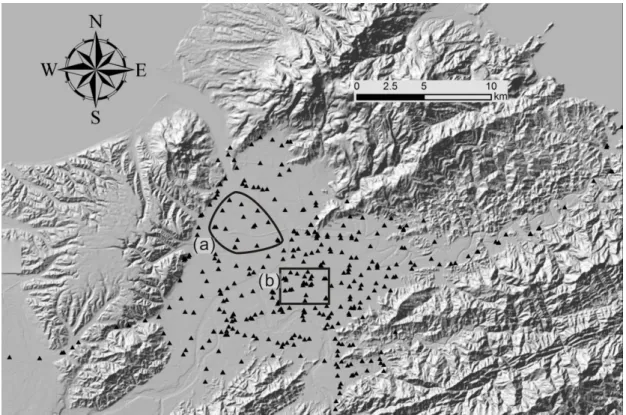
Fig. 2-4. Distribution of the 406 benchmarks of levelling routes analysed in this study.
Benchmarks in groups (a) and (b) are used to represent the average movements in western Taipei Basin and Central Taipei, respectively.
2.3.2 Results of post-pumping land elevation change
Several interesting and important characteristics of the land surface level change (subsidence and uplift) in the Taipei Basin during the post-pumping time can be inferred from the contour maps. First, the whole basin still subsided after the stop of groundwater pumping, but with a decreasing trend from 40-70 mm/yr to 0-30 mm/yr , during 1975 to 1989, denoted here as Phase 1 (Fig. 2-5). Second, a large part of the land became to uplift since 1989, denoted as Phase 2 (Fig. 2-6). However, the surface elevation change was far from homogeneous. For instance, enhanced and persistent subsidence occurred in north-western margin of the basin near Guandu (for the place names mentioned, please refer to Fig. 2-2b) throughout the entire time span (1975-2003), and concentrated subsidence in western margin of the basin (Wuku, Shulin) and north-eastern basin (Dazhi-Sungshan) was also very persistent before 1996. Other locus of subsidence (e.g., Banchiao, Zhonghe, Jingmei) as well as irregular and short-lived subsidence or uplift were also observed.
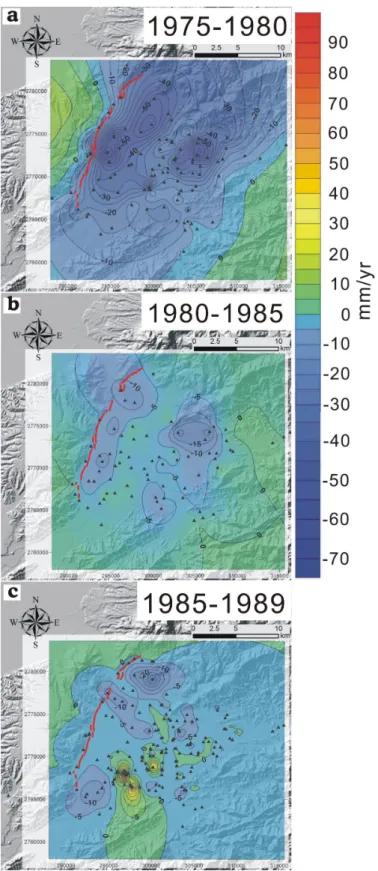
A period-by-period account of land elevation change in the Taipei Basin is presented as followed. Basin-wide decreasing subsidence characterized all three periods in Phase 1. During 1975-1980 (Fig. 2-5a; 94 benchmark), subsidence was dominant and was mostly concentrated in the northwestern (Guandu, exceeded 60 mm/yr; and Wuku, maximum 75 mm/yr) and northeastern portions (Dazhi, nearly 70
14
mm/yr). In 1980-1985 (Fig. 2-5b; 76 benchmark), significant subsidence continuously occurred along the western margin of the basin (Guandu, reached 12 mm/yr; Wuku, over 10 mm/yr) and in the northeastern corner (Dazhi, more than 20 mm/yr), however, with smaller rates compared to the previous period. For 1985-1989 (Fig. 2-5c; 157 benchmark), a large part of areas in the basin were continuous to subside (in particular, the western margin), but some small areas began to show slight uplifting, especially in the central and southern parts, although some of the benchmark records showing extremely sharp uplift might be anomalies. In general, the subsidence rate continued to decrease, comparing to the two previous periods; nonetheless, localized subsidence was still persistent along the western margin of the basin (Guandu, attained 30 mm/yr;
northern Wuku, >10 mm/yr; Shulin, 10 mm/yr) and other patches in the basin (south Dazhi, maximum 15 mm/yr; and Jingmei, around 5 mm/yr).
Starting from about 1989 (Phase 2), uplift began to appear significantly in the Taipei basin and declined in magnitude in the later half of this Phase. During 1989 to 1994 (Fig. 2-6a; 111 benchmark), we observed that the surface subsidence almost ceased and a large portion of the Taipei Basin began to slight uplift, especially in the centre of the basin (central Taipei, 10 to 15 mm/yr; Banchiao, 10 to 15 mm/yr).
Nevertheless, slight subsidence still persisted in western margin of the basin (e.g., 0 to 5 mm/yr in Guandu and Wuku). In 1994-1996 (Fig. 2-6b; 146 benchmark), slight subsidence continuously occurred and was localized in western side of the basin (Guandu, as high as 14 mm/yr; Wuku, maximum 10 mm/yr; and Shulin to Banchiao, up to 6 mm/yr), and in southern Taipei (Zhonghe, reached 10 mm/yr). On the other hand, uplift seemed to begin to dominate the eastern half of the basin, but with a lesser magnitude. In 1996-2000 (Fig. 2-6c; 103 benchmark), the whole Taipei Basin was generally experiencing mild uplift, except for north-western margin of the basin (Guandu – Wuku, subsidence with a possible bull-eye reaching maximum over 20 mm/yr), and other local areas (Dazhi, Zhonghe, and Jingmei). During the most recent period, 2000-2003 (Fig. 2-6d; 94 benchmark), slight uplift prevailed in the Taipei Basin (0-5 mm/yr) with subsidence in north-western basin (Guandu, Wuku, 0 to 5 mm/yr), and other local areas along the southern and eastern edge of the basin (Sungshan, Zhonghe and Jingmei).
In summary, the subsidence rate for the Taipei Basin as a whole generally decreased from 1975 to 1989 (Phase 1), and then the elevation change of the basin gradually switched to slight uplift since about 1989 during Phase 2 (Fig. 2-7). The waning subsidence during the 1975-1989 of Phase 1 is interpreted to be mainly ascribed to the compaction of the water-depleted aquifers, resulting from the residual effect of the rapidly declined piezometric head due to over-pumping of groundwater.
15
Fig. 2-5. Contour maps of observed land surface elevation change in Phase 1 (1975-1989) of post-pumping period. (a) 1975-1980. (b) 1980-1985. (c) 1985-1989. Negative rate values indicate subsidence, and vice versa. Contour interval is 5 mm/yr. Coordinates shown are of TWD 67 Transverse Mercator system. The whole basin revealed a general subsidence from 1975-1985, with some localized effects. See detailed discussion in text.
16
Fig. 2-6. Contour maps of observed land surface elevation change in Phase 2 (1989-2003) of post-pumping period. (a) 1989-1994. (b) 1994-1996. (c) 1996-2000. (d) 2000-2003. Annotations see Fig. 2-5. The basin showed a general uplift from 1989 to 2003; however, local subsidence occurred at several places.
See details in text.
While massive pumping was ceased, recharge of groundwater from two major rivers (Xindian and Dahan Rivers) to the aquifers has raised the water table for more than 30 m from the 1970s to 2003 (Fig. 2-3c). We anticipate that the recovery of the groundwater level would produce an elastic rebound for the aquifers, thus caused basin uplift since 1989 in Phase 2. However, the concentrated and rather persistent subsidence and the reduced uplift occurred along the western margin and northern part of the Taipei Basin, compared to the central part of the basin, suggesting under impacts of other factors.
17
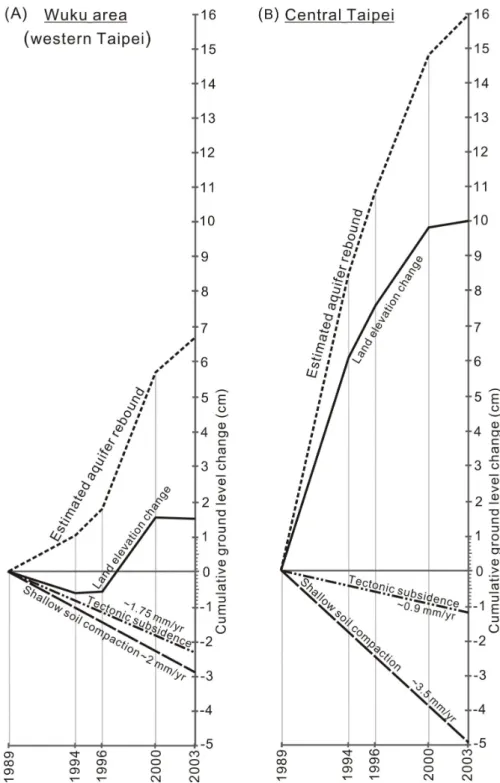
Fig. 2-7. Evolution of ground elevation change rate in post-pumping period from 1975 to 2003. (a) Western Taipei as the Wuku area. (b) Central Taipei. Distribution of the benchmarks used for calculation is shown on Fig. 2-4.
2.4 Mechanisms of land elevation changes during post-pumping
The land elevation change of the Taipei basin could be a product of complexly interfering natural and artificial processes. The heterogeneous pattern of land vertical changes in the Taipei Basin certainly reflects the spatial and temporal context of different agents. In the spatial domain, these agents, according to where the processes take place, can be described and classified by their operation depth. Here we propose main mechanisms to explain the land elevation changes in the Taipei Basin, attributing effects of land elevation change of the Taipei basin to three major components: (1) surface soil compaction (the shallow component), (2) deformation of aquifers, including compaction and elastic rebound due to groundwater effect (the intermediate component), and (3) tectonic load (the deep and crustal-scale component).
2.4.1 Near surface soil compaction (the shallow component)
Local enhanced subsidence can be observed in several areas within the Taipei Basin in many periods we analysed. Subsidence caused by construction (loads of new
18
buildings) cannot be omitted, but such phenomenon might be extremely localized and short-lived. Otherwise, subsidence in several places, such as Dazhi, Sungshan, Jingmei, Banchiao and Shulin, occurred throughout many periods although not always present (Figs. 5 and 6). Since their close proximity to the three major river channels in the Taipei basin (i.e., Keelung, Dahan and Xindian Rivers), we intend to interpret that a large part of subsidence in these areas to be contributed by compaction of recent flood or overbank deposits (especially mud). Effect of in situ sediment compaction, often referred as natural subsidence (Waltham, 2002), therefore must be evaluated in order to further distinguish the role and intensity of natural and artificial factors played on the observed ground level change.
According to a recent in situ study in the Taipei Basin conducted by Lin et al.
(1999), compaction of the loose sediments occurred mainly in the clayey layers of the uppermost 50 m Holocene deposits (generally corresponding to the Sungshan Formation) in three monitored wells in the western part of the basin at Wuku and Banchiao, in a time span of three and a half years from March, 1994 to September, 1997. For older sediments underneath, the compaction and consolidation were observed to be rather slow and was ignorable regardless of the types of the deposits.
Based on their results, we estimated the averaged annual rate of compaction for 1-meter-thick clayey layers to be ranging from 0.14 to 0.28 mm/yr (Table 1) by dividing the cumulative compaction of the clay sections in the monitored wells by the monitoring interval of three and half years. Meanwhile we reconstructed an isopach map for clay thickness within the topmost deposits of the Sungshan Formation in the basin (Fig. 2-8a) based on 350 borehole records from Central Geological Survey (open source, available on http://210.69.81.69/geo/frame/gsb88.cfm). The proxy of present variation of shallow soil compaction rate in the Taipei Basin can be obtained by multiplying the deduced average annual compaction rate for 1-meter-thick clay (i.e., 0.2 ± 0.07mm/yr) with the shallow clay thickness isopach. We estimate contemporary shallow soil compaction to contribute 1-8 mm/yr of subsidence in the basin with most land ranging 2 to 5 mm/yr (Fig. 2-8b).
Natural subsidence rates of surface soil documented elsewhere in similar flood plain and deltaic environments fall in the same order of magnitude (Jelgersma, 1996), such as Ravenna (4-6 mm/yr, Teatini et al., 2005), Romagna (0-5 mm/yr, Gambolati et al., 1999), Venice (0.5-1.3 mm/yr, Gatto and Carbognin, 1981), and Po River Delta (3-5 mm/yr, Gambolati and Teatini, 1998) in Italy and coastal Louisiana, USA (shallow component 1.5-2.5 mm/yr, Dokka, 2006). In addition, the modelling results of Meckel et al. (2006) based on Holocene stratigraphy of lower Mississippi River Delta in southern Louisiana, which closely resembles the compacting shallow