國立臺灣大學工學院暨醫學院醫學工程學研究所 碩士論文
Graduate Institute of Biomedical Engineering College of Medicine & Engineering
National Taiwan University Master Thesis
ToeOFF
®踝足矯具在改善腦中風病患歩態上之果效
The effectiveness of the ToeOFF
®AFO in hemiplegic gait for CVA patients with flaccid ankle paralysis
吳佩育 Wu Pei-Yu
指導教授:章良渭 博士 Advisor: Chang Liang-Wey, Ph.D.
中華民國 98 年 7 月
July, 2009
致謝
“漫長的碩士班之路"終於可以畫下句點了!
能夠接觸到復建工程裡的P&O 這個領域,讓我學習到很多臨床知識跟技術,
也讓我確立了自己的理想:為身心障礙者及弱勢族群盡一份心力!雖然,這四年 來我失去了青春,也捨棄了一些歡樂,但是我總算是完成這件事了。心裡有說不
完的感慨跟感謝,首先我要感謝章良渭老師,是老師對P&O 義無反顧的投入,才
讓我有機會追隨這個服務人群的腳步,未來若能有所作為,皆是由此而生;研究 工作能夠完成,最要感謝陳鴻彬學長的幫助,學長不只陪著我南徵北討的作實驗
(也謝謝奔馳了無數公里的 SOLIO),給予我研究內容最精闢最實質的協助,也給
了我很大的支持跟力量,學長的支持跟關心,是實驗室裡不可或缺的動力;還要
謝謝亦師亦友的 Janet,對於矯具的製作跟募集病人,給了我很多幫助;謝謝謨捷
在我最需要人手的時候,二話不說的犧牲自己的時間跟我到花蓮去作實驗,我的 研究生生活也因為有你的加入而精采快樂;謝謝實驗室所有的夥伴,可愛的學弟 妹們總是帶給我很多歡笑,跟大家的相處真的很快樂,很”Funny”!也謝謝神秘詭
譎謎一般的OPTOTRAK 系統,抓不準的當機時間練就我一身的好膽量!
研究計畫的順利進行,還要感謝彰化基督教醫院的魏大森醫師,劉鵬達先生;
花蓮基督教門諾醫院的楊緒南醫師,蔣博文醫師,李雅芳醫師,吳健銘組長,燕 怡以及幫助過我的每一位開朗的治療師們;而在研究所期間,麻煩最多的應該是 台大輔研中心的淑瑛姐,蘭萍姐,士哲哥了,謝謝您們對於行政事務處理上的幫 助。在此也以最感恩的心謝謝每一位參與過這個研究的受試者,誠摯的祝福您們 平安健康。
放在最後要感謝的,是我所有感激中份量最重的,我的家人。爸爸、媽媽、
哥哥、小瑩,你們的存在是我最大的力量,謝謝你們一路以來默默的支持跟關心,
你們最常跟我說的一句話就是:什麼時候畢業?雖然聽了耳朵很刺,但我心裡很 暖,因為我時時刻刻都感受得到你們對我的愛跟關懷,感謝您們!
摘要
背景及目的:現今腦中風患者術後之復健工作,常常使用各種不同的功能性「踝
足矯具」(Ankle-Foot Orthosis, AFO)作為步態訓練及功能維持的工具,目前已有
許多研究指出這類的矯具對於控制病人踝足部擺位(alignment)以及改善步態功能 方面有很大的幫助;一般來說,大部份有踝足部問題的中風病人會得到醫師處方 以客製化固定踝關節式踝足矯具(solid ankle AFO, SAFO);而近來則有一種半成 品類型的踝足矯具,ToeOFF AFO,可供病人做選擇。除了製造的材料有很大的 不同之外,它所具有的裁切線形式(trimline)和 SAFO 也有很大的差異。因此,
本研究假設ToeOFF AFO 的特殊裁切線,可能較 SAFO 提供了更好的運動空間及
功能,進而幫助中風病人的行走步態;故本研究將針對腦中風患者穿戴兩種踝足 矯具:ToeOFF AFO 以及 SAFO 下進行步態分析,以期藉由研究了解其功能及對 腦中風患者步態改善的功效,並了解何種裁切線形式的踝足矯具對於中風病人歩 態改善最有幫助。
方法: 本研究募集九位偏癱型腦中風患者,在下述三種情況下來回行走進行步態
分析:(1)只穿著運動鞋,(2)雙腳著運動鞋並在患側穿著ToeOFF AFO,(3)雙腳著
運動鞋並在患側穿著SAFO。步態分析各項資料及參數由 OPTOTRAK 動作分析系
統以及AMTI 測力板取得;並利用 BodyGemTM calorimeter 量取耗氧量各項參數。
結果:本研究結果顯示,(1) ToeOFF AFO 符合研究假設所提出的改善步態表現 之行走速度、步頻、步長、提高推進力、加強與地面接觸的平順度、降低能量消
耗等;(2)在有垂足問題的兩位受試者的機械能傳遞分析中顯示,ToeOFF AFO 雖然
提供受試者在踝關節處產生相較於只穿運動鞋以及著 SAFO 情況下較大的能量,
但經由能量傳遞分析結果得知,此一能量並未完全有效地傳遞於個體向前推進;(3)
SAFO 對於時間空間步態參數的改善較為顯著。
結論:對於腦中風病人來說,使用適當的AFO 以提供對缺損之功能的補充是復健
工作上非常重要的課題。不同症狀的病人對於AFO 的選擇會有不同,有的病人需
要提供穩定性,有的病人需要藉由AFO 以提供較好的推進力。本研究的結果顯示,
ToeOFF AFO 雖改變受試者的步態表現並且可提供受試者較高的能量,但其改變步 態的方式無法給予參與研究的腦中風患者足夠的穩定性及適應; SAFO 能夠提供 患者較好的穩定性,因此對於步態改善的效果較為顯著。
關鍵詞:腦中風、步態分析、踝足部矯具、耗能分析
Abstract
Objective: The aim of this study was to investigate the effectiveness of the ToeOFF
AFO in hemiplegic gait in CVA patients with ankle paralysis problem, and compared it with the conventional custom-made solid ankle AFO. The comparison would include biomechanical performance in spatio-temporal parameters, joint kinematics, and joint kinetic as well as the ankle-foot roll-over shape, asymmetry ratio, and push-off power in terminal stance.
Design: Experimental gait analysis; Repeated measure ANOVA analysis.
Participants: Nine CVA hemiplegia patients (5 males, 4 females) participated in this
study. Five subjects were left and four were right involved.
Setting: Rehabilitation Engineering Research Center with instrumented gait laboratory.
Interventions: Three conditions: shoes only (SHOE), shoes with solid ankle AFO
(SAFO), and the same shoes with ToeOFF AFO (TOEOFF).
Main outcome measures: Significance in spatio-temporal parameters, gait
performance, asymmetry ratio, and ankle-foot roll-over shape.
Results: The major finding of this study included: (1) the ToeOFF AFO was found to be
consistent of the hypotheses, which improved the walking speed, cadence step length, temporal symmetry, ankle power generation, foot contact patterns, and energy cost; (2) in subjects of drop foot group, the power flow analysis showed that part of the greater
power generation with the ToeOFF AFO was partially transferred to trunk as support; (3) the SAFO provided more stability resulted in improving the spatio-temporal parameters more.
Conclusion: For CVA patients, walk with an adequate AFO to compensate the deficit
functions is a very important issue in rehabilitation work. Dissimilar configurations of AFOs provide different effectiveness for certain condition of patients. The results of this study supported that the SAFO provided better stability, and the ToeOFF AFO provided better power generation. The generated power could make use for propulsion in more stable patients. Accordingly, these findings in the present study provided as a reference to choose an adequate AFO by considering what’s the majority of the patients need? The propulsion power or the stability is.
Key words: Stroke, Gait analysis, Ankle-foot orthosis, Energy consumption
Contents
致謝 ...I 摘要 ... II Abstract ... IV Contents... VI Figure contents... VIII Table contents... IX
Chapter 1 Introduction ...- 1 -
1.1 Background ...- 1 -
1.2 Research motivation ...- 2 -
1.3 Literature reviews...- 3 -
1.3.1 Hemiplegic CVA gait deviations and patterns ...- 3 -
1.3.2 Recent development of advanced AFO’s and orthotic interventions………- 9 -
1.3.3 Initial contact and smoothness of the gait ... - 11 -
1.3.4 Push-off power in terminal stance phase of the gait...- 12 -
1.3.5 Ankle-foot roll-over shape...- 13 -
1.3.6 Energy consumption on pathological gait of hemiplegic CVA patients...- 13 -
1.4 Objectives and hypotheses ...- 14 -
Chapter 2 Materials and Methods ...- 16 -
2.1 Subjects...- 16 -
2.2 Materials...- 17 -
2.3 Procedure...- 21 -
2.4 Data analysis ...- 24 -
2.5 Statistical analysis ...- 28 -
Chapter 3 Results...- 29 -
3.1 Clinical assessment ...- 29 -
3.2 Gait performance...- 32 -
3.2.1 Spatio-temporal parameters...- 32 -
3.2.2 Joint kinematics and kinetics ...- 35 -
3.2.3 Ankle-foot roll-over shape...- 39 -
3.2.3 Energy expenditure ...- 41 -
Chapter 4 Discussion ...- 42 -
4.1 Effectiveness of the ToeOFF AFO on gait for CVA subjects...- 42 -
4.2 Comparison of the ToeOFF AFO and Solid ankle AFO...- 43 -
4.3 The Drop foot group ...- 46 -
Chapter 5 Conclusion ...- 55 -
References...- 57 - Appendix A...- 60 - Appendix B...- 63 -
Figure contents
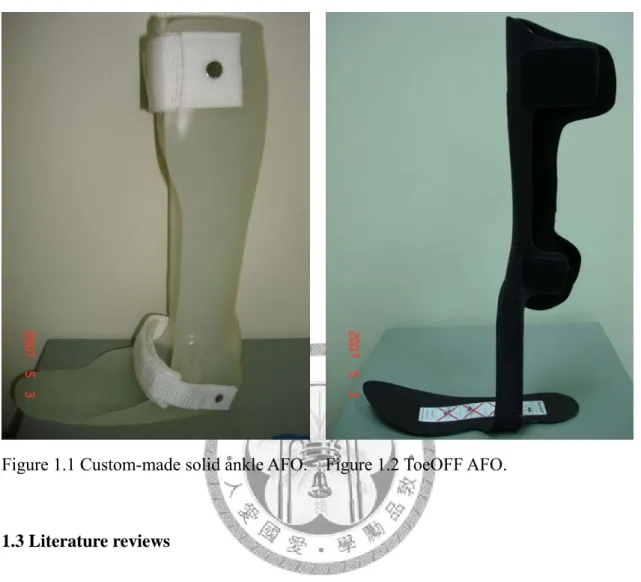
Figure 1.1 Custom-made solid ankle AFO. ...- 3 -
Figure 1.2 ToeOFF AFO...- 3 -
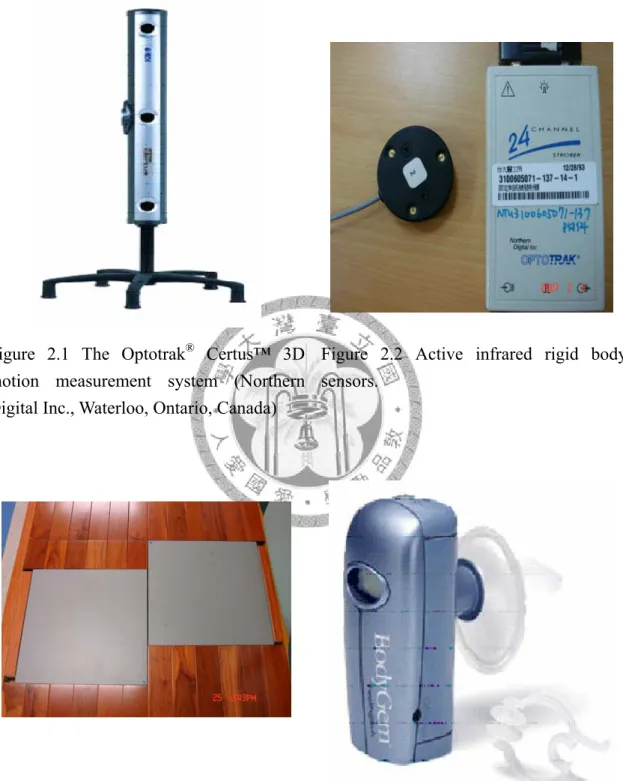
Figure 2.1 The Optotrak® Certus™ 3D motion measurement system (Northern Digital Inc., Waterloo, Ontario, Canada)···- 19 -
Figure 2.2 Active infrared rigid body sensors. ···- 19 -
Figure 2.3 AMTI® force plates (Advanced Mechanical Technology Inc, Watertown MA, USA) ···- 19 -
Figure 2.4 The BodyGemTM Hand-Held Indirect Calorimeter (Healthetech, Inc., Goolden, CO, USA) ···- 19 -
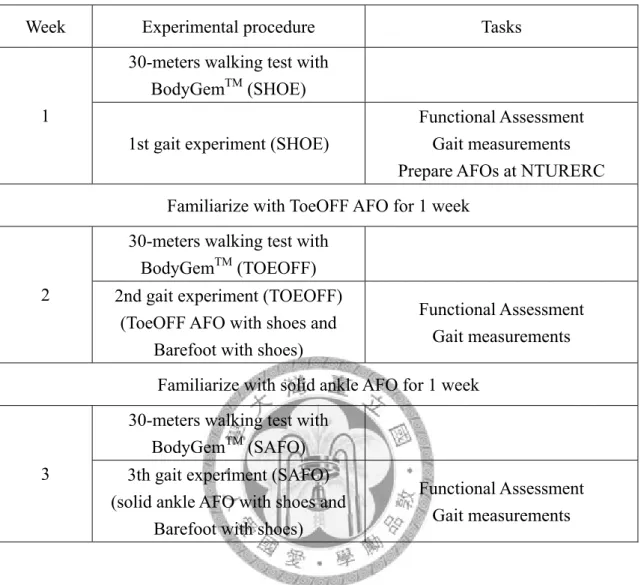
Figure 2.5 The entire gait experimental lab setting.···- 20 -
Figure 2.6 Subjects with the mask of BodyGemTM calorimeter. ···- 20 -
Figure 2.7 Seven rigid body sensors were attached on lower extremities of subjects by Velcro tapes, including bilateral feet, shanks, thighs, and the pelvis.·· - 20 - Figure 2.8 The stylus···- 20 -
Figure 2.9 The transformation from the Global coordinate system to the shank-based coordinate system. ···- 27 -
Figure 2.10 Schematic diagram of the leg during stance phase of walking ···- 27 -
Figure 3.1 Paretic limb support duration.···- 34 -
Figure 3.2 Non-Paretic limb support duration in. ···- 34 -
Figure 3.3 Comparison of 3 conditions in sagittal plane motion for paretic side.- 37 - Figure 3.4 Comparison of 3 conditions in sagittal plane motion for non paretic side. ···- 38 -
Figure 3.5 Ankle-foot roll-over shape of one of subjects in SHOE condition. ····- 40 -
Figure 3.6 Ankle-foot roll-over shape of one of subjects in SAFO condition. ···- 40 -
Figure 3.7 Ankle-foot roll-over shape of one of subjects in TOEOFF condition.- 41 - Figure 4.1 The power flow analysis in SAFO condition of S2. ···- 50 -
Figure 4.2 The power flow analysis in TOEOFF condition of S2···- 51 -
Figure 4.3 The power flow analysis in SAFO condition of S4 ···- 52 -
Figure 4.4 The power flow analysis in TOEOFF condition of S4···- 53 -
Figure 4.5 The power flow analysis of the ToeOFF AFO and the SAFO for subject 2 and 4.···- 54 -
Table contents
Table 2. 1 Summary of the experimental procedure. ···- 22 -
Table 2. 2 The digitized landmarks. ···- 24 -
Table 3. 1 General physical data of the subjects. ···- 30 -
Table 3. 2 Physical assessment of the subjects. ···- 31 -
Table 3. 3 The spatio-temporal parameters of the subjects. ···- 33 -
Table 3. 4 Mean of specific values at different phases or sub-phases. ···- 36 -
Table 3. 5 The ankle-foot roll-over shape analysis of the Drop foot group. ···- 39 -
Table 3. 6 Means and SDs for energy expenditure of the subjects···- 41 -
Table 4. 1 The ankle-foot roll-over shape analysis of the Drop foot group ···- 44 -
Table 4. 2 Several specific parameters among the 3 conditions. ···- 46 -
Chapter 1 Introduction
1.1 Background
Cerebrovascular accident (CVA), also called stroke is one of the most common neuromuscular disorders among the elderly population (Statistics of Deparment of Health, Taiwan). In the acute stage, abnormality in cerebral circulation will result in neurological dysfunctions corresponding to involved focal areas of the brain (WHO, 1989). The life expectancy of CVA patients after recovery has been prolonged due to rapid development in surgical and health care technology. However, the morbidity remains high. Survivors of CVA’s encounter all kinds of residual deficits that influence their daily life. The loss or insufficiency of functional locomotion in patients with CVA’s is the most primary deficits that can be improved in the rehabilitation program. Rehabilitation management often requires specific orthoses to achieve the functional recovery goals. Ankle foot orthoses (AFOs) are frequently prescribed to improve the hemiplegic gait following a stroke. AFOs are designed to compensate for common abnormalities in hemiplegic gait such as drop foot or inappropriate initial contact due to muscle weakness (inadequate ankle dorsiflexion), insufficient propulsion power induced at ankle joint (inadequate ankle plantarflexion), spasticity or contracture (Gok et al., 2003).
1.2 Research motivation
Appropriately prescribed AFOs have been proved to correct the lower limb alignment and gait performance for CVA patients with impaired dorsiflexion at initial contact, decreased plantarflexion in mid to late stance and insuffinicent dorsiflexion for foot clearance during the swing phase (Lehmann, 1983). A polypropylene custom-made solid ankle AFO (SAFO, Figure. 1.1) is one of the most frequently type of AFO prescribed to improve gait performance. In the present orthotic market, there was also a pre-made AFO, called the ToeOFF AFO manufactured by Camp Scandinavia, ALLARD Int. (Figure 1.2) As the ToeOFF® Clinical Manual states, the ToeOFF AFO is indicated for patients with drop foot resulting from neurological condition or with ankle instability. The orthosis is made of glass fiber, carbon fiber, and Kevlar material (a thermoset plastic hybrid compound). This orthotic design composes of an anterior shell, a full foot plate with a helical connection on the lateral ankle section to connect the shell and footplate. In light of the different orthotic design and materials choice, one could suspect that these two configurations of AFOs must produce different gait performance kinetics and kinematics. A comparison of these two types of AFO’s effectiveness on gait performance of CVA has yet been studied. Therefore this comparison study was conducted to investigate the effectiveness of the gait performance of the ToeOFF AFO compared to SAFO in CVA patients with hemiplegic gait with
insufficient stability and motion control of ankle joint.
Figure 1.1 Custom-made solid ankle AFO. Figure 1.2 ToeOFF AFO.
1.3 Literature reviews
1.3.1 Hemiplegic CVA gait deviations and patterns
One of the major goals of rehabilitation for a patient recovering from a CVA is to
restore normal ambulation. Motor deficits of patients who suffered from CVA are characterized by muscle paralysis (hemiplegia) or weakness (hemiparesis) on the side of the body opposite to the site of the brain lesion (O’Sullivan, et al., 2001). This hemiplegia or hemipraresis may compromise the patients ability to generate adequate strength or control for voluntary movements. The major problems of gait of hemiplegic CVA patients can be described into two aspects on the gait deviations of: (1)
the stance phase and (2) the swing phase.
During the early stance phase, the gait deviations in ankle/ foot complex include equinovarus foot which resulting in initial contact of the forefoot, an unequal step length, a lack of dorsiflexion range on the involved side, and an instability of ankle joint in mid stance. At the end of the stance phase in normal gait, the body is forward progressing by the push-off power. However, for patients recovering from a CVA, such push off is difficult to be generated when the ankle is paralyzed. At the knee joint, weak knee extensors will either cause excessive flexion or hyperextension during forward progression. While normal gait producing small amount (about 20 degrees) of knee flexion during forward progression, an excessive flexed knee during forward progression is a result of a knee flexion contracture or delayed contraction of knee extensors. This causes an excessive ankle dorsiflexion of more than neutral combined with weak hip and knee extension weakness or poor propioception at knee and ankle.
In this situation, the knee joint remains an abnormal degree of 20 to 30 degrees during forward progression.
On the other hand, knee recurvatum during forward progression can be a result from weak knee extensors. As a stabilizing force to prevent the knee from buckling during mid-stance, the patient with CVA compensates by locking knee in hyperextension. This knee recurvaturm continues and delays forward progession. In
addition knee recuravatum during forward progression can result from an ankle plantarflexion contracture greater than 90 degrees or severe spasticity in quadriceps.
With impaired propioception, the knee is instable or snaps back into recurvatum.
Last, in gait deviations at hip joint, poor propioception or positioning (typically in hip adduction or flexion) is one of the gait abnormalities during stance phase. Also weak abductors at hip joint result in Trendelenburg limp during this phase.
While the swing phase, the ankle joint shows deviations on several aspects.
Ankle plantarflexors contracture or spasticity, dorsiflexors weakness, and delayed contraction of dorsiflexors cause the foot-drop pattern. This deviation causes toes dragging during mid-swing. Weak or spastic quadriceps causes inadequate knee flexion which induces insufficient foot clearance. And weak knee extensors or propioception causes inadequate foot positioning at the end of swing phase.
Gait analysis studies report reduced walking speed, lower stride length, lower cadence, and longer stance phases on paretic side are reported (Olney, 1996). A linear relationship between the decreased stride length and cadence with walking speed has been found (Nakamura et al, 1988). In addition, the relationship between cadence and walking speed are linear up to a speed of about 0.33 m/s and a cadence of about 90 step/
min. Furthermore, they found that further increase on waling speed primarily attribute to increases in stride length. Hsu determined that the walking speed of patients with
CVA ranged from 0.18 to 1.03 m/s depending on the level of severity (Hsu, 2003).
The changes in the proportion of stance and swing phase phase for the patients with a CVA are described as follow (Olney, 1996): first, the stance phase of both the paretic and non paretic side is longer in duration and occupies a greater proportion of the full gait cycle in subjects with CVA than in able-bodied walking at normal speeds; second, the stance phase is longer and occupies a greater proportion on paretic side than on non paretic side; third, a greater proportion of gait cycle is spent in double support than that of able-bodied walking at normal speeds.
Furthermore, joint motion is very different between normal and CVA hemiplegic gait. Comparing the results reported by Burdett et al with normal gait, hemiplegic gait was characterized by the following differences: (1) decreased hip flexion at heel-strike, increased hip flexion at toe-off, and decreased hip flexion during mid-swing; (2) more knee flexion at heel-strike and less knee flexion at toe-off as well as mid-swing, and (3) reduced ankle dorsiflexion at heel-strike as well as mid-swing and less ankle plantarflexion at toe-off (Burdett, 1988). Other evidence of kinematic and kinetic gait patterns is identified in three planes across patients with CVA in a study of Kim and Eng (2004). They found that in the frontal plane, a gait pattern different from that found in a normal person’s gait is identified at the hip joint on the paretic side. It displayed an additional hip abductor moment associated with a positive power burst at
toe-off into swing which resulted in a second abduction angle peak. Two common patterns are also identified at the knee in the frontal plane. The first pattern is an valgus moment throughout stance. This valgus moment was associated with a knee power generation phase resulting in knee valgus in early stance and a knee power absorption phase resulting in knee valrus during propulsion. In addition, a second pattern of knee varus moment just prior to toe-off is found in some of their subjects on their paretic and non-paretic limbs, respectively, which is associated with a power generation phase during propulsion.
In the transverse plane, except for the hip joint, Kim and Eng also noted that gait patterns on the paretic side are highly variable across those subjects. At the knee, at least two distinct moment patterns are identified. One pattern consisted of an external rotator moment for the first half of stance followed by an internal rotator moment in the latter half of stance on the involved side. Another pattern consisted of an internal rotator moment throughout stance. The knee power phases are very low and highly variable with only one consistent characteristic: a generation burst during push-off.
Several patterns are also identified at the ankle joint. The most predominant pattern is the pronation moment at the subtalar joint through most of stance. This moment pattern is associated with a consistent absorption burst during push-off resulting in subtalar supination as the heel lifted off from the floor and moved laterally on the
forefoot in contact with the ground.
Last, Kim and Eng identified in the sagittal plane, more than one type of gait pattern should be noted. On the paretic side, in addition to the typical knee extensor-flexor-extensor moment pattern found in normal gait, half of the subjects recovering from a CVA displayed a knee flexor moment pattern. This flexor moment pattern is associated with a kinematic knee extension thrust pattern in eight of those subjects. These subjects showed knee extended (or hyperextended) at weight acceptance which is not normally seen in normal gait. This corresponding knee power phase represented the negative work done by the knee flexors and other soft tissues eccentrically controlling the abrupt knee extension. In healthy gait, there is a phase that is commonly seen which occurred later in stance which produces positive work to flex the extended knee in preparation for swing phase. At the ankle joint, sagittal kinetic patterns differed between the paretic and non-paretic sides in that there was an absence of dorsiflexor moment at initial contact on the paretic side. The absence of the normal eccentric dorsiflexor moment resulted in a lack of plantarflexion after initial contact in those subjects (Kim and Eng, 2004).
1.3.2 Recent development of advanced AFO’s and orthotic interventions
AFOs are widely prescribed for hemiplegic CVA patients with common problems in such as foot drop (inadequate ankle dorsiflexion) or inappropriate initial contact due to muscle weakness, spasticity or contracture. The AFO’s provide corrective force and induce proper moments for joint movements. The biomechanical analysis of the AFO is based on the three-force system and the resultant corrective moment (Bowker et al., 1993). The indication of the AFO’s from the perspective of the sagittal-plane three-force system is prescribed under the following two conditions: (a) when the patients are characterized with weakness or absent of dorsiflexors, (b) when the patients are characterized with weakness or absent of plantarflexors. Total absent of dorsiflexor power results in a foot drop which inhibits foot clearance during swing and requires compensatory increases in hip and knee flexion. The AFO provides
“three-force system” in the sagittal plane to the control of drop foot during swing. In addition, the AFO prevents forefoot contact at initial contact often seen in CVA hemiplegic gait by supporting the foot in neutral dorsiflexion in preparation for initial contact. Last, weakness or absent of plantarflexors will cause excessive dorsiflexion prior to heel-off during the second half of the stance phase of walking. This gait pattern results in absent of push-off power and significantly decreased walking speed.
The three force system of the AFO provides correction for excessive dorsiflexion and
more power for propulsion subsequently.
In the report of Lehmann, et al., their subjects were given a peroneal and/ or tibial nerve blocks causing flaccid ankles as seen in some hemiplegic CVA patients. In their study, the AFO is found to substitute for muscle function, performs the foot-ankle motion of heel-strike and allows a push-off action (Lehmann et al., 1980). In their another study in 1985, subjects that were given a tibial nerve block were showed to have minimized gait deviations by using an AFO with a rigid anterior stop (Lehmann et al., 1985). This reveals that the ankle-foot orthoses can provide proper corrective force and moment for the weak calf muscles to achieve better gait performance.
In the past years, a more contemporary AFO has also been developed using modern materials such as the thermo-plastic polypropylene. Still, other different materials are used for some special designed ankle-foot orthoses. The ToeOFF® is constructed of glass, carbon, and Kevlar (Dupont, Wilmington, DE) fiber and consists of helical trimline with a footplate, an anterior shell, and a lateral strut. The designers of the ToeOFF AFO claim that the design and materials used in ToeOFF® will:
a. help prevent foot slap at initial contact b. provide M-L stability at mid-stance c. help propel the limb at terminal stance
d. pick the toes up for clearance during swing phase, and
e. optimize patient comfort while optimizing the integrity and durability of the orthosis (ToeOFF® Clinical Manual).
The special trimline design does provide better flexibility (Yamamoto et al., 1993).
Molteni has pointed out some improvement of using the ToeOFF AFO. He concluded that using the ToeOFF AFO made it possible to control the insufficient dorsiflexion of the swing phase, and also improve the dynamics of the step taken during the loading response period due to: 1) more stable on ankle in the frontal plane, 2) reduction in the shock absorbed by the ankle during the initial heel strike to loading response, and 3) improvement in the forward movement of the center of pressure in the sagittal plane during the loading response period, which achieve more smoothing forward pattern (Molteni, 2001).
1.3.3 Initial contact and smoothness of the gait
Initial contact is the first period of double stance phase. During this period, the plantarflexor motion is slowed by the eccentric contraction of the dorsiflexors (Lehmann, 1993). The subphase between initial contact and entire foot plate contact is the loading response. The smoothness of going through from initial contact to loading response may influence the gait performance. The simultaneous events induced by both the plantarflexors and the dorsiflexors properly control the smoothness of this period. The dorsiflexion motion is restricted during the mid-stance by the
gastroncnemius and soleus and only after heel-off does the ankle move into plantarflexion. Because of dorsiflexion muscle weakness, some CVA hemiplegic gait displays forefoot contact instead of heel contact at this period in normal gait. Patients with CVA are prescribed SAFO to help them achieve the adequate initial contact positioning and also improve the smoothness of walking patterns. Because the SAFO can stabilize their foot at the ankles from not to “drop” before the initial contact phase, this helps to act adequate positioning (Lamontagne et al., 2000). In the other hand, the
SAFO fix their ankles may restrict smoothness of initial contact. However, the effectiveness of the ToeOFF® on this function is not yet clear in terms of its design parameters which are different from those of SAFO.
1.3.4 Push-off power in terminal stance phase of the gait
During push-off, the body is accelerated upward and forward, and the vertical force may be up to 120% of body weight (Lamontagne et al., 2000). This is the period
which the highest generation of power of the entire gait cycle to accelerate the whole body and the leg forward. In normal gait, the push-off power is primarily induced by the plantarflexors include gastroncnemius, soleus, and plantaris. But in hemiplegic CVA patients with flaccid ankles, they cannot produce proper plantarflexor power because of muscle weakness. The intervention of AFO becomes much more influencial to them. It is not known if the SAFO which fix the ankle joint at the
neutral position may not induce enough power for plantarflexion at the pre-swing phase subsequently. Likewise, the plantarflexion assist moment of the ToeOff is also not clear yet.
1.3.5 Ankle-foot roll-over shape
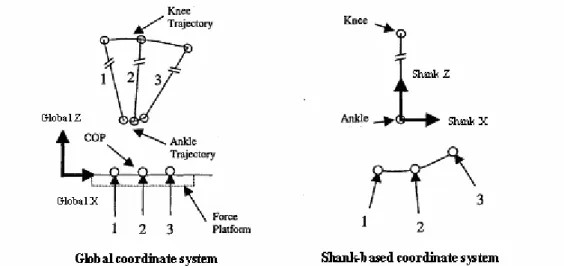
Perry (1992) has described the foot and ankle complex during stance phase with three rockers: heel rocker, ankle rocker, and forefoot rocker. These three rocker motions can be integrated into continuous roll-over shape geometry. Hansen et al. has proposed the calculation of ankle-foot roll-over shape which involved a transformation of COP progression data from global coordinate system (laboratory-based coordinate system) to an ankle-knee coordinate system (shank-based coordinate system) with the origin at the ankle (Hansen and Childress, 2000). Hansen et al was able to measure the 2-D ankle-foot roll-over shape in the sagittal plane and the center of pressure (COP) progression and the configuration fit into an arc. A proper roll-over shape is essential for efficient walking and that characterization of this progression may be beneficial as an outcome measure for various foot and ankle surgeries, therapies, and AFO designing (Lehmann et al., 1985). In order to understand the mechanism of ankle and foot motion on wearing AFO, it is important to determine the roll-over shape.
1.3.6 Energy consumption on pathological gait of hemiplegic CVA patients
Energy expenditure of walking for persons with hemiplegia is variable, depending
on the extent of neurological dysfunction and spasticity (Hansen et al., 2004). Because
of their gait deviations at hip, knee, and ankle, researchers should note their energy consumption during walking. With intervention of the AFOs, the energy consumption for hemiplegic CVA patients might show different tendency on improvement.
1.4 Objectives and hypotheses
The aim of this study was to investigate the effectiveness of the ToeOFF AFO in hemiplegic gait in CVA patients with ankle paralysis deficients, and compared it with that in the custom-made SAFO. The comparison would include biomechanical performance in spatio-temporal parameters, joint kinematics, and joint kinetic as well as the ankle-foot roll-over shape, asymmetry ratio, and push-off power in terminal stance.
The hypotheses of this study were divided into two parts:
First, it is hypothesized that both the two configurations of AFOs would improve gait performance in several aspects described as followings:
1. Improvement on slower walking speed, shorter step length, and slower cadence commonly seen in the in spatio-temporal parameters in the gait patterns in patients with CVA.
2. Improvement on gait symmetry on step length and stance phase duration between paretic and non paretic sides.
Second, it is hypothesized that the ToeOFF AFO would have superior effects than
SAFO on the following parameters:
1. Greater generation on push-off power in terminal stance, thus improved the gait performance more;
2. Induced better foot contact smoothness, and improve the ankle-foot roll over shape;
3. Reduced more energy consumption during gait in patients with ToeOFF AFO and SAFO.
Chapter 2 Materials and Methods
2.1 Subjects
CVA patients with hemiplegia who were consistent with the inclusion criteria were recruited from the Department of Rehabilitation at Mennonite Christian Hospital in Hwalian, Taiwan. The inclusion criteria were described as follows. The subjects should:
(1) be at post-acute, at least six months after the onset, and also can walk without manual assistance or any other aids for at least 30 meters.
(2) be within score 2 in ankle muscle spasticity tests which performed with the Modified Ashworth Scale (MAS) as well as the Modified Tardieu Scale (MTS) scoring system.
(3) have sufficient muscle strength on lower extremity of the non paretic side which performed by Manual Muscle Test (MMT) while have above score 3 in knee flex-/extensor and hip flex-/extensor muscle strength tests but 0-2 in ankle dorsiflex-/plantarflexor muscle strength test.
(4) have no contractures on lower extremities and the ankle joint range of motion should be more than 5 degrees in both dorsiflexion and plantarflexion.
(5) have been prescribed to wear SAFO by physicians.
(6) be able to follow the instructions.
Each patient who participated in this study was explained the experimental procedure first and signed the informed consent approved by the Institutional Review Board of the Mennonite Christian Hospital (Appendix A).
A 3-D gait experiment was designed to investigate the gait performance of subjects in three different conditions. The three conditions were described as follows: (1) SHOE: subjects wore only tennis shoes, (2) SAFO: subjects wore SAFO and the same shoes worn in SHOE condition, and (3) TOEOFF: subjects wore ToeOFF AFO and the same shoes worn in SHOE condition.
2.2 Materials
Experimental instruments
The Optotrak® Certus™ 3D motion measurement system (Northern Digital Inc., Waterloo, Ontario, Canada) includes three position sensors (Figure 2.1) coupled with rigid body sensors which were composed of three active-infrared light emitting diodes (LEDs) fixed on a disc (Figure 2.2) to evaluate the gait. Three-dimensional position and motion of segments were recorded through seven rigid body sensors, and captured by the measurement system placed behind the subjects. The sampling rate was 50 Hz.
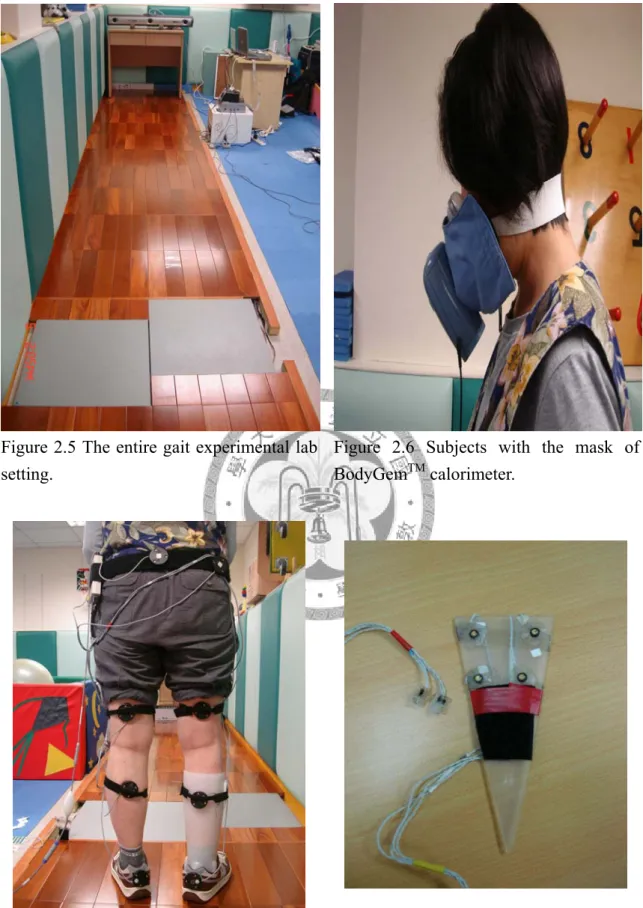
Kinetic parameters were recorded via two AMTI® force plates (Advanced Mechanical Technology Inc, Watertown MA, USA) embedded in the walkway (Figure 2.3). Each force plate measures with sampling rate 200 Hz. The energy expenditure was
measured before the gait experiments by the BodyGemTM Hand-Held Indirect Calorimeter (Healthetech, Inc., Goolden, CO, USA) (Figure 2.4). The entire gait experiment lab setting was shown in Figure 2.5.
Ankle-foot orthosis preparation
The SAFO were custom made for each subject and delivered by the clinical staffs of Rehabilitation Engineering Research Center, National Taiwan University (RERC of NTU). Standard clinical procedure for the delivery involved casting, mold modification, fabrication, and fitting (Appendix B). The ToeOFF AFOs were obtained through the Camp Scandinavia, ALLARD Int. Proper clinical assessment, measurement and fitting were supervised by an experienced orthotist. The ToeOFF® used only in the experimental period.
Figure 2.1 The Optotrak® Certus™ 3D motion measurement system (Northern Digital Inc., Waterloo, Ontario, Canada)
Figure 2.2 Active infrared rigid body sensors.
Figure 2.3 AMTI® force plates (Advanced Mechanical Technology Inc, Watertown MA, USA)
Figure 2.4 The BodyGemTM Hand-Held Indirect Calorimeter (Healthetech, Inc., Goolden, CO, USA)
Figure 2.5 The entire gait experimental lab setting.
Figure 2.6 Subjects with the mask of BodyGemTM calorimeter.
Figure 2.7 Seven rigid body sensors were attached on lower extremities of subjects by Velcro tapes, including bilateral feet, shanks, thighs, and the pelvis.
Figure 2.8 The stylus. Use the bottom of cutting-edge of the stylus to point at each specific landmark.
2.3 Procedure
Each subject first underwent assessments of muscle strength, and spasticity of the ankle plantarflexor of the paretic side. The total potocol would take three weeks for the gait experiments of each subject, and each week performed an experiment for one of the three conditions: SHOE, SAFO, TOEOFF (Table 2.1).
Week 1: Performed the clinical assessment of subjects as well as the 30-meter walking test for energy consumption analysis and then the SHOE condition gait experiment. The ToeOFF AFO were provided to subjects for one-week accommodation. At the same time, subjects’ legs were molded for making SAFOs.
Week 2: Proceeded the 30-meter walking test for energy consumption analysis and then the TOEOFF condition gait experiment. The SAFO was provided to subjects for one-week accommodation.
Week 3: Proceeded the 30-meter walking test for energy consumption analysis and then the SAFO condition gait experiment.
Table 2. 1 Summary of the experimental procedure.
Week Experimental procedure Tasks
30-meters walking test with BodyGemTM (SHOE) 1
1st gait experiment (SHOE)
Functional Assessment Gait measurements Prepare AFOs at NTURERC Familiarize with ToeOFF AFO for 1 week
30-meters walking test with BodyGemTM (TOEOFF) 2 2nd gait experiment (TOEOFF)
(ToeOFF AFO with shoes and Barefoot with shoes)
Functional Assessment Gait measurements Familiarize with solid ankle AFO for 1 week
30-meters walking test with BodyGemTM (SAFO) 3 3th gait experiment (SAFO)
(solid ankle AFO with shoes and Barefoot with shoes)
Functional Assessment Gait measurements
The gait experimental procedure was described as follow:
(1) Energy expenditure test.
The energy expenditure test was first carried out before the gait trials. Subjects put on the mask of BodyGemTM calorimeter on and walk with self-selected speed for 30 meters (Figure 2.6).
(2) Setting sensors and landmarks on subject.
Seven rigid body sensors were attached on lower extremities of subjects by Velcro tapes,
represented its attached segment. After setting sensors, the step “digitize” was taken to determine the body segmental position and the specific landmarks. Using the tip of a digitizing probe of the Optotrak® Certus™ which is called “stylus” to locate the landmarks based on the rigid body sensor (Figure 2.8). Modified Helen Hayes marker sets were adopted. There were 19 landmarks on the lower limb and the pelvis digitized (Table 2.2). During the digitizing, subjects were instructed to hold on the static position as possible as they can.
(3) Walking back and forth on the gait analysis walkway where were two force plates embedded with.
The subjects were not alerted to the presence of the force plates, nor were they instructed to walk over them. As many walks as necessary were carried out by each subject to achieve a clean strike by each foot on the force plates for at least three trials.
Adequate time for rest was allowed between trials.
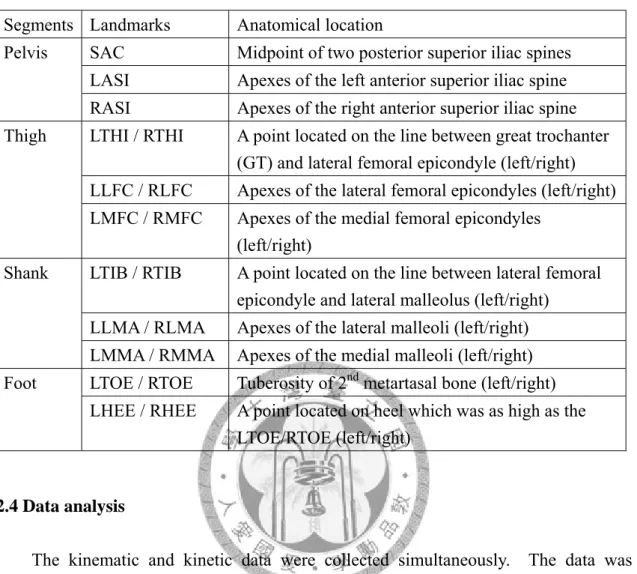
Table 2. 2 The digitized landmarks.
Segments Landmarks Anatomical location
SAC Midpoint of two posterior superior iliac spines LASI Apexes of the left anterior superior iliac spine Pelvis
RASI Apexes of the right anterior superior iliac spine LTHI / RTHI A point located on the line between great trochanter
(GT) and lateral femoral epicondyle (left/right) LLFC / RLFC Apexes of the lateral femoral epicondyles (left/right) Thigh
LMFC / RMFC Apexes of the medial femoral epicondyles (left/right)
LTIB / RTIB A point located on the line between lateral femoral epicondyle and lateral malleolus (left/right)
LLMA / RLMA Apexes of the lateral malleoli (left/right) Shank
LMMA / RMMA Apexes of the medial malleoli (left/right) LTOE / RTOE Tuberosity of 2nd metartasal bone (left/right) Foot
LHEE / RHEE A point located on heel which was as high as the LTOE/RTOE (left/right)
2.4 Data analysis
The kinematic and kinetic data were collected simultaneously. The data was synchronized and analyzed by a custom Matlab (MathWorks Inc., Natick, MA, USA) program. The spatio-temporal parameters in relation to walking speed (m/s), cadence (step/min), paretic lead step length (m), non paretic lead step length (m), step width (m), stance phase duration (%), and duration of single and double limb support (%) were collected and analyzed. The data compiled from the motion analysis system and the force plates was used to calculate the joint angles, joint moment, and joint power.
Specific parameters were also calculated to evaluate the gait performance including asymmetry ratio, and ankle-foot roll-over shape.
Duration of single and double limb support (%)
Limb support duration was determined by several major gait events: initial contact (IC), opposite toe-off (OTO), opposite heel contact (OHC), toe-off (TO), 2nd heel contact (2nd HC), which represented four specific intervals. The four durations were the two double limb support, single limb support, and the swing phase. The proportion of total four durations was normalized to 100 %. Evaluate the percentage separately enables to interpret the gait cycle in temporal scale.
The joint angles, joint moments, and joint powers
Joint angles, joint moments and joint powers of ankle joint, knee joint, and hip joint motions in three anatomical planes were calculated and analyzed. The maximum or minimum values during different phases or sub-phases (such as ankle dorsiflexion angle at initial contact, knee extensor moment at mid-stance, and ankle push-off power at pre-swing, etc) would also address to discuss the gait performance. All the kinematic and kinetic data recorded during gait were normalized to 100% of the gait cycle.
Asymmetry ratio
In order to qualify the asymmetry for paretic side and non paretic side, an asymmetry ratio of specific gait parameters was calculated respectively as follows:
z The asymmetry ratio
=
side paretic non
side paretic
− 1
Paretic side represented the parameters evaluated from the paretic extremity, and non paretic indicated the other side. The greater the ratio was meant the greater the asymmetry level was. Asymmetry ratio of stance phase duration and step length was evaluated to interpret temporal and spatial gait symmetry of performance.
Ankle-foot roll-over shape
The data compiled from the period between initial contact and toe-off including the center of pressure (COP) in the X-direction (forward progression) as well as the position in the X, Z-direction (X-direction referred to the forward direction and Z-direction referred to the upright direction) of the ankle and knee joint center were utilized to calculate the ankle-foot roll-over shape. The ankle and knee joint center were evaluated by the centroid of medial and lateral maleoli (ankle) as well as medial and lateral femoral epicondyles (knee). The calculation of roll-over shape involved a transformation of COP data from global coordinate system (laboratory-based coordinate system) to a shank-based coordinate system with the origin at the ankle joint center (Hansen and Childress, 2000) [6]. The COP progression trajectory was fitted into an arc shape which had dissimilar radius within each different trial.
Figure 2.9 The transformation from the Global coordinate system to the Shank-based coordinate system. (Edited from Hansen and Childress, 2000)
Figure 2.10 Schematic diagram of the leg during stance phase of walking (Hansen and Childress, 2000).
Energy expenditure
The BodyGemTM Hand-Held Indirect Calorimeter directly collected the ratio of oxygen consumption per minute (VO2/min). The data compiled would be averaged for each condition as well as normalized by body weight (VO2/min/Kg) and walking velocity (VO2/Kg/m).
2.5 Statistical analysis
All statistical analyses were performed by the SPSS, version 15.0, for Windows®. One way repeated measure ANOVA was performed in this study to evaluate the significance for the results of three experimental conditions. P-value less than 0.05 (α
level) was used to justify the significance for all statistical analyses.
Chapter 3 Results
3.1 Clinical assessment
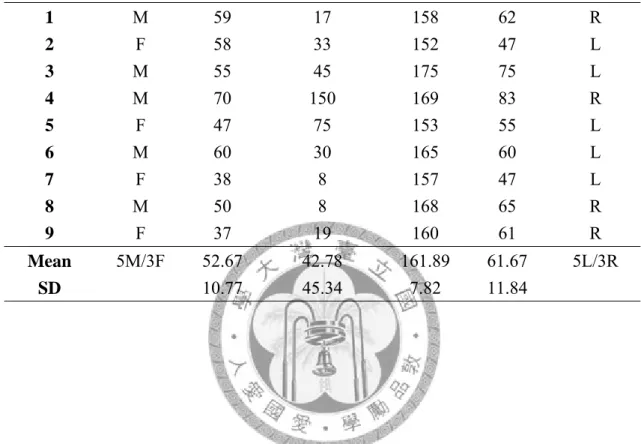
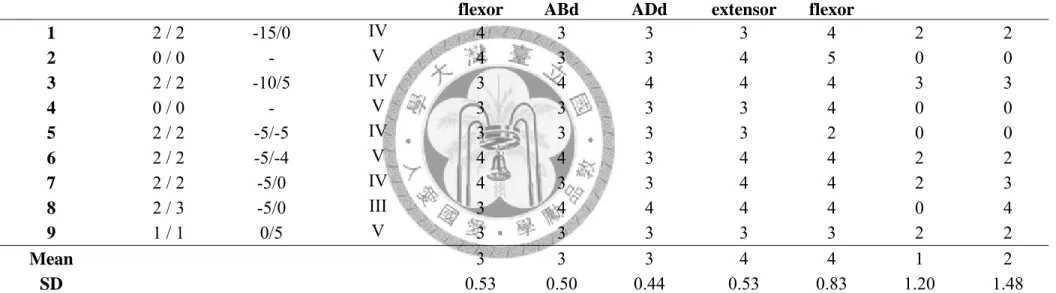
Nine hemiplegic CVA patients (5 males, 4 females) participated in this study. The mean age of the subjects was 52.67 years (10.77) and the average post-onset duration was 42.78 months (45.34). Five subjects were left hemiplegic and four were right hemiplegic. General physical information and assessment of the subjects were summarized in Table 3.1. The spasticity assessment of ankle musculature muscle and range of motion (ROM)plantarflexors on the paretic side was performed manually using the Modified Ashworth Scale (MAS) and also evaluated with Modified Tardieu Scale (MTS) scoring system. The MTS scored the passive range of motion resistance and clonus in two levels of velocity: R1 (stretch) and R2 (sustained stretch). The velocity-dependent range of motion, R1 and R2 were recorded together. The value of the spasticity of the paretic-side ankle plantarflexor ranged between 0-2 in MAS and 0-3 in MTS. The muscle strength on the paretic side tested by the Manual Muscle Test (MMT), and the Brunnstrom stage of the subjects were recorded in Table 3.2.
Table 3. 1 General physical data of the subjects.
Subject with CVA
Gender (F;M)
Age (year)
Duration of post-onset
(month)
Height (cm)
Weight (kg)
Paretic side
1 M 59 17 158 62 R
2 F 58 33 152 47 L
3 M 55 45 175 75 L
4 M 70 150 169 83 R
5 F 47 75 153 55 L
6 M 60 30 165 60 L
7 F 38 8 157 47 L
8 M 50 8 168 65 R
9 F 37 19 160 61 R
Mean 5M/3F 52.67 42.78 161.89 61.67 5L/3R
SD 10.77 45.34 7.82 11.84
Table 3. 2 Physical assessment of the subjects.
Muscle strength on paretic side (Tested by Manual Muscle Test) Subject with
CVA
Spasticity score (MAS /MTS)
R1/R2* Brunnstrom Stage
Hip flexor
Hip ABd
Hip ADd
Knee extensor
Knee flexor
Ankle DF Ankle PF
1 2 / 2 -15/0 IV 4 3 3 3 4 2 2
2 0 / 0 - V 4 3 3 4 5 0 0
3 2 / 2 -10/5 IV 3 4 4 4 4 3 3
4 0 / 0 - V 3 3 3 3 4 0 0
5 2 / 2 -5/-5 IV 3 3 3 3 2 0 0
6 2 / 2 -5/-4 V 4 4 3 4 4 2 2
7 2 / 2 -5/0 IV 4 3 3 4 4 2 3
8 2 / 3 -5/0 III 3 4 4 4 4 0 4
9 1 / 1 0/5 V 3 3 3 3 3 2 2
Mean 3 3 3 4 4 1 2
SD 0.53 0.50 0.44 0.53 0.83 1.20 1.48
R1/R2*: Represented ankle range of motion. PF ROM is (-); DF RM is (+). ABd represented abductor; ADd represented adductor; DF represented dorsiflexor; PF represented plantarflexor.
3.2 Gait performance
3.2.1 Spatio-temporal parameters
The means and standard deviations of walking speed (m/s), cadence (step/min), step length (m), step width (m), and stance phase duration (%) of the paretic side for three conditions were shown in Table 3.2. Walking speed ranged from 0.20 to 0.59 m/s, 0.26 to 0.64 m/s, and 0.23 to 0.58 m/s in SHOE, SAFO, and TOEOFF condition respectively. Both interventions of solid ankle AFO (p<0.05) and ToeOFF AFO (p<0.05) improved the walking speed significantly. The cadence also improved by both AFOs, but did not reach a significant level. Two aspects of step length were analyzed: paretic lead and non paretic lead. The paretic lead step length in the ToeOFF AFO improved, but decreased with solid ankle AFO. Non paretic lead step length improved in both AFOs, but only achieved significant level in solid ankle AFO (p<0.05).
The step width was decreased by both type of AFOs intervention but no significance level established. Comparing the stance phase duration of paretic and non paretic side, the percentage of toe-off was extended on non paretic side in all 3 conditions. The step length and the stance phase duration were also evaluated according to the asymmetry ratio, and also summarized in Table3.2. Symmetry of stance phase duration improved with both AFOs while reduced in step length, but both of the asymmetry ratios did not reach significance level.
The durations of single and double limb support were highlighted in Figure 3.1 and 3.2. Limb support duration was different from paretic side and non paretic side. The proportion of single limb support duration on non paretic side was longer than paretic side.
Table 3. 3 The spatio-temporal parameters of the subjects.
Mean (SD)
SHOE SAFO TOEOFF
Walking speed (m/s) 0.35 (0.12) 0.42 (0.12)* 0.40 (0.11)*
Cadence (step/min) 69.79 (13.26) 74.80 (11.75) 73.20 (13.25) Gait cycle duration (s) 1.78 (0.35) 1.64 (0.24) 1.69 (0.32) Paretic lead
Step length (m)
0.32 (0.05) 0.32 (0.06) 0.33 (0.06) Non paretic lead
Step length (m)
0.28 (0.08) 0.35 (0.13)* 0.31 (0.10) Stride length (m) 0.59 (0.12) 0.68 (0.13) 0.65 (0.12) Step width (m) 0.15 (0.05) 0.13 (0.03) 0.14 (0.04) Stance phase duration (%)
Paretic side Non paretic side
58.89 (9.07) 75.80 (5.97)
62.41 (4.88) 74.19 (4.39)
62.98 (6.18) 74.74 (6.25) Asymmetry ratio of
step length 0.18 (0.15) 0.40 (0.54) 0.28 (0.39) Asymmetry ratio of stance
phase duration 0.22 (0.14) 0.16 (0.09) 0.15 (0.12) SHOE, no AFO; SAFO, solid ankle AFO; TOEOFF, ToeOFF AFO.
*.(p<0.05)
Paretic Limb Support Duration
20 18 19
21 24 24
18 20
20
41 38
37
0% 20% 40% 60% 80% 100%
1 2 3
Gait Cycle (%) DS SS DS Swing
Figure 3.1 Paretic limb support duration in (1) SHOE condition; (2) SAFO condition; (3) TOEOFF condition.
Non Paretic Limb Support Duration
20 20 19
37 35
19 19
18
24 26 25 38
0% 20% 40% 60% 80% 100%
1 2 3
Gait Cycle (%) DS SS DS Swing
Figure 3.2 Paretic limb support duration in (1) SHOE condition; (2) SAFO condition; (3) TOEOFF condition.
3.2.2 Joint kinematics and kinetics
Several specific values during different phases or sub-phases of joint angles, joint moments, and joint powers in ankle, knee, and hip joint were summarized in Table 3.3.
Solid ankle AFO and the ToeOFF AFO reduced the plantarflexion at initial contact compared with SHOE condition (Figure 3.2). Total ankle joint excursion angle (maximal DF in stance (°) - maximal PF in stance (°)) was lowest in solid ankle AFO.
The maximal power generation in pre-swing was improved by ToeOFF AFO but revealed not statistically significant (Figure 3.3). In subjects of all 3 conditions, the knee flexion at initial contact revealed relatively high than normal range . Knee power generation in stance was distinct from TOEOFF condition and SHOE as well as SAFO condition. The timing of maximal knee power generation in stance was delayed in TOEOFF condition compared to the others (Figure 3.4). The hip power in stance phase was shown in different way with TOEOFF condition, which absorption power during mid-stance revealed in generation pattern (Figure 3.5). Comparison of 3 conditions in sagittal plane motion was shown in Figure 3.6 for paretic side and Figure 3.7 for non paretic side respectively.
Table 3. 4 Mean of specific values at different phases or sub-phases.
Conditions Description of parameters
SHOE SAFO TOEOFF
Ankle joint
Angle at initial contact ( °) -7.12 1.02 -1.02
Maximal DF in stance ( °) 5.15 2.63 7.10
Maximal PF in stance ( °) 7.20 -0.39 2.36
Maximal PF moment in stance
phase (Nm/kg) 0.47 0.56 1.04
Maximal power absorption in
loading response (A1) (W/kg) 0.27 0.12 0.45
Maximal power generation in
pre-swing (A2) (W/kg) 0.11 0.05 0.32
Knee joint
Angle at initial contact ( °) 11.80 13.75 14.01
Maximal Ext in stance ( °) 5.26 4.30 4.41
Maximal Flex in swing ( °) 35.59 36.45 38.75 Maximal flexion moment in
stance (Nm/kg) 0.22 0.14 0.46
Maximal extension moment in
stance (Nm/kg) 0.17 0.05 0.02
Maximal power generation in
stance (W/kg) 0.02 0.03 0.12
Maximal power absorption in
stance (W/kg) 0.08 0.08 0.07
Hip joint
Angle at initial contact ( °) 24.46 32.23 30.08 Maximal Ext in stance ( °) 9.22 10.94 8.45
Maximal Flex in swing ( °) 31.03 35.05 34.83 Maximal extension moment in
stance (Nm/kg) 0.37 0.61 0.69
Maximal flexion moment in
stance (Nm/kg) 0.23 0.25 0.12
Maximal power generation in
stance (H1) (W/kg) 0.08 0.12 0.13
Maximal power absorption in
stance (H2) (W/kg) 0.03 0.03 -0.06
Maximal power generation at
pre-swing/toe-off (H3) (W/kg) 0.06 0.07 0.03
0 20 40 60 80 100 0
10 20 30 40
Hip Flexion Angle
Joint Angle(Degree)
0 20 40 60 80 100
0 10 20 30 40
Knee Flexion Angle
0 20 40 60 80 100
-10 -5 0 5 10 15
Ankle DF Angle
0 20 40 60 80 100
-0.5 0 0.5 1
Hip Extension Moment
Joint Moment(N*m)
0 20 40 60 80 100
-0.6 -0.4 -0.2 0 0.2
Knee Extension Moment
0 20 40 60 80 100
-0.5 0 0.5 1 1.5
Ankle PF Moment
0 20 40 60 80 100
-0.05 0 0.05 0.1 0.15
Hip Sagittal Power
Gait cycle (%)
Joint Power(W/kg)
0 20 40 60 80 100
-0.1 -0.05 0 0.05 0.1 0.15
Knee Sagittal Power
Gait cycle (%)
0 20 40 60 80 100
-0.2 -0.1 0 0.1 0.2
Ankle Sagittal Power
Gait cycle (%) SHOE
SAFO TOEOFF
Figure 3.3 Comparison of 3 conditions in sagittal plane motion for paretic side.
0 20 40 60 80 100 0
10 20 30 40 50
Hip Flexion Angle
Joint Angle(Degree)
0 20 40 60 80 100
0 20 40 60 80
Knee Flexion Angle
0 20 40 60 80 100
-5 0 5 10 15 20
Ankle DF Angle
0 20 40 60 80 100
-1 -0.5 0 0.5 1
Hip Extension Moment
Joint Moment(N*m)
0 20 40 60 80 100
-0.2 0 0.2 0.4 0.6
Knee Extension Moment
0 20 40 60 80 100
-0.2 0 0.2 0.4 0.6 0.8
Ankle PF Moment
0 20 40 60 80 100
-0.1 0 0.1 0.2 0.3
Hip Sagittal Power
Gait cycle (%)
Joint Power(W/kg)
0 20 40 60 80 100
-0.3 -0.2 -0.1 0 0.1 0.2
Knee Sagittal Power
Gait cycle (%)
0 20 40 60 80 100
-0.2 -0.1 0 0.1 0.2
Ankle Sagittal Power
Gait cycle (%) SHOE
SAFO TOEOFF
Figure 3.4 Comparison of 3 conditions in sagittal plane motion for non paretic side.
3.2.3 Ankle-foot roll-over shape
The ankle-foot roll-over shape of one of the subjects was showed in the Figure 3.7-3.9. The arc length (cm) of ankle-foot roll-over shape in TOEOFF condition revealed significantly prolonged than SHOE and SAFO conditions, but only significantly longer than SHOE condition when normalized the arc length by foot length (p<0.05). The tibia and COP progression in the sagittal plane indicated the foot position at the initial contact and its contact pattern. In SHOE condition, the first COP contact point fell in front of the tibia, while it fell behind with both types of AFOs.
The radius of ankle-foot roll-over shape which was normalized by leg length was significantly prolonged with both AFO interventions (p<0.05).
Table 3. 5 The ankle-foot roll-over shape analysis of the Drop foot group.
Conditions Description of parameters
SHOE SAFO TOEOFF
Radius length (% of leg length) 0.47 (0.22) 4.21 (0.53) 1.55 (0.39) Arc length (% of foot length) 0.45 (0.16) 0.83 (0.14) 1.00 (0.34)
-50 -40 -30 -20 -10 0 10 20 30 40 50 -20
-10 0 10 20 30 40 50
← Arc Origin (0.5 , 24.8)
← Ant. Tip (15.0 , 2.3)
↑ Pos. Tip (0.9 , -2.0)
← AJC (0,0)
← KJC (0,38.7)
← Radius: 26.9 Roll-over Shape in Sagittal Plane
A-P Direction [cm]
Verticle Direction [cm]
Figure 3.5 Ankle-foot roll-over shape of one of subjects in SHOE condition.
-50 -40 -30 -20 -10 0 10 20 30 40 50
-20 -10 0 10 20 30 40 50
← Ant. Tip (11.5 , -7.7)
↑ Pos. Tip (-9.5 , -8.2)
← AJC (0,0)
← KJC (0,36.5)
← Radius: 109.4 Roll-over Shape in Sagittal Plane
A-P Direction [cm]
Verticle Direction [cm]
Figure 3.6 Ankle-foot roll-over shape of one of subjects in SAFO condition.
-50 -40 -30 -20 -10 0 10 20 30 40 50 -20
-10 0 10 20 30 40 50
← Arc Origin (3.7 , 42.1)
← Ant. Tip (18.7 , -5.8)
↑ Pos. Tip (-7.1 , -6.9)
← AJC (0,0)
← KJC (0,36.7)
← Radius: 50.2 Roll-over Shape in Sagittal Plane
A-P Direction [cm]
Verticle Direction [cm]
Figure 3.7 Ankle-foot roll-over shape of one of subjects in TOEOFF condition.
3.2.3 Energy expenditure
Oxygen consumption was slightly increased with both AFOs intervention, but revealed no significance. The energy cost was reduced by ToeOFF AFO but did not
achieve the statistical significant level (Table 3.4).
Table 3. 6 Means and SDs for energy expenditure of the subjects Conditions Subjects with CVA
SHOE SAFO TOEOFF
Oxygen consumption
(VO2/kg/min) 5.54(1.61) 5.62(2.63) 5.85(2.12)
Energy Cost
[VO2/kg/min/Velocity (m/s)] 17.35(7.31) 17.51(8.19) 15.27(6.51)
Chapter 4 Discussion
This study investigated the effectiveness of ToeOFF AFO in hemiplegic gait in CVA patients with ankle paralysis problem, and compared it with the conventional custom-made solid ankle AFO (SAFO).
4.1 Effectiveness of the ToeOFF AFO on gait for CVA subjects
Spatial and Temporal parameters
Results of this study indicated improvements on gait performance with intervention of the ToeOFF AFO. Our results consisted with previous studies that the walking speed, step length, and cadence improved with the ToeOFF AFO in this study.
Nevertheless, only the walking speed reached a significant level. The average walking speed reported for CVA patients was lower than the able-bodied subjects, which based on the severity of the CVA and the post-onset duration. Among those influencing factors, ankle impairment on gait performance was the major resultant of decreased walking speed for CVA patients (Lin, 2006), which indicated that adequate ankle control during gait was important for improving gait patterns. The step length improvement of CVA patients was also relative to the functional leg length. The ToeOFF AFO reduced excessive plantarflexion during swing phase, which also reduced the lower limb length while moving forward. However, the reason why the improvements of step length and cadence did not show statistical significance could be
considered of the small sample size of subjects. Furthermore, the recruitment of ankle paralysis CVA patients in this study was not easy. Many factors might have contributed to the variability between subjects including the muscle strength, spasticity, and the adaptation ability of the AFOs.
4.2 Comparison of the ToeOFF AFO and Solid ankle AFO
The majority of the hemiplegic CVA patients in this study derived the positive benefits from both the ToeOFF AFO and SAFO; however, there were still some differences between these two configurations of AFOs.
In this study, the push-off power generated in terminal stance of ToeOFF AFO was dominantly greater than the SAFO. According to the manufacturer, the biomechanical properties of the ToeOFF AFO were aimed to enable to help propel the limb at terminal stance with the spring-like energy restore function. Rettig et al. (2003) reported that the spring-like function stored energy with increasing dorsiflexion through spring tension, and then this energy was used at the end of stance phase for push-off. The spring-like function of the ToeOFF AFO seemed to have a positive effect on walking function in this study consistent with their reported subjects. Whether the spring element stored energy during tibial advancement and returned it during pre-swing was not measured directly in this study. But compared to the SAFO, flexibility of the ToeOFF AFO was greater to allow more range of ankle motion because of the trimline