國立臺灣大學理學院海洋研究所 碩士論文
Institute of Oceanography College of Science
National Taiwan University Master Thesis
北台灣底棲群聚與環境因子間的關聯
Environmental factors determining benthic communities in northern Taiwan
蕭菀謙 Wan-Chien Hsiao
指導教授:單偉彌 博士 Advisor: Vianney Denis, Ph.D.
中華民國 109 年 6 月 June, 2020
致謝
回首這兩年來在海研所的日子, 初次踏入所上那天的回憶還歷歷在目, 如今也到了快要畢業 的時候了。首先要特別感謝我的指導老師單偉彌 (Vianney Denis), 在這兩年碩士期間不管是在學業 上、研究上、或是生活上都給予我非常大的幫助以及歡樂,也在最後論文修改階段不厭其煩地幫助 我,是我能夠順利的度過兩年碩士時光的最大功臣。也非常感謝實驗室的夥伴們,謝謝妍莉姐幫我們 處理繁雜的行政手續跟接洽廠商; 謝謝 Vicky 不管在野外出差還是實驗分析上都非常的照顧和幫助 我; 謝謝已經畢業的學長 Eric 和 Bill 以及正在當兵的學弟 Tony 支援我的出差跟解決我一些實驗上 的困難; 也謝謝學妹 Mariana 和 Joyce 為實驗室注入新鮮的活力, 帶給我們辛苦的碩二生活很多的歡 樂; 特別感謝我的好同學 Angel 在這兩年來成為我無話不談、一起前進的好夥伴, 讓我的碩士生活 特別的繽紛,充滿了樂趣。.
另外特別感謝那些在實驗中幫助過我的 Tina 老師、旭明姐、美臻學姐、堯禮學姐和韻如, 也謝謝潛水時幫助我的花花、豬豬、石花菜和坤龍教練, 讓我安全且順利的完成了野外實驗。謝謝 婷宇和文君常常和我交談並開導我成為我情感上重要的支持,也謝謝育敬、和冠言以及我在台北的 好友們對我不管是實驗上或是生活上的支持。謝謝我的口試委員戴昌鳳教授、樊同雲教授、野澤 洋耕 (Yoko Nozawa)研究員、以及林卉婷教授對我的研究進行批判並給予了我很多改進的建議。非 常感謝大家在這兩年以來對我的幫助,如果沒有你們,我的實驗肯定沒有辦法順利完成。這兩年來在 海研所學到的,不管是研究上的知識、潛水的技能、還是人生的道理, 我都會謹記在心並好好珍惜。
最後的最後, 特別感謝我的爸媽和家人以及冠毅在我背後默默的支持我, 謝謝你們總是無條 件接受並支持我做的決定,雖然做研究的路還很長,前方的路也仍是未知,但我一定會盡最大的努力 不辜負你們對我的期望 !
Abstract
On a global scale, human activities and their effects on climate jeopardized the future of tropical reef ecosystems. On a regional scale, sensitivity difference could exist among communities that may originate from how they are locally shaped by environmental conditions. However, despite the possible importance of these abiotic factors, relatively few studies have focused on how they could influence benthic communities on a small spatial scale.
Here, I propose to uncover the determinism of marine coastal benthic communities by a detailed investigation of their response to small-scale modification of the environmental conditions including physical, chemical, and geological factors. At ten locations (confounding site and depth) in Northern Taiwan (NT), benthic communities were delineated using a morpho-functional classification of the organisms observed on photo-transects. k-means clustering was used to identify k homogenous groups among transects assuming it can ascertain the diversity of communities present. Their environmental determinism was later examined by combining this result with 16 environmental variables of transect conditions into a regression tree (RT) framework.
Biotic and abiotic information were further analyzed with a Multivariate Regression Tree (MRT) to figure out the hierarchical environmental determinism. The classifications produced by both approach were compared using the Adjusted Rand index (ARI) to assess the predictive power of unsupervised clustering (UC) on its missing explanatory components (abiotic variables).
Crustose coralline algae (CCA) was dominant in NT and represented consistently about half of the benthic cover. Other morpho-functional categories presented high deviation across NT suggesting various cover among locations. Both MRT and k-means produce 5 communities with a similarity of 0.82 in ARI. Chemical factors in this study were quite unanimous and did not stand out as determinism while wave motion followed by substrate type resolves most of the variance.
The high value in ARI and comparable structure between MRT and RT concluded that the community itself may inform us of the environmental conditions it is thriving in.
A greater consideration of these different communities and their environmental context is important to determine their trajectories under global change. Expansion of our analytical work will have implications with further potential ramifications on their dynamics.
Key words : Benthic community, Environmental determinism, Abiotic factors, Unsupervised clustering, Supervised clustering, Ecosystems
中文摘要
全球環境尺度下,人為活動及氣候變遷對熱帶珊瑚礁生態系的未來造成莫大的影響。區 域環境尺度下,周遭環境使得不同群聚間存在些微的差異,因此對於環境的改變也有不同的 靈敏度。儘管非生物性環境因子對於這些群聚有重要意義, 但先前的研究多著重於相變而 忽略了環境因子在小尺度範圍下的影響。
本研究目的為探討不同底棲群聚與其對應的環境條件(如:物理、化學、及地質因子)之 間的關係,並探討群聚組成會受哪些決定性環境因子影響。實驗地點為台灣東北角10個樣 點(5個地點X 2個深度)以形態功能群(morpho-functional group)為區分方式進行底棲群聚調 查及周遭環境因子資料蒐集。藉由兩種方法,(1)非監督式k均質集群分析(Unsupervised k- means clustering) 和 (2)監督式多變項回歸樹分析 (Supervised Multivariate Regression Tree, MRT)探討決定性環境因子與底棲群聚之間的關聯,並比較兩種方法的差異性和檢驗非監 督式k均質集群分析對於環境因子的預測力是否準確 。
研究結果顯示殼狀珊瑚藻 (Crustose coralline algae, CCA) 在本研究實驗地點中有約一半 的覆蓋率,為東北角相對優勢的形態功能群。其他形態功能群在實驗地點間擁有較大的標 準差, 表示在各個樣點有不同的覆蓋率。化學因子在深度以及地點間並無明顯的差異,波 浪(wave motion)強度及底質的不同在兩種分析方法中解釋了大部分的群聚差異,可視為東 北角的決定性環境因子。MRT 和 k-means 的分群結果獲得0.82的調整蘭德指數 (Adjusted Rand Index),顯示兩種分析方法所獲得的結果有高度的相似性,也間接證實了非監督式學習 方法對於相對應環境因子的高度預測能力。本研究所獲得的結論除了能夠評估未來群聚潛 在的動態變化之外, 也可以對海洋沿岸底棲群聚的保育及管理有所幫助。
關鍵字 : 底棲群聚, 環境因子, 非監督式學習, 監督式學習,生態系
Contents
論文口試委員審定書 ... i
致謝... ii
Abstract ... iii
中文摘要... v
Contents ... vi
Introduction ... 1
Materials and Methods ... 4
Study locations ... 4
Benthic surveys ... 5
Abiotic surveys ... 6
Data analysis ... 8
Results ... 11
Discussion... 14
References ... 20
List of figures ... 28
List of tables... 36
Supplementary information ... 41
Introduction
Climate change has risen as an ubiquitous threat to the marine ecosystems, thus reconfiguring marine benthic communities globally (Field 2014; Hughes et al. 2017). In coral reefs, variances in taxonomy and functions in the communities characterize their biogeographical differences along environmental gradients such as latitudes and depths (Lesser et al. 2019). Tropical coral reef communities are typically dominated by scleractinian corals (Bellwood and Hughes 2001; Wild et al. 2011) which become scarce at higher latitudes where macroalgae abundance increases (Crossland and Smith 1983; Hoey et al. 2011).
Deeper communities typify mesophotic coral ecosystems in the tropics that see an increase of the contribution of octocorals and sponges at greater depths (Bridge et al. 2012; Kahng et al. 2014). A few specialists can often typify these communities (Rooney et al. 2010; Williams et al. 2013) in which the diversity will commonly increase with a complexification of the benthic habitat (Kostylev et al. 2005; Darling et al. 2012). In this context, the nature and morphology of the benthic organisms are often seen as of critical importance in conditioning community dynamics at a global scale. However, at smaller spatial scale, communities can also be differentiated based on their distinctive and location-specific composition that may also have implication in the various response observed (Lesser et al. 2019).
Many ecological studies on coral reefs have focused on the alteration of their benthic communities and their shifts towards alternative states. Yet only a few has examined the implications of initial differences in the dynamics observed, possibly overlooking that various trajectories may exist according to the original composition (Done 1992; McManus and Polsenberg 2004; Hoegh-Guldberg et al. 2017). These subtle nuances could be explained
by biotic interactions (e.g. competition, predation, …) along with historical disturbances (Typhoon, storms, bleaching) (McCook et al. 2001; Van Woesik et al. 2011) and importantly, local abiotic factors.
Abiotic factors are paramount in the spatial and temporal variations observed in local benthic communities (Done 2011; Bauman et al. 2013). They can be grouped according to their acting scale and their type i.e. physical, chemical, and geological factors.
Hydrodynamics is for example well known to constrain the distribution of scleractinian corals (Lowe and Falter 2015; Sheppard et al. 2017), but is often overlooked because of the difficulties to measure it on the field and their wide arrays of influences (currents, eddies, tides, waves). Salinity at both extremes can cause oxidative stress for macroalgae and low salinity concentration (26 – 28‰) may decrease gamete’s fertilization success for certain coral species (Luo and Liu 2011; Hédouin et al. 2015). Nutrient and carbon chemistries affect community composition by altering primary production and/or regulating the calcification of some reef organisms (McManus and Polsenberg 2004; Lantz et al. 2014; Takeshita et al.
2018). Sedimentation causes smothering of benthic organisms (Bessell-Browne et al. 2017;
Pineda et al. 2017) and turbidity decrease light available for photosynthesis (Anthony and Connolly 2004). The availability in hard substrate strongly controls the distribution of sessile organisms, resulting in vast areas not suitable for organisms such as scleractinian corals to grow (Connell et al. 2004; Chadwick and Morrow 2011). Abiotic factors act in synergy together with biotic factors and historical events at any given location. This results in the possibility of a juxtaposition of communities on a relatively small spatial scale (Matheus et al. 2019).
In Taiwan (21.90°N to 25.30°N), light and temperature are responsible for a variety of communities observed along latitudinal and depth gradients (Lin and Denis 2019) reflecting its position at the convergence of several marine ecoregions (Spalding et al. 2017) . At regional scale, it has been hypothesized that a panel of communities could be available and that local factors could have the final say on the benthic communities eventually thriving at finer spatial scale. Benthic composition in northern Taiwan typifies subtropical and marginal communities from mid-latitudes (Perry and Larcombe 2003; Lin and Denis 2019).
The coastline is composed of patchy coral communities where algae abound (Huang 1999;
Ribas-Deulofeu et al. 2016; Lin et al. 2018). Reef accretion is limited by winter sea temperatures and the sharp decline in light availability with depth prevents light-dependent organisms to reach mesophotic depths (Denis et al. 2019). Over the past decade, previous studies have described a variety of benthic assemblages (Dai et al. 2002; Dai 2011; Ho and Dai 2014; Ribas-Deulofeu et al. 2016; Denis et al. 2019; Lin and Denis 2019), which makes this region particularly suitable to unearth the determinism of benthic communities (Dai 2011;
Denis et al. 2019).
In this study, benthic communities were scrutinized for their environmental determinism. The specific objectives of this study were to: (1) depict the diversity of benthic communities and their morpho-functional composition in northern Taiwan; (2) characterize the environmental determinism of those communities; (3) assess the predictive power of those communities in evaluating environmental conditions. The results of this study will further provide factual elements to improve the management and conservation of coastal communities in northern Taiwan.
Materials and Methods
Study locations
Five stations (Longdong, Bitou, Chaojing, Shenao, and Meiyenshan) and two depths (-5 m and -15 m) were selected as the targets of our surveys (Figure 1). A location is defined here as a combination of station and depth. Longdong (121.919722°E, 25.113227°N) is located between Bitou cape and Longdong cape within the Longdong bay. The topography consists of a gentle slope from the surface to 5 meters in depth followed by a steep decline down to 20 m in depth after which sand dominates. Scleractinian can reach as high as 40%
of the benthic over (Dai 2011). Bitou (121.9146°E, 25.1257°N) is positioned on the western side of a cape formed by wave erosion (Wang et al. 2014). It is located in the marine resources protected area ranged from Bitou cape to Santiago cape enforced by the Tourism Bureau.
Previous records suggest that substrate above 10 m in depth are mostly composed of massive boulders; below are consolidated slopes that extend to approximately 20 m in depth where it reaches a sandy bottom in the near coastal area (Dai 2011). The scleractinians represent approximately 25% of benthic cover (Dai 2011). Chaojing (121.804582°E, 25.144553°N) is stationed on the east side of the Badouzi Peninsula. It is located inside the no-take Chaojing bay conservation area enforced by the Keelung City government (Chen and Yeh 2018).
Abundant barrel sponge, octocorals and >100 scleractinian species were previously recorded here with a hard coral covering at certain areas > 70% of the substrate (Dai 2011; Chen 2014).
Shenao (121.819882°E, 25.13498°N) is next to a fishing port along a cape exposed to high erosion by currents. Scleractinian corals composed around 20% of the benthic cover.
Erosional debris of various sizes characterize these locations, and strong currents were
hypothesized to promote the growth of fan-shaped octocorals (Fabricius and Alderslade 2001;
Wang et al. 2014). Meiyenshan (121.924454°E, 25.070714°N) is located right downhill a mountain and ridges that extended into the sea served as the main substrate for the growth of sessile organisms. Further away from the shore and down to 15 m in depth, hard substrate colonized by various benthic organisms punctuated sandy bottom. Only a few scientific information exists on the benthic composition there, but recreational divers reported a very high abundance of sea urchins.
Benthic surveys
Benthic surveys were conducted in May-July, 2019 by collecting photographs (50 x 50 cm) every meter along a 20-m line transects positioned at constant depth (±1m). This was repeated five times at each location. All surveys were conducted in areas presenting low to moderate slope (< 30) to disregard the possible influence of topography on benthic composition. Substrate availability could result in various composition among transects at a given location (Lin and Denis 2019). Accordingly, individual photographs were considered as our sampling unit and summarize at the transect level in order to allow the possibility for communities to varying at a fine spatial scale. Overall, surveys resulted in 1050 photographs summed up as 50 transects for which composition was scrutinized.
Using the software Coral Point Count with Excel extensions (Kohler and Gill 2006), a five by five grid was delimited on each photograph and one point was randomly positioned within (avoiding pseudo-replication) and organism (constituting the canopy of the benthic assemblages) identified to the most accurate Operational Taxonomic Unit (OTU) putting
aside bare substrates (boulder, rock, rubble, gravel, sand, silt, limestone, and sediment- covered organisms) (Lin & Denis 2019).
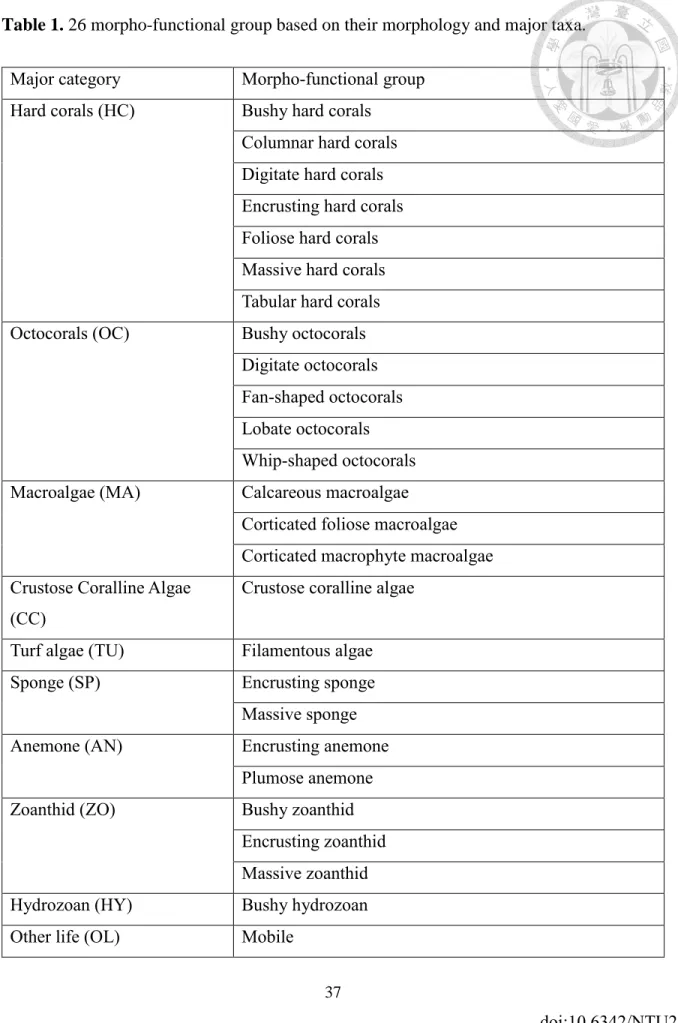
OTUs were categorized into morpho-functional groups (Supplementary information S1) considering their taxonomy and morphology as justified in Lin & Denis (2019) for assessing the role of the benthic communities. As a result, the 131 identified OTUs were summed up into 26 morpho-functional groups. Morpho-functional groups were further aggregated into 10 major categories including hard coral (HC), octocoral (OC), macroalgae (MA) while sub-setting crustose coralline algae (CC) and turf algae (TU), sponge (SP), sea anemone (AN), zoanthid (ZO), hydrozoan (HY) and other life (OL) as used in previous studies with some minor modifications (Ribas-Deulofeu et al. 2016). According to Steneck and Dethier 1994, calcifying CCA were separated as crustose algae from other calcareous algae based on their morphology and anatomical differences. The contribution of different groups was calculated as a percent of the overall biotic assemblages. It resulted in a biotic matrix composed of 50 transects and 26 morpho-functional groups.
Abiotic surveys
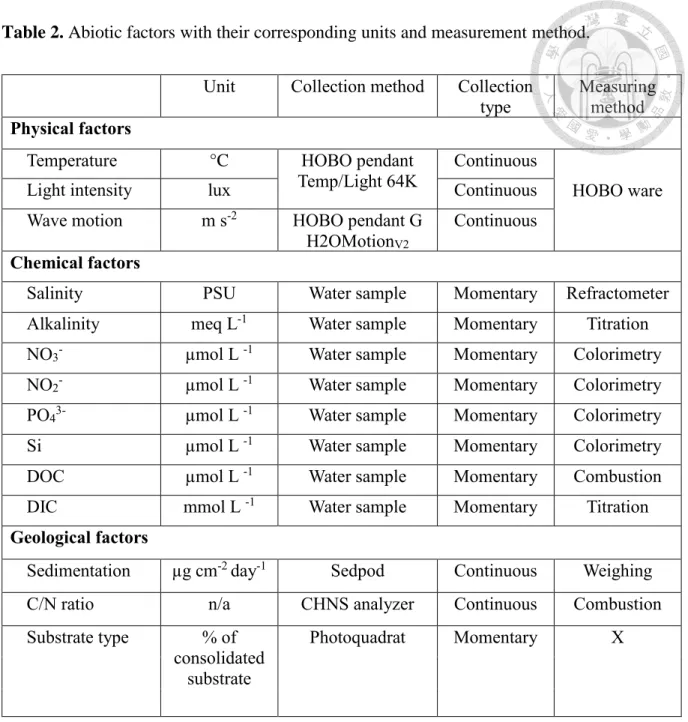
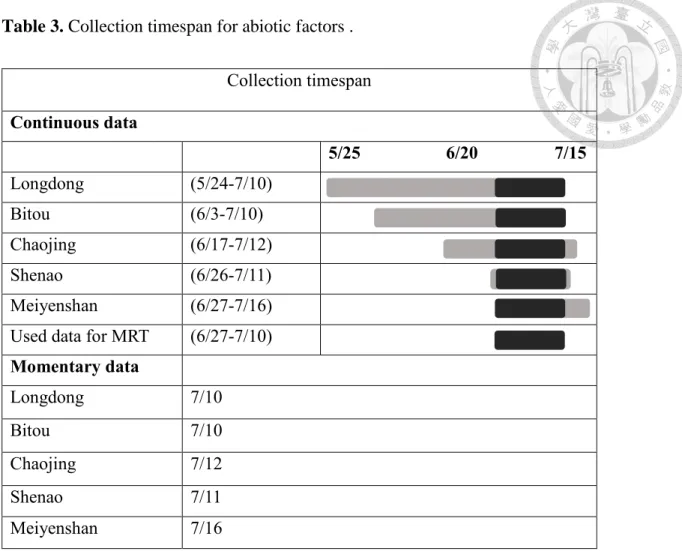
The environment of each individual transect was characterized by a set of physical, chemical, and geological variables (hypothesizing that only the substrate will influence the difference among transects at a given location). For physical factors, continuous records of temperature, light and water motion were measured at each of ten locations to acquire a minimum of two weeks of comparable data (Table 2, 3). Temperature and light loggers (HOBO Pendant Temp/Light, 64K, Onset Computer Corporation, Bourne, MA, USA) were tied to a mooring weight and mounted on the substrate ensuring stable and horizontal position
to avoid possible shadows by nearby relief. Loggers were set to record every 10 min. Water motion was measured using the H2OMotionV2described in(Evans and Abdo 2010) and made from a gravitational data logger (HOBO Pendant G, Onset Computer Corporation, Bourne, MA, USA). Mooring concrete weights were buried in sand to stabilize the whole device and maintain the wagging ability of the upper floating parts following the standard protocol.
Recording intervals were also set at 10 min following original recommendations. For chemical factors, water samples were collected in separate 40 ml glass vials (added with 6N HCl) and 100 ml Teflon bottles (added with HgCl2). This was replicated three times at each location (n=3), and processed as detailed in Supplementary Information S2. Briefly, with HgCl2 preserved water samples, Phosphate (PO43-), Silicate (Si), Nitrate (NO3-), Nitrite (NO2-) were measured by colorimetric method; total alkalinity was measured following an HCl titration method (877 Titrino plus, Metrohm AG,Switzerland); salinity was simply measured with a refractometer; Dissolved Inorganic Carbon (DIC) was measured with an inbuilt system from a Total Organic Carbon Analyzer (TOC-L series, Shimadzu, Japan); Dissolved Organic Carbon (DOC) was measured with the same Carbon Analyzer but from HCl preserved samples. For the geological factors, the sedimentation rate at each location was measured with ‘Sedpods’, a recent developed cost-effective tool for measuring net sedimentation in benthic areas (Field et al. 2012). Three Sedpods were deployed and recovered at each location after two weeks. Sediment on the surface was then washed, freeze-dried, and weighed for further estimation of the sedimentation rate (Supplementary Information S3). A small subset of the sediment collected (~10µg) was used to analyze C/N ratio with a CHNS analyzer (FLASH 2000 Series, Thermo Scientific, USA) in order to determine its oceanic or terrigenous origin (Tanaka et al. 2011). Substrate type was defined as consolidated (rock,
limestone, boulders) or unconsolidated substrates (rubbles, sand, silt, clay, etc.), determined from annotation mentioned earlier. This results in a matrix of 50 transects with 16 abiotic variables.
Data analysis
Morpho-functional matrix was Hellinger transformed to lower the weights of zeros and low counts (Legendre and Gallagher 2001). For abiotic parameters, a total of 16 variables were used in later analysis. Temperature data were analyzed for daily mean, maximum, and minimum. Light was cumulated daily and averaged for the study period. Wave motion was calculated following Evans and Abdo (2010) and averaged from daily measures. For the chemical parameters (PO43-, Si, NO3-, and NO2-), absorbances were converted into concentrations as detailed in Supplementary Information S2 and representative values determined from averaging the three replicates at one given location. Salinity, DOC, DIC and total alkalinity were averaged for the three replicates in the same way. For the geological parameters, sedimentation rate was calculated by dividing the sediment dry weight with the surface area of the Sedpod (176.71cm2) and averaged for replicates following the protocol of (Field et al. 2012). C/N ratios were directly used without pretreatment. The substrate type was determined by photography annotations. Points were considered as consolidated substrate if it is suitable for sessile organisms to settle. Total points were converted into percentage and substrate type presented as % of consolidated substrate for each transect.
Similar to the approach in (Laverick et al. 2017) and Lin & Denis (2019), communities were delineated using an unsupervised learning algorithm k-means clustering
run in a cascade (k = 2 to 10) (MacQueen 1967) to identify k groups among transects. The cascade produces partitions with 1000 iterations, randomly positioning the centroids of clusters. The best partition was evaluated by maximizing the Calinski-Harabasz index (Caliński and Harabasz 1974) and further tested under 9999 permutations (Biondini et al.
1988). Their composition in morpho-functional groups was later visualized using a principal component analysis (PCA) considering the two-first dimensions. The k partitions identified, interpreted later as possible communities, were crossed a posteriori with abiotic variables into a regression tree (RT) (Breiman 1984) to explain their environmental determinism.
A Multivariate Regression Tree (MRT) was further used to integrate biotic and abiotic matrices simultaneously in order to build a hierarchical tree. MRT is a supervised clustering method that predicts and scrutinizes the relationship between multispecies data and their corresponding environmental conditions (De'Ath 2002). MRT is computed by two steps running simultaneously (Borcard et al. 2018), (1) constrained partitioning of the explanatory variable, and (2) cross-validation. A tree is grown by splitting response (biotic) variables in successive dichotomies with selected explanatory (abiotic) variables. The optimal size of the tree is determined by minimizing Cross-Validation Relative Error (CVRE) which is considered to represent the most accurate predictions when the value approaches 0 (Breiman 1984).
Representative morpho-functional groups for each community delineated by RT and MRT were identified using the Dufrene and Legendre’s ‘species’ indicator (Dufrêne and Legendre 1997). A morpho-functional group is considered as an indicator group when it is present in most of the transects representative of a community and absent from the others (Dufrêne and Legendre 1997).
In order to assess the predictive power of Unsupervised Clustering (UC) on the missing explanatory components (abiotic variables) that Supervised Clustering (SC) utilizes.
Classifications produced by both the RT and MRT were put in parallel using the Adjusted Rand Index (ARI). ARI accounts for possible random clustering effects that normal rand index would neglect, and act as a measure to determine the similarity between two data clusterings (Hubert and Arabie 1985)
All data analyses were carried out in R v 3.6.1 (R Core Team 2020) with the help of the packages Vegan (Oksanen et al.), mvpart (De’Ath 2007), MVPARTwrap (Ouellette and Legendre 2013), stats (R core Team 2020), factoextra (Kassambara and Mundt 2017), and Labdsv(Roberts 2007).
Results
Crustose coralline algae (CCA) was dominant in NT and represented consistently about half of the benthic cover (48.2±15.9%); encrusting hard coral was the second most abundant morpho-functional group with 10.7±8.9% followed by corticated macrophyte macroalgae (8.8±14.3%); filamentous turf algae (7.8±7.0%); and corticated foliose macroalgae (6.0±13.9%).
Abiotic data from Longdong were incomplete due to loggers stolen and Sedpods destroyed at both locations. Maximum, minimum, and average temperature ranged between 28.3 – 29.7°C, 19.9 – 25.7°C, and 26.9 – 27.9°C, respectively; wave motion ranged from 0.09 to 0.19 m s-2. Average daily cumulated light ranged between 7211 – 389749 lux. For the chemical measurements, Si ranged between 2.31 – 3.26 µM; PO43- between 0.05 – 0.25 µM; NO3- between 0.26 – 1.51 µM; NO2- between 0.10 – 0.18 µM; DIC between 1.92 – 2.04 mM; DOC ranged between 71.17 – 119.91 µM; salinity between 32 – 33.5‰; alkalinity between 2.23 – 2.26 meq L -1; and the contribution of consolidated substrate varied from 23 to 99%
while presenting considerable variation among transect at a given location. Eventually, the sedimentation rates within the study period ranged between 2.7 – 35.4 (mg cm-2 day-1) and the C/N ratios ranged from 13.9 to 23.0. All recorded abiotic variables are listed in (supplementary information S5).
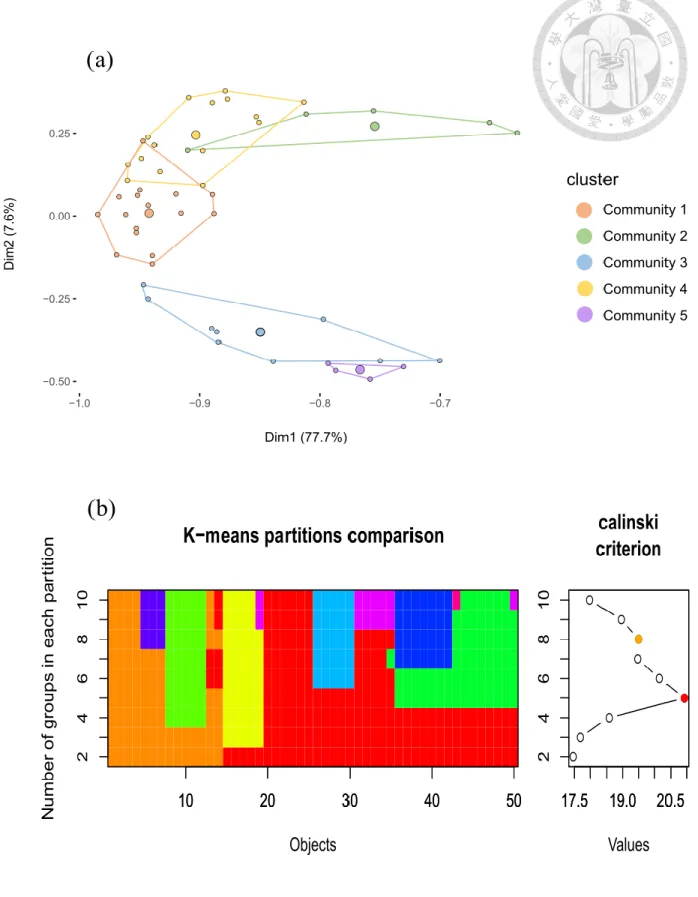
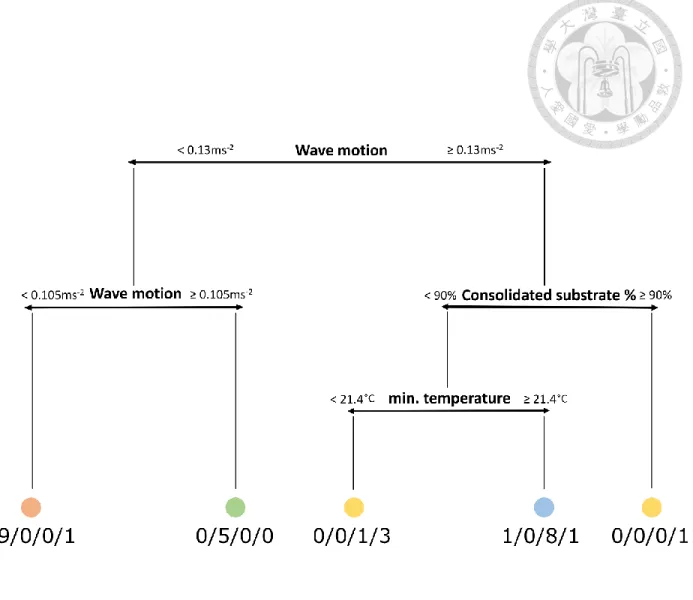
The k-means analysis and the Calinski criterion differentiated 5 well-supported (p<0.005) partitions (defined as communities) among our 50 transects (Figure 2a). The PCA showed clear discrimination between communities with a relatively low overlap among them (Figure 2b). Interpret a posteriori together with the environmental variables, RT (Figure 3)
identified the critical wave motion value of 0.130 m s-2 as a major differentiation of the communities identified by k-means. It was followed by the critical value of 90% of consolidated substrate and the minimum temperature of 21.4°C.
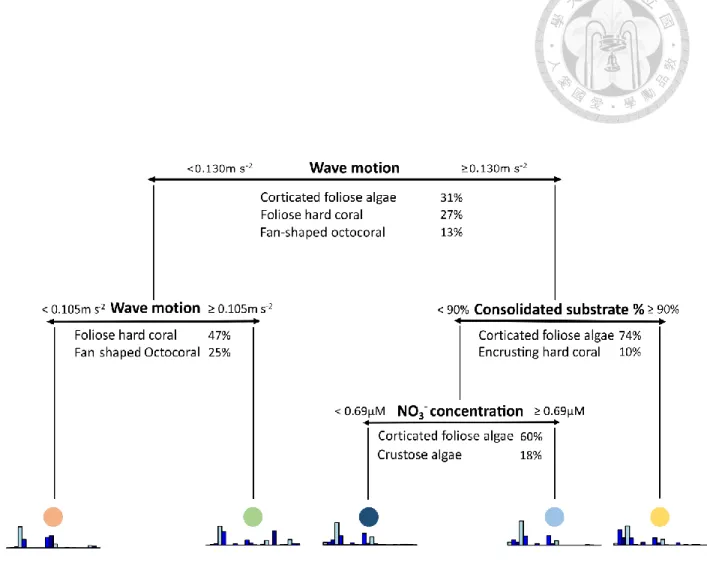
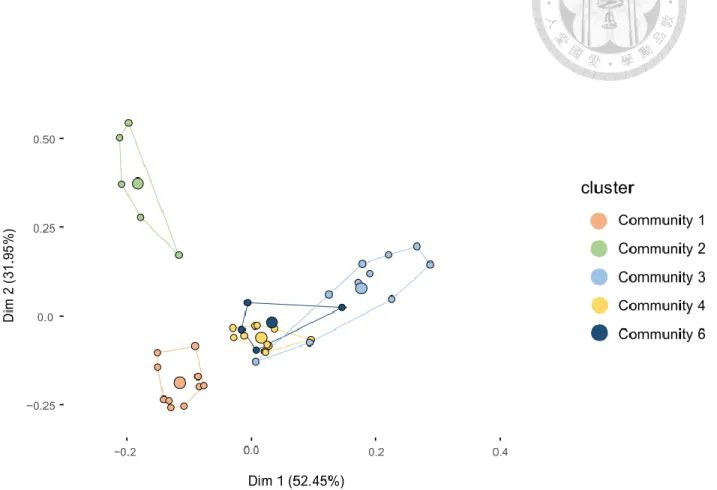
MRT analysis also identified five distinct communities among the 40 transects (excluding Longdong’s data) differentiated by three abiotic parameters (Figure 4). Results from the MRT explained 58.2% of the total variance. Resulting communities visualized on a PCA showed three well-separated groups, but with two communities overlapping (Figure 5).
The first two axes of the PCA resolves up to 84% of the total variance explained by MRT.
The critical wave motion value of 0.130 m s-2 was again the first to split our communities. It further differentiates two communities based on the critical value of 0.105 m s-2. An additional node separated a community based on the critical value of 90 % of consolidated substrate. Eventually, the last split observed occurred at 0.69 µM of NO3- .
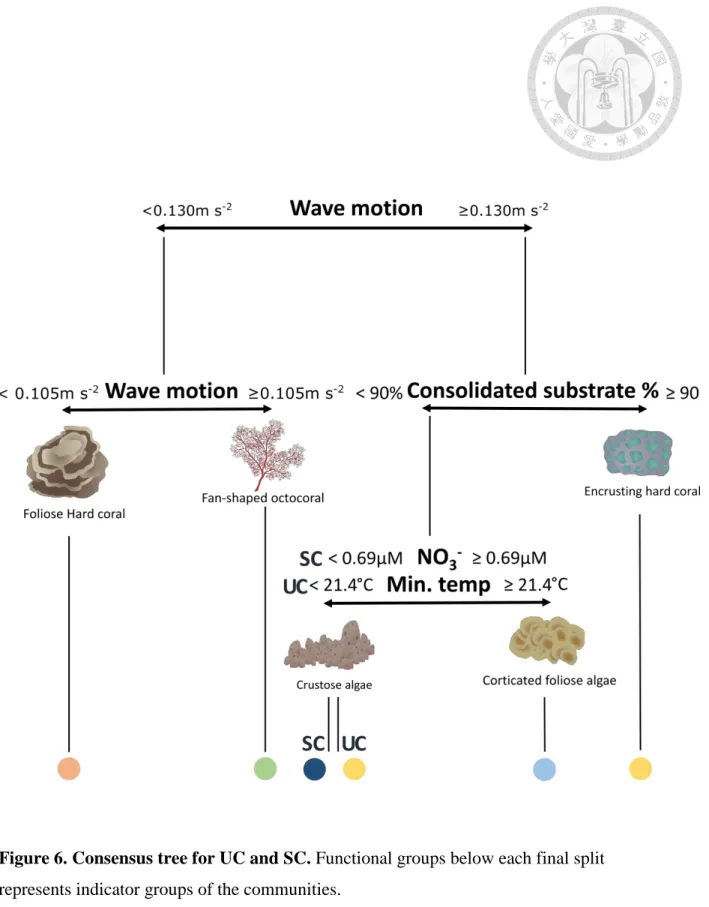
Both tree structure from the SC and UC approaches and the delineation of communities yielded similar results. ARI reached 0.82 between SC and UC suggesting a very high similarity between classifications from the two approaches (Table 4).
Community 1 was characterized by its comparably high coverage of foliose hard coral (22.3% for UC and 19.5% for SC). Community 2 has a unique composition with over one- fifth of its cover comprised of fan-shaped octocorals (23.9% for both UC and SC).
Community 3 is characterized by a high abundance of corticated foliose macroalgae (29.2%
for UC and 26.3% for SC). Community 4 is characterized by its comparably high coverage of encrusting hard coral (13.9% for UC and 14.7% for SC ) and the presence of tabular coral (0.2% for UC and 0.3% for SC). Community 5 is only yielded in k-means and restricted to Longdong data that were excluded from MRT analysis. This community is characterized by
its high abundance in corticated macrophyte algae (47.8% in UC). Community 6 is only yielded by MRT and characterized by its highest CCA coverage when compared to other communities (65%) (Table 4). Consensus tree was drawn with classification results from both approach (Figure 6
Discussion
Recognizing the existence of various benthic communities and understanding their abiotic determinism is critical for our understanding of their dynamics in a time of change.
To our knowledge, this study is among the few and the first in Northern Taiwan to scrutinize meticulously the effects of local abiotic factors shaping benthic communities. Detailed composition and recent conditions for communities in Northern Taiwan are also examined to hypothesize on potential trajectories they may adopt.
CCA was the dominant category across all studying sites in Northern Taiwan with an average of 48.2±15.9%. This is substantially higher than previous studies from Ribas- Deulofeu et al. (2016) with a contribution of 8.3±7.6% reported back to 2011 from surveyed sites within the same region. CCA is an important component in reef habitats that help in maintaining reef complexity and reduce erosion from strong wave energy (Tâmega and Figueiredo 2019). CCA’s ability in stabilizing reef structure makes communities with high CCA contribution more resistant to disturbances that cause mechanical damages such as typhoons and waves (Littler and Littler 2013). CCA is commonly seen as a cue of settlement and a suitable settlement ground for coral larvae (Ritson-Williams et al. 2009; Dean et al.
2015). In northern Taiwan, as water tropicalized, adequate temperature with abound CCA can be beneficial for scleractinian corals in the future (Vermeij et al. 2011). However, according to personal communications, CCA cover substantially increased starting from 20 years ago when freeway construction took place along the Northeastern coast. This caused high sedimentation runoff to the coastal area and altered the composition of the coral
assemblages. Thus, there are still other environmental condition to be taken into consideration for CCA to be beneficial for the recovery of scleractinian corals.
Hard coral averaged 22.9±15.8% in our study which is only slightly higher than values previously reported from northern Taiwan (18.8±9.7% in 2011 from Ribas-Deulofeu et al. 2016, 17.6% in 2016 from Lin and Denis 2019). Macroalgae comprised up to 15.1±20%
in this study which is below the values reported (23.2±11.4%) in Ribas-Deulofeu et al. 2016 surveyed in 2011. Turf algae made up 7.8±7% of the total biotic cover and is comparably lower to previous study (38.9±14.8%). Variation in survey locations and seasons possibly explain differences observed. Other major benthic categories only contributed a little to the benthic cover in northern Taiwan with no obvious difference as compared to previous study.
Overall, large standard deviations observed here in major and morpho-functional groups as well as in earlier studies (Ribas-Deulofeu et al. 2016; Lin and Denis 2019) suggested a high heterogeneity in the benthic assemblages among location in northern Taiwan that we sourced in the existence of a variety of communities.
Abiotic factors recorded in this study conformed with those from regions located in subtropical areas in coastal shallow waters (Hallock and Schlager 1986; Lin et al. 2018).
Temperature, nutrients, salinity and alkalinity were consistent among sites and may be used as representative of northern Taiwan conditions for future studies. Concentration of nutrients (i.e. PO43-, Si, NO2-), salinity and alkalinity fell in reasonable ranges of values reported in previous studies (Kleypas et al. 1999; McClanahan et al. 2003; Schoepf et al. 2015).
Chemical variables represented a snapshot of the condition at collection time while we specifically target similar weather condition for each sample collection to rule out possible effects caused by extreme weather events.
For sedimentation, the rate reported here (20.2 mg cm-2 day-1) ranged far beyond the normal sedimentation rates suggested for a healthy tropical coral reef (<10 mg cm-2 day-1, (Rogers 1990)) measured using sediment traps. Our Sedpods are likely to lower actual sedimentation rate, representing conditions that benthic organisms naturally experience.
Value can be compared with field data (1 – 3 mg cm-2 day-1) obtained using the same method from reefs at St. Thomas in the Caribbean sea (Ennis et al. 2016). Highest value recorded with Sedpods was after a flooding event in Hawaii and reached 60mg cm-2 day-1 , which is only three times higher than the values reported here in absence of extreme climatic event (Field et al. 2012). Value of C/N ratio (13.9 – 23.0) suggests sediment in northern Taiwan has a larger proportion from terrigenous origin (Perdue and Koprivnjak 2007). High sedimentation rate and turbid water in the North and Northeastern region of Taiwan has been suggested to result from water mass (Wang et al. 2014), but C/N ratio further propose that most sediments came from a terrigenous origin. These findings suggest that high sedimentation in the northern Taiwan is likely to be caused by erosion process in watershed, which can be influenced by human activities.
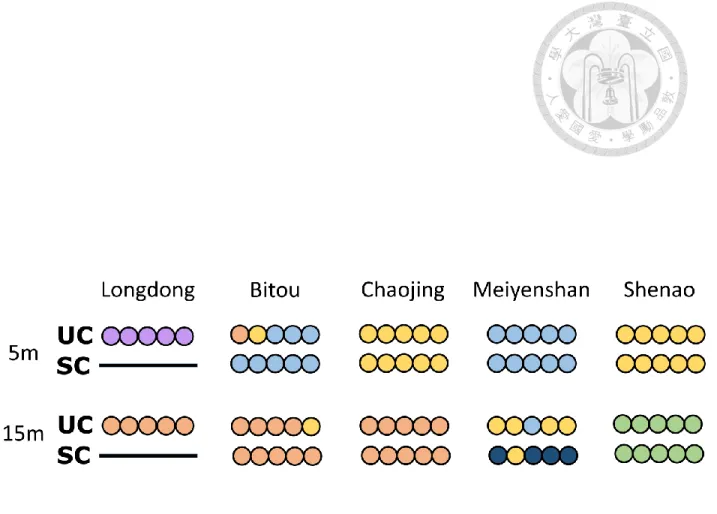
The two analytical approach (SC and UC) results in a total of 6 communities when combined and photographs representing each community are provided (Supplementary information S4). Communities identified by both approaches mostly conform to location (Figure 7). They produced similar hierarchical tree structures and mostly identified the same environmental variables at each split, suggesting highly comparable outcome from the two approaches. The classification between the two clustering methods showed a high convergence as indicated by high ARI value (0.82). This can also be visualized through the distribution of communities in study location where only seven out of 40 transects were
grouped differently in two methods. However, in these seven transects (Figure 7), explanation can be found for five of them when examining the PCA plot for MRT results (Figure 5). High overlapping of two communities suggests there are still other explanatory factors we did not considered.
Communities were distinguished by various conditions of wave motion, percentage of consolidated substrate, concentration of NO3- and minimum temperature. Community 1 has the relatively lowest wave motion and is characterized by foliose hard corals. The dominance of foliose hard corals often typifies environments with lower wave energy such as deeper habitats and thus assert the relationship between abiotic determinism of this community detected in both our MRT and RT (Rooney et al. 2010; Shimokawa et al. 2014).
It typifies deeper transects from Chaojing and Bitou. Community 2 is differentiated by stronger wave energy and is characterized by fan-shaped octocorals. Composition of this community resembles communities found at mesophotic habitat in the Mediterranean dominated by sea fans and other filter feeders (Bo et al. 2011; Gori et al. 2011) This community is found exclusively in greater depths from Shenao. Specific geographic setting for this survey location creates a continual current flow suitable for the living of fan-shaped octocorals (Fabricius and Alderslade 2001). Community 3 is differentiated by high wave energy and higher minimum temperature / higher NO3- concentration. Corticated foliose algae is indicator group of this community. High nutrients with higher wave energy typically provide a suitable environment for corticated foliose algae (Huang 2000). This community typifies shallower transects at Meiyenshan and Bitou. Sea urchins are observed in abundance at these locations and especially at Meiyenshan 5m. This could be interpreted by the food available for this herbivorous grazer, and withstandable wave condition at this location
(Solandt and Campbell 2001). Community 4 is determined by high wave energy and a high percentage of consolidated substrate greater or equal to 90%. Indicator groups for community 4 are CCA in UC and encrusting hard corals and tabular hard corals in SC. The composition of community 4 resembles marginal communities in shallow waters, which are often dominated by CCA with the presence of encrusting corals that are both known to withstand high wave energy (Perry and Larcombe 2003; Sommer et al. 2014). Community 4 is composed of transects from the shallow waters in Chaojing and Shenao and one from Meiyenshan deeper 15m waters in SC. Community 5 identified in UC is characterized by high abundance of corticated macrophyte algae and restricted in Longdong at shallow waters.
Community 6 identified only in SC is differentiated by high wave energy, comparably lower NO3-concentration, and is characterized by its high coverage of CCA. CCA are mostly encrusting and can withstand strong wave energy which conforms to the deciding abiotic factors for this community (Tâmega and Figueiredo 2019). This community typifies deeper depths at Meiyenshan with four transects within this group. Results from 2 communities existing in Meiyenshan deeper 15m waters showed that fine-scale geological factors is influential as substrate type can alter the benthic composition and possibly leads to different community co-occurring at small spatial scale (Taylor and Wilson 2003).
Similar communities yielded by both approach demonstrated that by recognizing the composition of a given community, we can have a rough idea on the environment condition of this community based on predictive power of k-means observed in our results.
Despite our supervised clustering already explained over half (58.2%) of the observed variance, there are still other factors that need be taken into consideration since our abiotic variables cannot solely explain the variance in these communities. A closer look at the
temperature and nutrients record suggests the presence of submarine groundwater discharge (SGD) at certain locations (Kim et al. 2005; Burnett et al. 2006). Other abiotic factors may be influential but were not considered in this study. Historical events such as bleaching, hurricane, and storms can alter the composition and have long-term effects on a community.(Lugo-Fernández and Gravois 2010; Van der Meij and Hoeksema 2010; Burt et al. 2011; Rodgers et al. 2015). Species interact with others and form unique biotic networks in communities thus causing differences in composition for various communities (Staniczenko et al. 2017; Komyakova et al. 2018).
Our results emphasize the importance of considering small scale abiotic factors as they may be responsible for nuances observed within a wider biogeographical context. They further suggest the strong potential of predicting environmental conditions by simply watching the community in place. Expansion of spatial scale and addition of contrasting sites would improve the prediction power as communities along a latitude gradient can be hypothesized to first separate on the large-scale physical factors such as temperature and light followed by regional factors and to the finest location-specific factors. The inclusion of other potential determining factors can provide a more comprehensive understanding of the communities. Eventually, I hypothesize that those nuances could be critically important for explaining the heterogeneity of responses observed among reefs when facing stressors.
References
Anthony KR, Connolly SR (2004) Environmental limits to growth: physiological niche boundaries of corals along turbidity–light gradients. Oecologia 141:373-384
Bauman AG, Feary DA, Heron SF, Pratchett MS, Burt JA (2013) Multiple environmental factors influence the spatial distribution and structure of reef communities in the northeastern Arabian Peninsula. Mar Pollut Bull 72:302-312
Bellwood DR, Hughes TP (2001) Regional-scale assembly rules and biodiversity of coral reefs. Science 292:1532-1535
Bessell-Browne P, Negri AP, Fisher R, Clode PL, Duckworth A, Jones R (2017) Impacts of turbidity on corals: The relative importance of light limitation and suspended sediments. Mar Pollut Bull 117:161-170
Biondini ME, Mielke PW, Berry KJ (1988) Data-dependent permutation techniques for the analysis of ecological data. Vegetatio 75:161-168
Bo M, Bertolino M, Borghini M, Castellano M, Harriague AC, Di Camillo CG, Gasparini G, Misic C, Povero P, Pusceddu A (2011) Characteristics of the mesophotic megabenthic assemblages of the Vercelli seamount (North Tyrrhenian Sea). PLoS One 6:e16357
Borcard D, Gillet F, Legendre P (2018) Multivariate Regression Trees: Constrained Clustering Numerical ecology with R. Springer, pp 99-108
Breiman L (1984) Classification and regression trees. Wadsworth International Group, Belmont, California
Bridge T, Fabricius K, Bongaerts P, Wallace C, Muir P, Done T, Webster J (2012) Diversity of Scleractinia and Octocorallia in the mesophotic zone of the Great Barrier Reef, Australia. Coral Reefs 31:179-189
Burnett W, Aggarwal P, Aureli A, Bokuniewicz H, Cable J, Charette M, Kontar E, Krupa S, Kulkarni K, Loveless A (2006) Quantifying submarine groundwater discharge in the coastal zone via multiple methods. Sci Total Environ 367:498-543
Burt J, Al-Harthi S, Al-Cibahy A (2011) Long-term impacts of coral bleaching events on the world’s warmest reefs. Mar Environ Res 72:225-229
Caliński T, Harabasz J (1974) A dendrite method for cluster analysis. Commun Stat Theory Methods 3:1-27
Chadwick NE, Morrow KM (2011) Competition among sessile organisms on coral reefs. In:
Dubinsky Z, Stambler N (eds) Coral Reefs: an ecosystem in transition. Springer, pp347-371
Chen CA (2014) Status of Coral Reefs in East and North Asia : Taiwan. In: Kimura T, Tun K, Chou LM (eds) Status of Coral Reefs in East Asian Seas Region: 2014. Global Coral Reef Monitoring Network. Ministry of the Environment, Japan 69-78
Chen JL, Yeh HJ (2018) Conflicts between local fisheries and recreational activities in an no-take zone (NTZ) of Taiwan: Perspectives of multiple stakeholders. 2018 OCEANS-MTS/IEEE Kobe Techno-Oceans (OTO):1-5
Connell JH, Hughes TP, Wallace CC, Tanner JE, Harms KE, Kerr AM (2004) A long‐term study of competition and diversity of corals. Ecol Monogr 74:179-210
Crossland C, Smith S (1983) Latitudinal limits of coral reef growth. Mar Ecol Prog Ser 11:105-111
Dai CF (2011) Eco-tourism map of coral reefs in Taiwan (In Chinese). Commonwealth Publishing Co., Ltd, Taiwan
Dai CF, Soong K, Chen CA, Hwang JS, Fan TY, Hsieh HY, Chang JS (2002) The status of coral reefs in Taiwan and the conservation problems. Proceedings of the IUCN/WCPA EA4 Taipei Conference, Taipei, Taiwan:265-276
Darling ES, Alvarez-Filip L, Oliver TA, McClanahan TR, Cote IM, Bellwood D (2012) Evaluating life-history strategies of reef corals from species traits. Ecol Lett 15:1378- 1386
De'Ath G (2002) Multivariate regression trees: a new technique for modeling species–
environment relationships. Ecology 83:1105-1117
De’Ath G (2007) Mvpart: multivariate partitioning R package version 1.2–6 Rpart by TM Therneau and B Atkinson R port of rpart by B Ripley Some routines from vegan by J Oksanen
Dean AJ, Steneck RS, Tager D, Pandolfi JM (2015) Distribution, abundance and diversity of crustose coralline algae on the Great Barrier Reef. Coral Reefs 34:581-594
Denis V, Soto D, De Palmas S, Lin YTV, Benayahu Y, Huang YM, Liu S, Chen J, Chen Q, Sturaro N, Ho M, Su Y, Dai CF, Chen CA (2019) Taiwan. In: Loya Y, Puglise KA, Bridge TC (eds) Mesophotic coral ecosystems Springer, Cham,Switzerland, pp249- 264
Done TJ (1992) Phase shifts in coral reef communities and their ecological significance.
Hydrobiologia 247:121-132
Done TT (2011) Corals: environmental controls on growth. In: Hopely D (ed) Encyclopedia of Modern Coral Reefs, pp281-293
Dufrêne M, Legendre P (1997) Species assemblages and indicator species: the need for a flexible asymmetrical approach. Ecol Monogr 67:345-366
Ennis RS, Brandt ME, Grimes KRW, Smith TB (2016) Coral reef health response to chronic and acute changes in water quality in St. Thomas, United States Virgin Islands. Mar Pollut Bull 111:418-427
Evans S, Abdo D (2010) A cost-effective technique for measuring relative water movement for studies of benthic organisms. Mar Freshw Res 61:1327-1335
Fabricius K, Alderslade P (2001) Soft corals and sea fans: a comprehensive guide to the tropical shallow water genera of the central-west Pacific, the Indian Ocean and the Red Sea. Australian Institute of Marine Science (AIMS)
Field CB (2014) Climate change 2014–Impacts, adaptation and vulnerability: Regional aspects. Cambridge University Press, Cambridge, England
Field ME, Chezar H, Storlazzi CD (2012) SedPods: a low-cost coral proxy for measuring net sedimentation. Coral Reefs 32:155-159
Gori A, Rossi S, Berganzo E, Pretus JL, Dale MR, Gili JM (2011) Spatial distribution patterns of the gorgonians Eunicella singularis, Paramuricea clavata, and Leptogorgia sarmentosa (Cape of Creus, Northwestern Mediterranean Sea). Mar Biol 158:143- 158
Hallock P, Schlager W (1986) Nutrient excess and the demise of coral reefs and carbonate platforms. Palaios:389-398
Hédouin L, Pilon R, Puisay A (2015) Hyposalinity stress compromises the fertilization of gametes more than the survival of coral larvae. Mar Environ Res 104:1-9
Ho MJ, Dai CF (2014) Coral recruitment of a subtropical coral community at Yenliao Bay, northern Taiwan. Zool Stud 53:5
Hoegh-Guldberg O, Poloczanska E, Skirving W, Dove S (2017) Coral reef ecosystems under climate change and ocean acidification. Front Mar Sci 4:158
Hoey AS, Pratchett MS, Cvitanovic C (2011) High macroalgal cover and low coral recruitment undermines the potential resilience of the world's southernmost coral reef assemblages. PLoS One 6:e25824
Huang SF (1999) Floristic Studies on the Benthic Marine Algae of Northeastern Taiwan.
Taiwania 44:271-298
Huang SF (2000) Seaweeds of Northeastern Taiwan. National Taiwan Museum, Taipei Hubert L, Arabie P (1985) Comparing partitions. J Classif 2:193-218
Hughes TP, Barnes ML, Bellwood DR, Cinner JE, Cumming GS, Jackson JBC, Kleypas J, van de Leemput IA, Lough JM, Morrison TH, Palumbi SR, van Nes EH, Scheffer M (2017) Coral reefs in the Anthropocene. Nature 546:82-90
Kahng S, Copus J, Wagner D (2014) Recent advances in the ecology of mesophotic coral ecosystems (MCEs). Curr Opin Environ Sustain 7:72-81
Kassambara A, Mundt F (2017) Package ‘factoextra’ Extract and visualize the results of multivariate data analyses
Kim G, Ryu JW, Yang HS, Yun ST (2005) Submarine groundwater discharge (SGD) into the Yellow Sea revealed by 228Ra and 226Ra isotopes: Implications for global silicate fluxes. Earth Planet Sci Lett 237:156-166
Kleypas J, Mcmanus J, Menez L (1999) Environmental Limits to Coral Reef Development:
Where Do We Draw the Line? Am Zool 39:146-159
Kohler KE, Gill SM (2006) Coral Point Count with Excel extensions (CPCe): A Visual Basic program for the determination of coral and substrate coverage using random point count methodology. Comput Geosci 32:1259-1269
Komyakova V, Jones GP, Munday PL (2018) Strong effects of coral species on the diversity and structure of reef fish communities: A multi-scale analysis. PloS One 13:e0202206
Kostylev VE, Erlandsson J, Ming MY, Williams GA (2005) The relative importance of habitat complexity and surface area in assessing biodiversity: fractal application on rocky shores. Ecological Complexity 2:272-286
Lantz C, Atkinson M, Winn C, Kahng S (2014) Dissolved inorganic carbon and total alkalinity of a Hawaiian fringing reef: chemical techniques for monitoring the effects of ocean acidification on coral reefs. Coral Reefs 33:105-115
Laverick JH, Andradi-Brown DA, Rogers AD (2017) Using light-dependent scleractinia to define the upper boundary of mesophotic coral ecosystems on the reefs of Utila, Honduras. PLoS One 12:e0183075
Legendre P, Gallagher ED (2001) Ecologically meaningful transformations for ordination of species data. Oecologia 129:271-280
Lesser MP, Slattery M, Laverick JH, Macartney KJ, Bridge TC (2019) Global community breaks at 60 m on mesophotic coral reefs. Glob Ecol Biogeogr 28:1403-1416
Lin SM, Tseng LC, Ang PO, Bolton J, Liu LC (2018) Long-term study on seasonal changes in floristic composition and structure of marine macroalgal communities along the coast of Northern Taiwan, southern East China Sea. Mar Biol 165:83
Lin YV, Denis V (2019) Acknowledging differences: number, characteristics, and distribution of marine benthic communities along Taiwan coast. Ecosphere 10:e02803
Littler MM, Littler DS (2013) The nature of crustose coralline algae and their interactions on reefs. In: Lang MA, Marinelli RL, Roberts SJ, Taylor PR (eds) Research and Discoveries: The Revolution of Science through Scuba, pp199-212
Lowe RJ, Falter JL (2015) Oceanic forcing of coral reefs. Ann Rev Mar Sci 7:43-66
Lugo-Fernández A, Gravois M (2010) Understanding impacts of tropical storms and hurricanes on submerged bank reefs and coral communities in the northwestern Gulf of Mexico. Cont Shelf Res 30:1226-1240
Luo MB, Liu F (2011) Salinity-induced oxidative stress and regulation of antioxidant defense system in the marine macroalga Ulva prolifera. J Exp Mar Bio Ecol 409:223-228 MacQueen J (1967) Some methods for classification and analysis of multivariate
observations. Proceedings of the fifth Berkeley symposium on mathematical statistics and probability 1:281-297
Matheus Z, Francini-Filho RB, Pereira-Filho GH, Moraes FC, Moura RL, Brasileiro PS, Amado-Filho GM (2019) Benthic reef assemblages of the Fernando de Noronha Archipelago, tropical South-west Atlantic: Effects of depth, wave exposure and cross- shelf positioning. PLoS One 14:e0210664
McClanahan T, Sala E, Stickels P, Cokos B, Baker AC, Starger C, Jones Iv S (2003) Interaction between nutrients and herbivory in controlling algal communities and coral condition on Glover¹s Reef, Belize. Mar Ecol Prog Ser 261:135-147
McCook L, Jompa J, Diaz-Pulido G (2001) Competition between corals and algae on coral reefs: a review of evidence and mechanisms. Coral Reefs 19:400-417
McManus JW, Polsenberg JF (2004) Coral–algal phase shifts on coral reefs: ecological and environmental aspects. Prog Oceanogr 60:263-279
Oksanen J, Blanchet F, Friendly M, Kindt R, Legendre P, McGlinn D Vegan: Community Ecology Package. R package version 2.4-5. 2017
Ouellette M, Legendre P (2013) MVPARTwrap: Additional features for package mvpart. R package version 0.1-9.2
Perdue EM, Koprivnjak JF (2007) Using the C/N ratio to estimate terrigenous inputs of organic matter to aquatic environments. Estuar Coast Shelf Sci 73:65-72
Perry C, Larcombe P (2003) Marginal and non-reef-building coral environments. Coral Reefs 22:427-432
Pineda MC, Strehlow B, Sternel M, Duckworth A, Den Haan J, Jones R, Webster NS (2017) Effects of sediment smothering on the sponge holobiont with implications for dredging management. Sci Rep 7:1-15
R core Team (2020) R: A language and environment for statistical computing. R Foundation for Statistical Computing, Vienna, Austria
Ribas-Deulofeu L, Denis V, De Palmas S, Kuo CY, Hsieh HJ, Chen CA (2016) Structure of Benthic Communities along the Taiwan Latitudinal Gradient. PLoS One 11:e0160601
Ritson-Williams R, Arnold SN, Fogarty ND, Steneck RS, Vermeij MJ, Paul VJ (2009) New perspectives on ecological mechanisms affecting coral recruitment on reefs. Smithson Contrib Mar Sci 38:437
Roberts DW (2007) labdsv: Ordination and multivariate analysis for ecology R package version
Rodgers KS, Jokiel PL, Brown EK, Hau S, Sparks R (2015) Over a decade of change in spatial and temporal dynamics of hawaiian coral reef communities. Pacific Science 69
Rogers CS (1990) Responses of coral reefs and reef organisms to sedimentation. Mar Ecol Prog Ser 62:185-202
Rooney J, Donham E, Montgomery A, Spalding H, Parrish F, Boland R, Fenner D, Gove J, Vetter O (2010) Mesophotic coral ecosystems in the Hawaiian Archipelago. Coral Reefs 29:361-367
Schoepf V, Stat M, Falter JL, McCulloch MT (2015) Limits to the thermal tolerance of corals adapted to a highly fluctuating, naturally extreme temperature environment. Sci Rep 5:1-14
Sheppard C, Davy S, Pilling G, Graham N (2017) The biology of coral reefs. Oxford University Press
Shimokawa S, Murakami T, Ukai A, Kohno H, Mizutani A, Nakase K (2014) Relationship between coral distributions and physical variables in Amitori Bay, Iriomote Island, Japan. J Geophys Res Oceans 119:8336-8356
Solandt J, Campbell AC (2001) Macroalgal feeding characteristics of the sea urchin Diadema antillarum Philippi at Discovery Bay, Jamaica. Caribbean Journal of Science 37:227- 238
Sommer B, Harrison PL, Beger M, Pandolfi JM (2014) Trait‐mediated environmental filtering drives assembly at biogeographic transition zones. Ecology 95:1000-1009 Spalding M, Burke L, Wood SA, Ashpole J, Hutchison J, zu Ermgassen P (2017) Mapping
the global value and distribution of coral reef tourism. Mar Policy 82:104-113 Staniczenko PP, Sivasubramaniam P, Suttle KB, Pearson RG (2017) Linking macroecology
and community ecology: refining predictions of species distributions using biotic interaction networks. Ecol Lett 20:693-707
Takeshita Y, Cyronak T, Martz TR, Kindeberg T, Andersson AJ (2018) Coral reef carbonate chemistry variability at different functional scales. Front Mar Sci 5:175
Tâmega FT, Figueiredo MA (2019) Colonization, Growth and Productivity of Crustose Coralline Algae in Sunlit Reefs in the Atlantic Southernmost Coral Reef. Front Mar Sci 6:81
Tanaka Y, Miyajima T, Watanabe A, Nadaoka K, Yamamoto T, Ogawa H (2011) Distribution of dissolved organic carbon and nitrogen in a coral reef. Coral Reefs 30:533-541
Taylor PD, Wilson MA (2003) Palaeoecology and evolution of marine hard substrate communities. Earth Sci Rev 62:1-103
Van der Meij SE, Hoeksema BW (2010) Long-term changes in coral assemblages under natural and anthropogenic stress in Jakarta Bay (1920–2005). Mar Pollut Bull 60:1442-1454
Van Woesik R, Sakai K, Ganase A, Loya Y (2011) Revisiting the winners and the losers a decade after coral bleaching. Mar Ecol Prog Ser 434:67-76
Vermeij M, Dailer M, Smith C (2011) Crustose coralline algae can suppress macroalgal growth and recruitment on Hawaiian coral reefs. Mar Ecol Prog Ser 422:1-7
Wang J, Chern C, Jan S, Yang Y, Chen S, Chang M, Chiou M, Kuo T, Kuo C (2014) Overview of seawater movement Regional oceanography of Taiwan. National Taiwan University, Taipei,Taiwan., pp123-240
Wild C, Hoegh-Guldberg O, Naumann MS, Colombo-Pallotta MF, Ateweberhan M, Fitt WK, Iglesias-Prieto R, Palmer C, Bythell JC, Ortiz J-C (2011) Climate change impedes scleractinian corals as primary reef ecosystem engineers. Mar Freshw Res 62:205- 215
Williams GJ, Smith JE, Conklin EJ, Gove JM, Sala E, Sandin SA (2013) Benthic communities at two remote Pacific coral reefs: effects of reef habitat, depth, and wave energy gradients on spatial patterns. PeerJ 1:e81
List of figures
Figure 1. Study locations
Figure 2. Communities identified by k-means
Figure 3. Regression Tree of k means result combined with abiotic factors
Figure 4. MRT for benthic communities of northern Taiwan
Figure 5. PCA plot of MRT partitioning results
Figure 6. Consensus tree for UC and SC
Figure 7. Spatial distribution of communities
Figure 1. Study locations (a) the study region in Taiwan (b) the five stations in Northern Taiwan. Blue lines on land mass in (b) indicate freshwater from all sources including temporarily / permanent and surface / groundwater rivers.
Figure 2. Communities identified by k-means (a) results visualized on a PCA plot. (b) Calinski criterion identified 5 partitions as the best result.
Figure 3. Regression Tree of k means result combined with abiotic factors. Numbers below each group represent how many transects from the original partitioning results were put into the nodes of this a posteriori tree.
Figure 4. MRT for benthic communities of northern Taiwan. Abiotic determinisms for each split are provided in the upper proportion of the split. Functional groups given below represents groups that are responsible for each split. Bar plots beneath each final nodes are mean composition of different functional groups within each community.
Figure 5. PCA plot of MRT partitioning results. Different color represents assigned communities by MRT.
Figure 6. Consensus tree for UC and SC. Functional groups below each final split represents indicator groups of the communities.
Figure 7. Spatial distribution of communities. Transects at each location with their assigned community. Lack of data for Longdong in SC due to stolen loggers. Community conforms mostly to locations.
List of tables
Table 1. 26 morpho-functional group based on their morphology and major taxa.
Table 2. Abiotic factors with their corresponding units and measurement method.
Table 3. Collection timespan for abiotic factors .
Table 4. Compared results for UC and SC.
Table 1. 26 morpho-functional group based on their morphology and major taxa.
Major category Morpho-functional group Hard corals (HC) Bushy hard corals
Columnar hard corals Digitate hard corals Encrusting hard corals Foliose hard corals Massive hard corals Tabular hard corals Octocorals (OC) Bushy octocorals
Digitate octocorals Fan-shaped octocorals Lobate octocorals Whip-shaped octocorals Macroalgae (MA) Calcareous macroalgae
Corticated foliose macroalgae Corticated macrophyte macroalgae Crustose Coralline Algae
(CC)
Crustose coralline algae
Turf algae (TU) Filamentous algae
Sponge (SP) Encrusting sponge
Massive sponge
Anemone (AN) Encrusting anemone
Plumose anemone
Zoanthid (ZO) Bushy zoanthid
Encrusting zoanthid Massive zoanthid Hydrozoan (HY) Bushy hydrozoan
Other life (OL) Mobile
Table 2. Abiotic factors with their corresponding units and measurement method.
Unit Collection method Collection
type Measuring method Physical factors
Temperature °C HOBO pendant
Temp/Light 64K Continuous
HOBO ware
Light intensity lux Continuous
Wave motion m s-2 HOBO pendant G
H2OMotionV2
Continuous Chemical factors
Salinity PSU Water sample Momentary Refractometer
Alkalinity meq L-1 Water sample Momentary Titration
NO3- µmol L -1 Water sample Momentary Colorimetry
NO2- µmol L -1 Water sample Momentary Colorimetry
PO43- µmol L -1 Water sample Momentary Colorimetry
Si µmol L -1 Water sample Momentary Colorimetry
DOC µmol L -1 Water sample Momentary Combustion
DIC mmol L -1 Water sample Momentary Titration
Geological factors
Sedimentation µg cm-2 day-1 Sedpod Continuous Weighing
C/N ratio n/a CHNS analyzer Continuous Combustion
Substrate type % of consolidated
substrate
Photoquadrat Momentary X
Table 3. Collection timespan for abiotic factors . Collection timespan Continuous data
5/25 6/20 7/15
Longdong (5/24-7/10)
Bitou (6/3-7/10)
Chaojing (6/17-7/12)
Shenao (6/26-7/11)
Meiyenshan (6/27-7/16) Used data for MRT (6/27-7/10) Momentary data
Longdong 7/10
Bitou 7/10
Chaojing 7/12
Shenao 7/11
Meiyenshan 7/16
Table 4. Compared results for UC and SC. Dominant morpho-functional group and Indicator group for communities delineated by UC and SC. Major categories are abbreviated as mentioned in Materials and methods. Community 5 & 6 were delineated only in UC and SC
respectively. Numbers next to dominant group represents percentage cover with standard deviation.
UC SC
Dominant group Indicator group Dominant group Indicator group
Community 1 CCA (52.8±2.8)
Foliose HC (22.3±1.6)
Encrusting HC (11±0.8)
Foliose HC Encrusting HC
CCA (54.8±3)
Foliose HC (19.5±1.7)
Encrusting HC (12.7±0.8)
Foliose HC Community 2 CCA (42.2±4.6)
Fan-shaped OC (23.9±2.9)
Filamentous TU (19.2±1.4)
Fan-shaped OC Bushy OC Encrusting SP
CCA (42.2±4.6)
Fan-shaped OC (23.9±2.9)
Filamentous TU (19.2±1.4)
Fan-shaped OC Bushy OC Bushy zoanthid Community 3 CCA (39.4±1.9)
Corticated Foliose AG (29.2±1.6)
Corticated Macrophyte AG (8.3±0.9)
Corticated foliose AG Digitate OC
CCA (41.6±1.8)
Corticated Foliose AG (26.3±1.5)
Corticated Macrophyte AG (7.4±0.8)
Corticated foliose AG Digitate OC
Corticated macrophyte AG Community 4 CCA (57.6±0.9)
Encrusting HC (13.9±0.5)
Filamentous TU (10.2±0.4)
CCA
CCA (54.5±1.3)
Encrusting HC (14.7±0.6)
Filamentous TU (10.1±0.5)
Tabular HC Encrusting HC Community 5
(Longdong) Corticated Macrophyte AG (47.9±6.9)
CCA (32.7±3.4)
Massive HC (4.0±2.5)
Corticated macrophyte AG Calcareous AG
Lobate OC
Community 6 CCA (64.6±4.8)
Encrusting HC (12.1±2.5)
Filamentous TU (10.2±1.3)
Crustose coralline algae
Supplementary information
S1. 131 OTUs and their corresponding morpho-functional group S2. Protocols for chemical analysis.
S3. Sediment collection and estimation S4. Photographs of the six communities
S1. 131 OTUs and their corresponding morpho-functional group
Major category OTUs Morpho- functional group
Hard Corals Acanthastrea spp hc_encrusting
Hard Corals Acropora digitifera hc_bushy
Hard Corals Acropora gemmifera hc_digitate
Hard Corals Acropora hyacinthus hc_tabular
Hard Corals Acropora muricata hc_bushy
Hard Corals Acropora solitaryensis hc_tabular
Hard Corals Acropora tenuis hc_bushy
Hard Corals Acropora verweyi hc_bushy
Hard Corals Alveopora verrilliana hc_columnar
Hard Corals Astreopora encrusting hc_encrusting Hard Corals Coscinaraea columnar spp hc_massive Hard Corals Cyphastrea encrusting hc_encrusting
Hard Corals Dipsastraea spp. hc_massive
Hard Corals Echinophyllia echinata hc_encrusting Hard Corals Echinophyllia echinoporoides hc_encrusting
Hard Corals Echinophyllia sp1 hc_encrusting
Hard Corals Favites abdita hc_encrusting
Hard Corals Favites chinensis hc_encrusting
Hard Corals Favites complanata hc_encrusting
Hard Corals Favites flexuosa hc_encrusting
Hard Corals Favites halicora hc_encrusting
Hard Corals Favites pentagona hc_encrusting
Hard Corals Favites russelli hc_encrusting
Hard Corals Goniastrea massive hc_massive
Hard Corals Goniastrea encrusting spp hc_encrusting
Hard Corals Goniopora columna hc_columnar
Hard Corals Hydnophora microconos hc_encrusting Hard Corals Leptastrea encrusting hc_encrusting
Hard Corals Leptoseris explanata hc_foliose Hard Corals Leptoseris mycetoseroides hc_foliose
Hard Corals Leptoseris yabei hc_foliose
Hard Corals Lithophyllon undulatum hc_foliose
Hard Corals Lobophyllia spp hc_massive
Hard Corals Montastrea spp hc_massive
Hard Corals Montipora encrusting hc_encrusting
Hard Corals Montipora foliosa hc_foliose
Hard Corals Montipora foveolata hc_encrusting
Hard Corals Mycedium elephantotus hc_foliose
Hard Corals Mycedium robokaki hc_foliose
Hard Corals Oxypora lacera hc_foliose
Hard Corals Pachyseris speciosa hc_foliose
Hard Corals Pavona cactus hc_foliose
Hard Corals Pavona explanulata hc_foliose
Hard Corals Pavona varians hc_encrusting
Hard Corals Pectinia lactuca hc_foliose
Hard Corals Platygyra lamellina hc_massive
Hard Corals Platygyra pini hc_massive
Hard Corals Pocillopora damicornis hc_bushy
Hard Corals Pocillopora eydouxi hc_bushy
Hard Corals Porites encrusting hc_encrusting
Hard Corals Porites lichen hc_encrusting
Hard Corals Porites massive sp1 hc_massive
Hard Corals Porites rus hc_massive
Hard Corals Psammocora profundacella hc_encrusting Hard Corals Psammocora morph. superficialis hc_encrusting
Hard Corals Seriatopora caliendrum hc_bushy
Hard Corals Stylocoeniella spp. hc_encrusting
Hard Corals Stylophora pistillata hc_bushy