R E S E A R C H Open Access
An efficient method for mining cross-timepoint gene regulation sequential patterns from time course gene expression datasets
Chun-Pei Cheng1, Yu-Cheng Liu1,2, Yi-Lin Tsai1, Vincent S Tseng1,3*
From IEEE International Conference on Bioinformatics and Biomedicine 2012 Philadelphia, PA, USA. 4-7 October 2012
Abstract
Background: Observation of gene expression changes implying gene regulations using a repetitive experiment in time course has become more and more important. However, there is no effective method which can handle such kind of data. For instance, in a clinical/biological progression like inflammatory response or cancer formation, a great number of differentially expressed genes at different time points could be identified through a large-scale microarray approach. For each repetitive experiment with different samples, converting the microarray datasets into transactional databases with significant singleton genes at each time point would allow sequential patterns implying gene regulations to be identified. Although traditional sequential pattern mining methods have been successfully proposed and widely used in different interesting topics, like mining customer purchasing sequences from a transactional database, to our knowledge, the methods are not suitable for such biological dataset because every transaction in the converted database may contain too many items/genes.
Results: In this paper, we propose a new algorithm called CTGR-Span (Cross-Timepoint Gene Regulation Sequential pattern) to efficiently mine CTGR-SPs (Cross-Timepoint Gene Regulation Sequential Patterns) even on larger datasets where traditional algorithms are infeasible. The CTGR-Span includes several biologically designed parameters based on the characteristics of gene regulation. We perform an optimal parameter tuning process using a GO enrichment analysis to yield CTGR-SPs more meaningful biologically. The proposed method was evaluated with two publicly available human time course microarray datasets and it was shown that it outperformed the traditional methods in terms of execution efficiency. After evaluating with previous literature, the resulting patterns also strongly
correlated with the experimental backgrounds of the datasets used in this study.
Conclusions: We propose an efficient CTGR-Span to mine several biologically meaningful CTGR-SPs. We postulate that the biologist can benefit from our new algorithm since the patterns implying gene regulations could provide further insights into the mechanisms of novel gene regulations during a biological or clinical progression. The Java source code, program tutorial and other related materials used in this program are available at http://websystem.
csie.ncku.edu.tw/CTGR-Span.rar.
* Correspondence: [email protected]
1Department of Computer Science and Information Engineering, National Cheng Kung University, No.1, University Road, Tainan City 701, Taiwan Full list of author information is available at the end of the article
© 2013 Cheng et al.; licensee BioMed Central Ltd. This is an open access article distributed under the terms of the Creative Commons Attribution License (http://creativecommons.org/licenses/by/2.0), which permits unrestricted use, distribution, and reproduction in any medium, provided the original work is properly cited.
Background
Over the past decade, a great number of studies on time course issue have become increasingly important since most clinical/biological events, such as infection-related chronic/acute inflammatory responses [1-3], drug treat- ment-related experiments [4], cell cycle-arrest [5] or other important issues [6], require a period of time in which aberrant alterations in gene expression would lead to dif- ferent outcomes. Therefore, through performing a conse- cutive monitoring of massive gene expressions and discovering their regulations during clinical/biological manifestations, the hidden layer of biological mechanisms could be unveiled. However, to our knowledge, these is no effective method can handle this issue although the high- throughput microarray is a powerful tool and has been widely utilized to efficiently detect differentially expressed genes among a group of patients in a time course experi- ment [3,4]. These authors only focused on how to identify differentially expressed genes varied with time but actually we did not know whether these genes are associated with each other or not. Their results did not show the valuable information.
Sequential pattern mining is one of the most important topics in the field of data mining, especially for the data- base systems. The fundamental meaning of a sequential pattern refers to a set of singleton frequent items/differen- tially expressed genes that are followed by another set of items/differentially expressed genes in the time-stamp ordered transaction. Therefore, once the potential gene regulations occurred in a period of time, it could be identi- fied by mining such sequential patterns from a dataset- converted database. Referring to previous studies, several parental algorithms using different computational designs, such as AprioriAll [7], SPADE [8] and PrefixSpan [9], have been successfully proposed and used for different databases to discover their own sequential patterns. The apriori-like (level-wise) GSP [10] and pattern-growth-based Prefix- growth [11] as well as DELISP [12] are evolutionarily designed incorporating with many constraints such as the size of gap among the sequence-involved singleton items, or a time interval within which items are observed as belonging to the same transaction even if they originate from different transactions. Besides, any possible subpat- terns derived from each parental sequential pattern also satisfy the user-set constraint values. This property is called downward closure[7-12]. Therefore, any possible subpat- terns of each sequential pattern, particularly for the longer ones, need to be generated during the decomposing pro- cess that is time-consuming and space-exhausting. Once both shorter and longer sequential patterns have the same occurrence times across all transactions in the database, i.e., closed sequential patterns, the shorter ones will be eliminated from the final resulting patterns. For this pur- pose, some newer algorithms like incorporating with
constraints, CTSP [13], and without constraints, CloSpan [14], were then designed to tackle this problem. In addi- tion to these traditional algorithms, an increasing number of extended methods have also been performed on some interesting topics. For example, an algorithm called WSpan[15] could be used to determine weighted sequen- tial patterns from a transactional database, and the MAGIIC [16] was designed to discover the structure motifs from protein sequences. However, to the best of our knowledge, all of the aforementioned methods are not suitable for the widely used microarray data, as a large- scale DNA microarray-based platform normally consists over tens of thousands of probes/genes, e.g., over 45,000 probes/genes in rice and over 20,000 probes/genes in human arrays. A set of differentially expressed genes (sig- nificant singleton gene items) on a single array could be individually considered as a single transaction. In that way, each transaction (each time point contained gene items) may contain too many significant singleton gene items after converting the numeric datasets into the format (dis- crete) of transactional databases [17]. This is called a long transaction issue. However, to date, there exists no method which can efficiently handle such kind of issue.
Actually, a lot of items would frequently occur at most time points. They are similar to the housekeeping genes, which are very insensible to an extracellular stimulus;
instead, they play critical roles as maintenance genes in the basic cellular functions [18]. Moreover, mining sequential patterns containing too many such items may increase the difficulty in interpreting the resulting gene regulations. The performance of the preceding sequential pattern mining methods would also be limited to these simultaneous items.
In this paper, we propose a new algorithm called CTGR- Span(Cross-Timepoint Gene Regulation Sequential pat- tern) with some biologically designed parameters to solve the issue mentioned above by mining CTGR-SPs (Cross- Timepoint Gene Regulation Sequential Patterns). The CTGR-Span ensures that all of the resulting patterns imply gene regulations, which take place across different time points during the course of biological observations.
The method is an extended and improved version of our previous paper [19] presented in the 2012 IEEE Interna- tional Conference on Bioinformatics and Biomedicine (BIBM). The most important changes include: first, we designed a new optimal parameter tuning procedure for the proposed algorithm to ideally determine suitable con- ditions in pattern mining. The procedure has a merit that there is no need to additionally compute the standard deviation of time intervals in a time course dataset. Based on this design, then we compared our method with two representative sequential pattern mining algorithms, namely GSP and PrefixSpan, in execution efficiency and effectiveness. The resulting patterns were validated using a
manual literature survey and an automatic Gene Ontology enrichment analysis [20]. Finally, more explanations for the proposed algorithm have also been added to this paper like i) providing complete examples for readily under- standing both our proposed algorithm and the new para- meter tuning procedure, and ii) performing more experimental results on the two publicly available human disease-related time course microarray datasets [3,4].
The rest of this paper is organized as follows. The pro- posed method and materials for analysis are described in Methods. In Results and Discussion, we give the experi- mental results of the proposed method on two time course gene expression datasets. Concluding remarks are given in Conclusions.
Methods
In this section, we introduce how to efficiently discover CTGR-SPs(Cross-Timepoint Gene Regulation Sequen- tial Patterns) from a time course microarray dataset through 3 main parts: i) an introduction to the experi- mental background of 2 input microarray datasets, ii) how to convert a numeric dataset into a transactional database, and iii) the kernel of the CTGR-Span (Cross- Timepoint Gene Regulation Sequential pattern) and its required biologically designed arguments.
Input microarray datasets
We tested this paper presenting method using the same input datasets as our previous works [19]. In brief, 2 time course gene expression microarray datasets (GSE6377 [3] and GSE11342 [4]) were downloaded from the GEO database. In GSE6377, McDunn et al.
attempted to detect 8,793 transcriptional changes in 11 ventilator-associated pneumonia patients’ leukocytes across 10 time points. For the other GSE11342, Taylor et al. monitored 22,283 gene expression changes in per- ipheral blood monocytes of 20 hepatitis C virus infected patients across the first 10 weeks right after treating with the Peg-interferon alfa-2b plus ribavirin.
Converting microarray datasets into transactional databases
The sequential patterns could be mined directly from a transactional database if the data are discrete. The micro- array-involved probe/gene expression values need to be discretized into singleton items within every transaction.
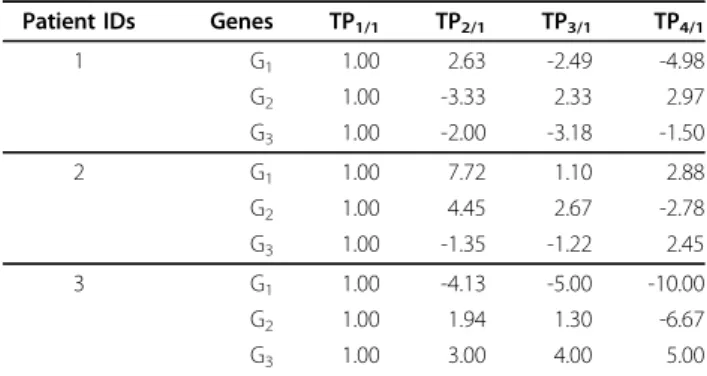
Here we show you an example from Table 1 to 3. Table 1 shows the probe/gene expression values of 3 genes G1to G3 over 4 time points TP1to TP4with a fixed interval (1 day). The experimental design is performed in 3 patients. The first time point of this example is regarded as a baseline for deriving the significant items at each time point. All of the values are then divided by the first time point. The divided values can be presented in a fold
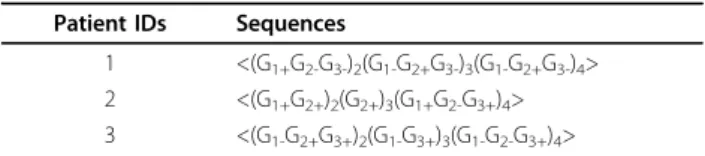
change matrix as Table 2. The absolute fold changes exceeding a fold-change threshold are further defined as the significant genes. Suppose that the threshold is set as 1.5, only the eligible significant genes can be preserved as new items as shown in Table 3. Take patient 1 for instance, up-regulated G1, down-regulated G2and down- regulated G3occur at the second time point that will be presented within the same parentheses (transaction).
In this example, a set of 3 time-ordered transactions for each patient is called a sequence.
However, the content of the converted transactional databases will be affected by different threshold settings. In this study, the threshold of GSE6377 is set as 1.03 and the thresholdof GSE11342 is set as 1.5, based on the same cri- teria used for the original datasets [3,4].
CTGR-Span: cross-timepoint gene regulation sequential pattern
Since the CTGR-Span is designed based on a pattern- growth-based manner [9] for mining CTGR-SPs, we will present the kernel procedure and meanwhile show the main differences between the traditional pattern-growth- based and our methods using a readily understood exam- ple. Finally, we present several extra biologically designed parameters toward more meaningful CTGR-SPs in biology.
Table 1 Example of time course microarray dataset
Patient IDs Genes TP1 TP2 TP3 TP4
1 G1 249 656 100 50
G2 333 100 777 989
G3 500 250 157 333
2 G1 123 950 135 354
G2 222 987 592 80
G3 300 222 246 735
3 G1 500 121 100 50
G2 400 777 520 60
G3 100 300 400 500
TPn: gene/probe reading values at time point n.
Table 2 Fold changes of gene/probe reading values
Patient IDs Genes TP1/1 TP2/1 TP3/1 TP4/1
1 G1 1.00 2.63 -2.49 -4.98
G2 1.00 -3.33 2.33 2.97
G3 1.00 -2.00 -3.18 -1.50
2 G1 1.00 7.72 1.10 2.88
G2 1.00 4.45 2.67 -2.78
G3 1.00 -1.35 -1.22 2.45
3 G1 1.00 -4.13 -5.00 -10.00
G2 1.00 1.94 1.30 -6.67
G3 1.00 3.00 4.00 5.00
TPn/m: gene/probe reading values of time point n relative to m.
Kernel procedure
The main strength of the CTGR-Span is to overcome a pro- blem that the transactions have too many items/significant genes. According to our design, it also has several advan- tages: i) the items within transactions do not need to be sorted in advance, ii) the mining results will not be affected by different sorting types, iii) more meaningful sequential patterns implying gene regulations in biology can be suc- cessfully discovered relative to the traditional sequential pat- tern mining algorithms [7-12], and iv) massive repeated redundant patterns will not be identified. The following examples guide you how to trace the mining processes to explore the patterns from a microarray dataset-converted database. A set S of sequences containing 4 patients’ trans- actions is shown in Table 4. Each transaction consists of several significant gene items Gn+/-. In this example, we set a minimum support (minSupp) as 50%, which means if any one of the items occur in at least 2 different individual sequences (each patient has its own sequence), we call these items as frequent items and further to generate CTGR-SPs through a prefix-projection-based manner [9] in the follow- ing steps:
Step 1: Find length-1 CTGR-SPs
After scanning the S, the frequent items of length-1 including <G1+>, <G2-> and <G3+> can be successfully identified since they appear over one half of the sequences. Therefore, these 3 frequent items are regarded as the lengh-1 CTGR-SPs.
Step 2: Divide search space
Each item within the set of length-1 CTGR-SPs is indi- vidually considered as a prefix to find its postfixes in which they are also frequent in the S.
Step 3: Find postfixes of CTGR-SPs
For each identified prefix, the subsets of CTGR-SPs can be identified using a depth-first search-based manner in the prefixes projected databases.
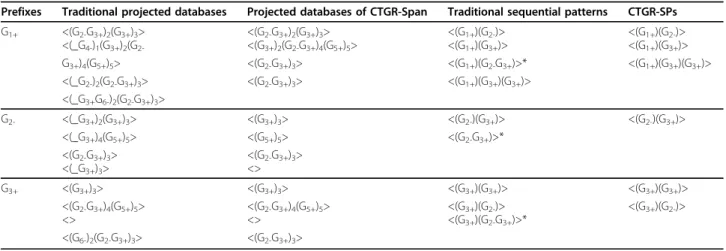
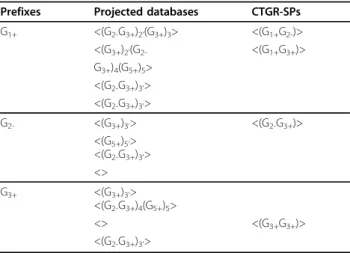
For readily understanding the above 3 steps, here we extend an example shown in Table II of our previous con- ference paper [19] as Table 5 and show more descriptions on the comparisons of the traditional sequential pattern- growth-based manner and our proposed CTGR-Span.
First, for the proposed method, the prefixes within length- 1 CTGR-SPsare shown in the left-most column. Only the subsequences prefixed with the first occurrence of the pre- fixesand started from the next transaction will be pre- sented in the projected databases. As an example, the prefix<G1+> contained in the sequence <(G1+G4-)1(G3+)2
(G2-G3+)4(G5+)5> of patient 2 (Table 4), only the subse- quence <(G3+)2(G2-G3+)4(G5+)5> will be listed in the pro- jected database for mining longer CTGR-SPs. According to the same principle, the sequences in S containing <G1 +> are projected to form the <G1+>-projected database, which consists of 4 candidate postfixes: <(G2-G3+)2(G3+)3>,
<(G3+)2(G2-G3+)4(G5+)5>, <(G2-G3+)3> and <(G2-G3+)3>.
Then, by scanning <G1+>-projected database once, the length-2 CTGR-SPshaving prefix <G1+> can be identified including <(G1+)(G2-)>: 4 (<(G1+)(G2-)> appears 4 times) and <(G1+)(G3+)>: 4. The CTGR-SPs longer than length-2 can be further generated from the current length-2 CTGR- SPs. After constructing their respective projected data- bases, the <(G1+)(G2-)>-projected database consists of two candidate postfixes: <(G3+)3> and <(G5+)5>. However, both
<(G3+)> and <(G5+)> appear only once over the sequences involved in the <(G1+)(G2-)>-projected database that is lower than the minSupp (50%). Hence, the further pro- cesses for mining the <(G1+)(G2-)>-projected database will be terminated. On the other hand, recursive mining pat- terns from the <(G1+)(G3+)>-projected database, which contains two candidate postfixes including <(G3+)3> and
<(G2-G3+)4(G5+)5>, returns one eligible postfix <G3+> to form a length-3 CTGR-SPs <(G1+)(G3+)(G3+)>. Finally, according to the same criteria, we can find the remaining CTGR-SPsprefixed with <G2-> or <G3+> by constructing their corresponding projected databases.
After mining all of the sequential patterns, apparently, the traditional patterns marked with an asterisk will not be discovered by our proposed method since they contain the simultaneous items at the same time point. For example, in the first row data of Table 5 one <(G1+)(G2-G3+)> out of four traditional sequential patterns contains the simul- taneous item G2-and G3+, which do not imply a gene reg- ulation in a time period but a frequent itemset. Although the pattern could be disassembled into“(G1+)® (G2-)”
and“(G1+)® (G3+)”, they have overlapped with the other explored sequential patterns including the traditional length-2sequential pattern <(G1+)(G2-)> and <(G1+)(G3+)>.
Therefore, a lot of redundant patterns may be identified by the traditional methods. This thorny problem can be avoided by mining CTGR-SPs. Table 5 shows the strength of the CTGR-Span and elucidates why CTGR-Span is more Table 4 Example of transactional database
Patient IDs Sequences
1 <(G1+)1(G2-G3+)2(G3+)3>
2 <(G1+G4-)1(G3+)2(G2-G3+)4(G5+)5>
3 <(G8-)1(G1+G2-)2(G2-G3+)3>
4 <(G7+)1(G1+G3+G6-)2(G2-G3+)3>
<>: a sequence; ()t: a transaction of time point t; G+/-: significantly up- or down-regulated gene item.
Table 3 Converted transactional database Patient IDs Sequences
1 <(G1+G2-G3-)2(G1-G2+G3-)3(G1-G2+G3-)4>
2 <(G1+G2+)2(G2+)3(G1+G2-G3+)4>
3 <(G1-G2+G3+)2(G1-G3+)3(G1-G2-G3+)4>
<>: a sequence; ()t: a transaction of time point t; G+/-: significantly up- or down-regulated gene item.
efficient and useful than the traditional pattern-growth- based methods.
Biological parameter designs
As stated above, we have introduced the main differ- ences between the traditional and our proposed method.
Then we intend to describe how to enrich the patterns with more meaningful in biology. In addition to the inherent parameter minSupp for mining traditional pat- terns, we additionally introduce 3 parameters: minimum timepoint support (minTSupp), sliding window size (SWS) and maximum time constraint (maxTC) to the CTGR-Span to mine more meaningful sequential pat- terns in gene regulation based on some biological char- acteristics. Since the fundamental definitions of these parameters have been shown in the section II, MATERI- ALS AND METHODS, of our previous conference paper [19], here we briefly describe their main charac- teristics and followed by some concrete examples.
minTSupp (minimum timepoint support). After con- verting the input microarray datasets into the transac- tional datasets, thousands of items are contained in each transaction. The average lengths of the transactions of the two datasets are presented as two bars at the left- most N tick shown in Figure 1. The continuously expressed genes at all-time points may not be suscepti- ble to the cellular responses. They may have a propen- sity for being housekeeping or maintenance genes [18].
In this regard, some well-studied housekeeping genes (HGs) contained in each transaction will be removed.
Based on the similar concept, if the items constitutively appear in most time points, these HG-like items can also be further removed from the transactions using the proposed parameter minTSupp. The average lengths of transactions in both input datasets as the functions of varying minTSupp are shown in Figure 1.
SWS (sliding window size). Mining sequential pat- terns implying gene regulations across fixed time points may cause the resulting patterns inadequate because the response times among a set of genes through transcrip- tion regulations are not identical. The sliding window size (SWS) parameter can flexibly allow the patterns containing items to be derived from the same/different time points. Here we show you an example extended from Table 4. Table 6 shows the projected databases of length-1 CTGR-SPswhen the SWS is set as 1. Once the time intervals between the transactions contained in the length-1-projected databases and the prefixes not exceed 1 (SWS = 1), the transactions-involved items and the prefixesmay actually take place at the same time point.
In this case, the gene items involved in a-prime-symbol- marked transactions indicate that they occur with the Table 5 Comparison of patterns between a traditional pattern-growth-based approach and CTGR-Span
Prefixes Traditional projected databases Projected databases of CTGR-Span Traditional sequential patterns CTGR-SPs G1+ <(G2-G3+)2(G3+)3>
<(_G4-)1(G3+)2(G2-
<(G2-G3+)2(G3+)3>
<(G3+)2(G2-G3+)4(G5+)5>
<(G1+)(G2-)>
<(G1+)(G3+)>
<(G1+)(G2-)>
<(G1+)(G3+)>
G3+)4(G5+)5> <(G2-G3+)3> <(G1+)(G2-G3+)>* <(G1+)(G3+)(G3+)>
<(_G2-)2(G2-G3+)3> <(G2-G3+)3> <(G1+)(G3+)(G3+)>
<(_G3+G6-)2(G2-G3+)3>
G2- <(_G3+)2(G3+)3> <(G3+)3> <(G2-)(G3+)> <(G2-)(G3+)>
<(_G3+)4(G5+)5> <(G5+)5> <(G2-G3+)>*
<(G2-G3+)3>
<(_G3+)3>
<(G2-G3+)3>
<>
G3+ <(G3+)3> <(G3+)3> <(G3+)(G3+)> <(G3+)(G3+)>
<(G2-G3+)4(G5+)5>
<>
<(G2-G3+)4(G5+)5>
<>
<(G3+)(G2-)>
<(G3+)(G2-G3+)>*
<(G3+)(G2-)>
<(G6-)2(G2-G3+)3> <(G2-G3+)3>
G+/-: significantly up- or down-regulated gene item; <>: a sequence; ()t: a transaction of time point t; _: indexed prefix; *: redundant patterns derived from traditional pattern-growth-based sequential pattern mining methods.
Figure 1 Average transaction lengths of converted transactional databases. N: converted transactional databases; HG: filter transactions of the converted transactional databases using a housekeeping gene database.
prefixesat the same time point even if all of them origi- nate from different time points.
maxTC (maximum time constraint). Normally, the cells need to react quickly to resist adverse environmental changes, massive short-term gene regulations should be more pronounced within a cellular signaling transduction.
In this regard, when setting smaller values of the parameter maxTC, a pattern containing two gene items with a big time gap will not be generated. Table 7 shows the length-1- projected databases and CTGR-SPs from an extended example of Table 4 when maxTC is set as 1. The possible postfixesfor generating length-2 CTGR-SPs only will be checked till the transactions marked with a prime symbol.
Results and discussion
In this section, we presented the experimental results of the proposed CTGR-Span of two time course gene
expression datasets. Because performing the program with different parameter values would yield diverse results, all of the parameters used in this study will be tuned according to the biological backgrounds of the datasets. By introducing the tuned parameter values to the CTGR-Span, the resultant CTGR-SPs will then be evaluated with previous literature and a GO enrichment analysis to reveal their reliability in biology. Meanwhile, in terms of the performance, the execution efficacy between the traditional and our proposed methods will also be examined in this study.
Optimal parameter tuning
In addition to the inherent parameter minSupp of the traditional methods, we additionally introduced 3 para- meters minTSupp, SWS and maxTC to the CTGR-Span.
However, two questions might arise as to how to set these parameter values for most biologists and whether these parameters are useful for mining gene regulations.
In this section, we performed an optimal parameter tun- ing process to obtain a general rule for setting the para- meters without additionally calculating the standard deviations of the time intervals of a dataset in advance [19]. Based on the impact degree of each parameter set- ting to the numbers of the resulting CTGR-SPs, we exam- ined the parameters in an order of minTSupp (Table 8 and Supplementary Table 1 to 3 in Additional file 1), minSupp(Table 8 and Supplementary Table 1 to 3 in Additional file 1), maxTC (Table 9 and 10) and SWS (Table 11 and 12). Several characteristics of the mined CTGR-SPsof two input datasets are presented in these tables. However, here arises a question as to how to judge which condition (combination of parameter values) is more suitable for further exploration - it is a trade-off that higher parameter values would allow fewer patterns to be mined, but lower parameter values would dramati- cally increase the number of marginal patterns. Both quantity and quality of the resultant patterns are neces- sary to be taken into account in this work. In the first dataset (GSE6377), McDunn et al. have proven that as the ventilator associated pneumonia (VAP) patients recovered from critical illness complicated by acute infec- tion, the general trajectory (riboleukogram) converged, consistent with an immune attractor [3]. Eighty five genes involved in the inflammatory response were identi- fied with consistent changes in abundance during seven days bracketing the diagnosis of VAP. For the other data- set (GSE11342), Taylor et al. identified 85 significantly up/down-regulated genes involved in the immune response from the blood monocytes of hepatitis C patients during the first 10 weeks of treatment with the Peg-interferon alfa-2b plus ribavirin in peripheral [4]. We used a Gene Ontology (GO) enrichment analysis [20] to test if the longest CTGR-SPs-involved at least two genes Table 7 Example ofmaxTC = 1
Prefixes Projected databases CTGR-SPs
G1+ <(G2-G3+)2’(G3+)3> <(G1+)(G2-)>
<(G3+)2’(G2-G3+)4(G5+)5> <(G1+)(G3+)>
<(G2-G3+)3’>
<(G2-G3+)3’>
G2- <(G3+)3’> <(G2-)(G3+)>
<(G5+)5’>
<(G2-G3+)3’>
<>
G3+ <(G3+)3’> <(G3+)(G3+)>
<(G2-G3+)4(G5+)5>
<>
<(G2-G3+)3’>
G+/-: significantly up- or down-regulated gene item; <>: a sequence; ()t: a transaction of time point t; _: indexed prefix; *: redundant patterns derived from traditional pattern-growth-based sequential pattern mining methods.
Table 6 Example ofSWS = 1
Prefixes Projected databases CTGR-SPs
G1+ <(G2-G3+)2’(G3+)3> <(G1+G2-)>
<(G3+)2’(G2- <(G1+G3+)>
G3+)4(G5+)5>
<(G2-G3+)3’>
<(G2-G3+)3’>
G2- <(G3+)3’> <(G2-G3+)>
<(G5+)5’>
<(G2-G3+)3’>
<>
G3+ <(G3+)3’>
<(G2-G3+)4(G5+)5>
<> <(G3+G3+)>
<(G2-G3+)3’>
G+/-: significantly up- or down-regulated gene item; <>: a sequence; ()t: a transaction of time point t; _: indexed prefix; *: redundant patterns derived from traditional pattern-growth-based sequential pattern mining methods.
Table 8 Characteristics of mined sequential patterns (minSupp = variable and minTSupp = 100%)
GSE6377 GSE11342
100% 95% 90% 85% 80% 75% 70% 100% 95% 90% 85% 80% 75% 70%
# of CTGR-SPs 417 426 4,762 5,090 181,295 181,170 6,948,828 32 224 964 3,077 11,105 6,053 17,412
# of longest CTGR-SPs 81 81 59 59 176,552 176,552 208,297 2 28 203 1,717 4 283 4,713
Maximal length of CTGR-SPs 4 4 6 6 6 6 7 4 4 4 4 5 5 5
# of genes in CTGR-SPs 212 211 1,006 996 2,821 2,826 5,313 25 138 466 1,132 2,011 2,801 4,142
# of genes in longest CTGR-SPs 14 14 11 11 214 214 77 2 3 16 67 3 30 160
# of gene pairs in lonest CTGR-SPs 70 70 58 58 4,077 4,077 1,548 4 21 128 672 6 119 1,119
-Log(p-value) 0.34† 0.34† 0.00† 0.00† 0.55† 0.55† 0.29† 0.00†† 1.26†† 0.26†† 0.91†† 0.00†† 1.58†† 4.11††
# of GSP - - - - - - - - - - - - - -
# of PrefixSpan - - - - - - - - - - - - - -
%:minSupp value presented as percentage; †: test longest CTGR-SPs-involved genes in inflammatory response using GO enrichment analysis; ††: test longest CTGR-SPs-involved genes in immune response using GO enrichment analysis; -: no complete patterns.
Table 9 Characteristics of mined sequential patterns in GSE6377 (maxTC = variable, minSupp = 95% and minTSupp = 100%)
2d 3d 4d 5d 6d 7d 8d 9d ≥ 10d
# of CTGR-SPs 157 157 166 166 180 180 298 306 426
# of longest CTGR-SPs 157 157 9 9 17 17 58 58 81
Maximal length of CTGR-SPs 1 1 3 3 4 4 4 4 4
# of genes in CTGR-SPs 157 157 169 169 179 179 201 202 211
# of genes in longest CTGR-SPs 0 0 7 7 10 10 12 12 14
# of gene pairs in lonest CTGR-SPs 0 0 11 11 27 27 50 50 70
-Log(p-value)† - - 0 0 0 0 0 0 0.34
d: # of days of SWS;†: test longest CTGR-SPs-involved genes in inflammatory response using GO enrichment analysis; -: no p-values.
Table 10 Characteristics of mined sequential patterns in GSE11342 (maxTC = variable, minSupp = 95% and minTSupp = 100%)
28d 31d 34d 37d 40d 43d 46d 49d 52d 55d 58d 61d 64d ≥ 67d
# of CTGR-SPs 112 112 120 126 157 165 160 163 163 161 194 194 220 242
# of longest CTGR-SPs 112 112 8 14 45 2 2 2 2 2 28 28 28 28
Maximal length of CTGR-SPs 1 1 3 3 3 4 4 4 4 4 4 4 4 4
# of genes in CTGR-SPs 112 112 119 123 132 132 132 132 132 132 136 135 136 140
# of genes in longest CTGR-SPs 0 0 4 6 14 2 2 2 2 2 3 3 3 3
# of gene pairs in lonest CTGR-SPs 0 0 7 11 42 4 4 4 4 4 21 21 21 21
-Log(p-value)†† - - 1.02 0.74 0.40 0 0 0 0 0 1.31 1.31 1.31 1.31
d: # of days of SWS;††: test longest CTGR-SPs-involved genes in immune response using GO enrichment analysis; -: no p-values.
Table 11 Characteristics of mined sequential patterns in GSE6377 (SWS = variable, maxTC = ∞ days, minSupp = 95%
andminTSupp = 100%)
0d 1d 2d 3d 4d 5d 6d 7d 8d 9d ≥ 10d
# of CTGR-SPs 352 419 203 203 169 169 201 189 279 354 423
# of longest CTGR-SPs 81 81 46 46 3 3 201 189 279 354 423
Maximal length of CTGR-SPs 4 4 3 3 2 2 1 1 1 1 1
# of genes in CTGR-SPs 206 212 178 178 174 174 187 183 197 209 213
# of genes in longest CTGR-SPs 14 14 11 11 2 2 11 9 15 20 21
# of gene pairs in lonest CTGR-SPs 70 70 33 33 5 5 0 0 0 0 0
-Log(p-value)† 0.37 0.37 0.44 0.44 0.44 0.44 - - - - -
d: # of days of SWS;†: test longest CTGR-SPs-involved genes in inflammatory response using GO enrichment analysis; -: no p-values.
under the conditions are relevant to the corresponding biological manifestations (inflammatory response in GSE6377 and immune response in GSE11342). We focused on the longest CTGR-SPs containing at least two gene items because the longer patterns not only con- tained more significant gene items but also carried more information in a consecutive gene regulation according to the original design of the algorithm. The testing results are presented as -log(p-value) in the tables.
First of all, if the same significant gene items occur too frequent during a time period, they may be similar to the HGs. Then, the significant patterns should occur as frequently as possible in a group of patients. For these two reasons, we tested both minTSupp and minSupp from 70% to 100% as shown in Table 8 and Supplemen- tary Table 1 to 3 in Additional file 1. Apparently, the longest CTGR-SPs revealed no biologically significant when minTSupp was set as 70% or 80% regardless of the values of minSupp. Although the minTSupp was set as 90%, the common values of minSupp suitable for these two input datasets were 85%, 80%, 75% and 70%.
Unfortunately, the number of genes involved in the CTGR-SPswas too high (over 250 patterns). It might be difficult for most biologists to work with the high num- ber. In spite of these limitations, we could still success- fully obtain a suitable common condition for the two datasets when minTSupp and minSupp were set as 100% and 95%, respectively.
Once the values of minTSupp and minSupp have been decided, we subsequently tested all possible values of maxTC in both two datasets as shown in Table 9 (GSE6377) and Table 10 (GSE11342). The maxTC was set from the beginning as largest time interval, 2 days (21-19) in GSE6377 and 28 days (70-42) in GSE11342, to the end as the values which included most transac- tions bracketing the maximal time interval, 10 days (21- 11) in GSE6377 and 67 days (70-3) in GSE11342. For each dataset, the maxTC would be increased with the first minimum time interval, 1 day (1-0) in GSE6377 and 3 days (3-0) in GSE11342, to ensure any possible conditions would be tested. Apparently, according to the same criteria mentioned in the above paragraph, there was a suitable common condition for the two datasets when the values of maxTC were set as∞ days.
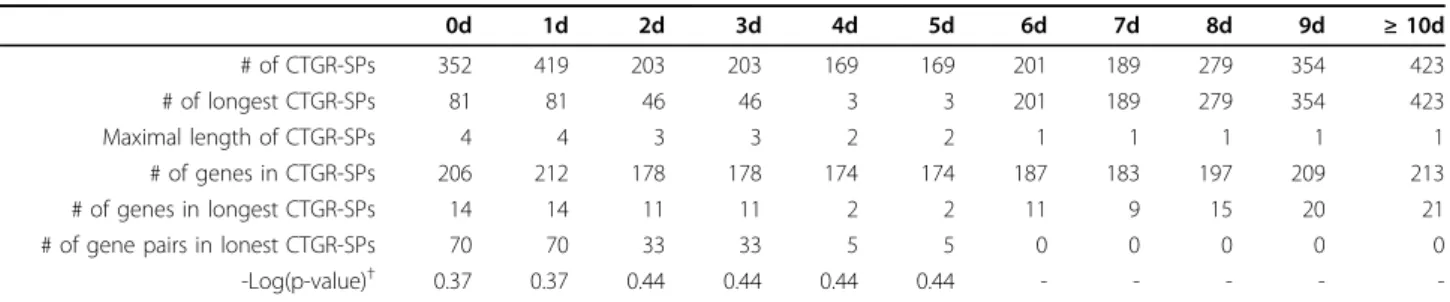
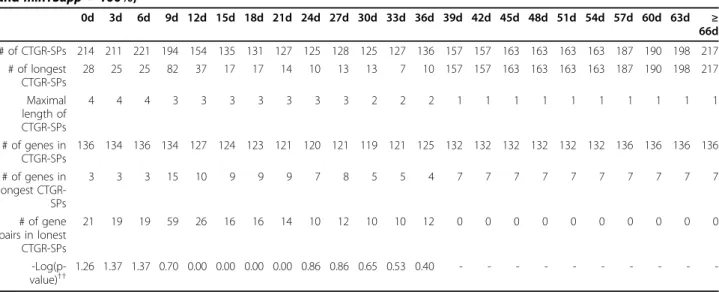
Finally, we fixed the previous three parameter values and tested the SWS as shown in Table 11 (GSE6377) and Table 12 (GSE11342). The values of SWS in both datasets were set from the beginning as 0 to the end as the values which included most transactions bracketing the maximal time interval, 10 days in GSE3677 and 66 days in GSE11342. The values of SWS were also increased with a fixed interval. Then, we could success- fully observe a suitable common condition when the value of SWS was set as 3 days. These tables also
demonstrate that these suitable common conditions were neither the rule number nor rule length depen- dent. Incorporating with the domain knowledge of bio- logy to the parameter designs might had a great benefit on discovering the CTGR-SPs with potential gene regu- lations. Therefore, these optimal parameter values could be certainly considered as the default settings to most biologists even if they have no any experiences before.
High performance ofCTGR-Span
In this section, we compared the performance of our proposed CTGR-Span and the traditional sequential pat- tern mining algorithms such as the GSP and PrefixSpan in terms of execution efficiency. For achieving a fair comparison, we performed the GSP, PrefixSpan and CTGR-Spanwith same parameter settings on both input datasets. The resultant patterns and execution times are presented in Table 8 and Table 13 respectively. How- ever, the traditional algorithms did not allow complete patterns (indicated with “-” in Table 8) to be identified in 2 weeks. Meanwhile, their patterns already have pro- duced tens of millions of patterns. It might be compli- cated for biologist for find further usage of such massive patters. In contrast, our proposed CTGR-Span only needed to take several hours in a worst case that the minSupp was set as 70%. (Table 13). These results clearly showed the efficiency of CTGR-Span.
Evaluation with literature
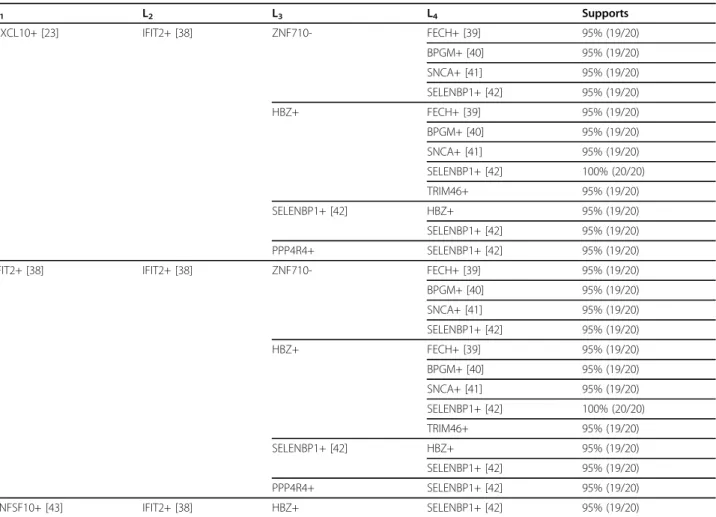
After performing the optimal parameter tuning process, we set the parameter SWS = 3 days, maxTC = ∞ days, minSupp = 95% and minTSupp = 100% for the further exploration of CTGR-SPs in biology. As stated in the section of optimal parameter tuning, the evaluation cri- teria for GO enrichment analysis were based on the experimental backgrounds of those two datasets to preli- minarily test which condition with longest CTGR-SPs- involved genes is much related to the inflammatory response caused by the ventilator-associated pneumonia (GSE6377) and the immune response after drug treat- ments in hepatitis C patients (GSE11342). In this sec- tion, we attempted to further address whether these patterns contain potential genes/regulations which have not been reported in previous literature yet. We scruti- nized and evaluated the longest CTGR-SPs derived genes from the two input datasets using a manual litera- ture survey. Table 14 and Table 15 show the evaluation results of GSE6377 and GSE11342, respectively. If the patterns contain same items, they will be presented as a single item from left (prefix) to right. For example, in the top-4 data rows of Table 14, there are 4 CAV1+-pre- fixed CTGR-SPs: <(CAV1+)(GNG7+)(EIF2D+)>, <(CAV1
+)(GNG7+)(FTSJ2+)>, <(CAV1+)(GNG7+)(NR2E1-)> and
<(CAV+)(GNG7+)(TMOD3-)>. The CAV1+ and GNG7+
![Table 14 Longest CTGR-SPs of GSE6377 (SWS = 3 days, maxTC = ∞ days, minSupp = 95% and minTSupp = 100%) I 1 I 2 I 3 Supports CAV1+ [21] GNG7+ EIF2D+ [24] 100% (11/11) FTSJ2+ 100% (11/11) NR2E1- [22] 100% (11/11) TMOD3- [25] 100% (11/11) CCL20- [26] KIF4A+ [](https://thumb-ap.123doks.com/thumbv2/9libinfo/9324932.536255/10.892.80.809.139.1089/table-longest-ctgr-maxtc-minsupp-mintsupp-supports-ftsj.webp)