行政院國家科學委員會專題研究計畫 成果報告
化妝品與藥品中偶氮染料測定方法之研究 研究成果報告(精簡版)
計 畫 類 別 : 個別型
計 畫 編 號 : NSC 95-2113-M-041-002-
執 行 期 間 : 95 年 08 月 01 日至 96 年 07 月 31 日 執 行 單 位 : 嘉南藥理科技大學醫藥化學系
計 畫 主 持 人 : 王來好
計畫參與人員: 大學生-兼任助理:李怡潔
處 理 方 式 : 本計畫涉及專利或其他智慧財產權,2 年後可公開查詢
中 華 民 國 96 年 10 月 12 日
行政院國家科學委員會補助專題研究計畫 ˇ□ 成 果 報 告
□期中進度報告
化妝品與藥品中偶氮染料測定方法之研究
計畫類別:ˇ□ 個別型計畫 □ 整合型計畫
計畫編號:NSC 95 -2113 -M -041 -002
執行期間:95 年 8 月 01 日至 96 年 7 月 31 日 計畫主持人:王來好
共同主持人:
計畫參與人員:
成果報告類型(依經費核定清單規定繳交):□精簡報告 # □完整 報告
本成果報告包括以下應繳交之附件:
□赴國外出差或研習心得報告一份
□赴大陸地區出差或研習心得報告一份
□出席國際學術會議心得報告及發表之論文各一份
□國際合作研究計畫國外研究報告書一份
處理方式:除產學合作研究計畫、提升產業技術及人才培育研究 計畫、列管計畫及下列情形者外,得立即公開查詢 □涉及專利或其他智慧財產權,□一年□二年後可公
開查詢
執行單位:嘉南藥理科技大學醫藥化學系
中 華 民 國 96 年 10 月 12 日
政院國家科學委員會專題研究計畫成果報告
化妝品與藥品中偶氮染料測定方法之研究計畫編號:NSC 95-2113-M-041-00 計畫主持人:王來好
中文摘要
利 用 電 化 學 連 線 石 英 晶 體 微 天 平 (Electrochemical Quartz Crystal Microbalance, EQCM),分別在 9 MHz 銀與金之石英晶體及各種金屬 Zn、
Pb、Sb、Cu、Cr、Sn 與 Ni 電沉積於 金、銀晶體表面形成金屬薄膜,探討 含 偶 氮 基 (N=N) 染 料 (D&C Orange No:4)之還原反應機制。結果顯示 Zn、
Pb、Sb 與 Cd 之電催化性質優於其他金 屬 。 且 原 子 力 顯 微 術 (Atomic force microscopy, AFM)與電子掃瞄顯微術 (scanning electron microscopy, SEM)之 影像有染料吸附在金屬修飾晶體的表 面。在石墨、銀與金載體表面,以共 電 沉 積 方 法 製 備 Sb-Cd, Sb-Zn 與 Sb-Pb 表面合金電催化劑,並應用於偶 氮基染料之測定。合金可促進染料在 電 極 之 靈 敏 度 , 其 靈 敏 度 次 序 為 Sb-Cd /Ag > Sb-Zn /Ag> Sb-Pb /Ag
>Ag.
Abstract
The electroreduction of azo dye(D&C orange No 4)was performed on silver/quartz, and gold/quartz, and was electrochemical deposition various metals films (lead, zinc, copper, tin, antimony, cadmium, nickel) on silver/quartz and gold/quartz substrates, and was investigated by electrochemical
quartz crystal microbalance (EQCM) with AT-cut, 9 MHz quartz crystals. The results demonstrated that the electrocatalytic property of antimony is the best than other metals. In addition, atomic force microscopy, AFM) and scanning electron microscopy, SEM) images clearly showed the structure of adsorbed D&C orange No 4 molecule layers on metal modified silver/quartz and gold/quartz electrodes. The electrocatalysts of silver quartz crystal based Sb-Cd , Sb-Zn and Sb-Pb surface alloy were prepared by codeposition and the sensitivity of alloy is higher than Ag.
The order is Sb-Cd /Ag > Sb-Zn /Ag>
Sb-Pb /Ag >Ag.
報告內容 前言
The name of the azo dyes because a molecular group consisting of one or more azo group (- N=N-) bridges linking substituted aromatic structures. Today, azo colorants account for more than 40 % of the world production of organic colorants. There have been at least 3000 kinds of azo dyes used for various purposes in the textiles, leathers, food, pharmaceutical and cosmetic industries.
Although azo dyes with an in vitro technique for the prediction of
percutaneous penetration/dermal
absorption were evaluated and shown to have limited bioavailability [1]. When azo dyes enter into the human body, they split into corresponding aromatic amines by liver enzymes and intestinal
microflora. Many aromatic amines are mutagenic and/or carcinogenic [2-10].
Biodegradation of azo dyes is generally by azo-bond reduction during anaerobic digestion and generates aromatic amines [11-12]. Azo dyes such as D&C Brown No. 1, D&C Orange No. 4, D&C Red No. 6, D&C Red No. 7, D&C Red No.
17, D&C Red No. 31, D&C Red No. 34, D&C Red No. 36 have listed in
“Cosmetics Unmasked Ingredients”
there is a potential risk associated with these ingredient. Some of azo dyes such as CI 12150, CI 20170, CI 27290 and CI 26100 can form carcinogenic amines upon metabolism in the gut by the SCCNFP (Scientific Committee Cosmetic Non-Food Products), poses a risk to the health of the consumer.
研究目的
Methods for the quantitative detection and characterization of azo dyes are electronic spectroscopy [13], infrared spectroscopy [14], mass spectroscopy [15-16], gas chromatography/mass spectroscopy [17], high-performance liquid chromatography with UV-Vis detector and mass detector [19-21], and electrochemical methods [22-25].
Although, spectroscopy provides a rapid analysis and mechanism elucidate such
as photodegration and biodegradation by means of hydroxylation, oxidation and hydrolysis. Solvent effects are
significant absorption due to the
conjugation between azobenzene and the aromatic ring system. Thus, the
measurement azobenzene derivatives in various solvent, is difficult selection.
Much of the previous MS work on sulfonated azo dyes has focused on screening procedures by detection of structurally diagnostic fragmentions.
Since azo dyes are highly ionic materials several sulfonic acid groups per
molecule. HPLC has been used for the analysis of highly polar components. To detect azo dyes in waste water and animal skin carcinogenesis test, and hence the need for trace analysis, has encouraged the development of coupled liquid chromatography methods with several ionization techniques. Synthetic azo dyes are soluble disodium salt and /or calcium lake pigment. Non-volatile salts are not compatible with MS
detection due to the deposition of salts in the ion source, resulting in the
instrument failure. The aim of the present study was to design a solid electrode, such as Sb-Cd, Sb-Zn, Sb-Pb surface alloy at gold or silver as the working electrode, and to develop an electrochemical analytical method
文獻探討
1. Steiling, Winfried, The bioavailability of cationic azo hair dyes: Application of a new in vitro method.ATLA,
Alternatives to Laboratory Animals, 32(Suppl. 1B), 689-692,2004.
2. Hubner, K.; Schmalz, E.; Rossbach, V., Identification of potentially carcinogenic azo dyes by the PADIS analysis system. Melliand Textilber., 78(10), 720,722-724,E161-E163, 1997
3. Chung, King-Thom , Mutagenicity and carcinogenicity of aromatic amines metabolically produced from azo dyes,Environ. Carcinog.
Ecotoxicol. Rev., C18 (1), 51-74 (English) 2000
4. O'Neill, C.; Hawkes, F. R.; Lopez, A.;
Esteves, S.; Hawkes, D. L.; Wilcox, S., Azo-dye degradation in an
anaerobic-aerobic treatment system operating on simulated textile effluent. , Appl. Microbiol.
Biotechnol., 53(2),249-254 (English) 2000.
5. Garg, Ashish; Bhat, Krishna L.; Bock, Charles W., Mutagenicity of
aminoazobenzene dyes and related structures: a QSAR/QPAR
investigation.,Dyes and Pigments, 55(1), 35-52, 2002.
6. Bhaskar, Malayappan; Gnanamani, Arumugam; Ganeshjeevan, Rama Jeevan; Chandrasekar, Raghavan;
Sadulla, Sayeed; Radhakrishnan, Ganga, Analyses of carcinogenic aromatic amines released from harmful azo colorants by
Streptomyces SP. SS07.,Journal of Chromatography, A, 1018(1),117-123, 2003.
7. Gnanamani, A.; Bhaskar, M.; Ganga, Radhakrishnan; Sekaran, G.; Sadulla, S., Chemical and enzymatic
interactions of Direct Black 38 and Direct Brown 1 on release of
carcinogenic amines. Chemosphere, 56(9), 833-841,2004.
8. Sponza, Delia Teresa; Isik, Mustafa, Decolorization and inhibition kinetic of Direct Black 38 azo dye with granulated anaerobic sludge., Enzyme and Microbial Technology, 34(2), 147-158, 2004.
9. Ottrstaetter, Glsbert, Azo dyes - a clarification -.Dragoco Rep. (5), 165, 1999.
10. Hildenbrand, S.; Schmahl, F. W.;
Wodarz, R.; Kimmel, R.; Dartsch, P.
C., Azo dyes and carcinogenic aromatic amines in cell cultures. Int.
Arch. Occup. Environ. Health, 72(Suppl.), M52-M56,1999.
11 Kapadia, Govind J.; Tokuda, Harukuni;
Sridhar, Rajagopalan;
Balasubramanian, Venkataraman;
Takayasu, Junko; Bu, Ping; Enjo,
Fumio; Takasaki, Midori; Konoshima, Takao; Nishino, Hoyoku, Cancer chemopreventive activity of synthetic colorants used in foods,
pharmaceuticals and cosmetic preparations.Cancer Lett. (Shannon, Irel.), 129(1), 87-95, 1998.
12.Chung, King-Thom ,Review of the mutagenicity, carcinogenicity and autoimmunity of azo dyes and their metabolites from the perspective of their
structure-activity
relationships.,Huanjing Yu Zhiye Yixue, 21(1), 58-62 ,2004.
13. Airinei, Anton; Rusu, Elena; Dorohoi, Dana , Solvent influence on the
electronic absorption spectra of some azo aromatic compounds, Spectrosc.
Lett., 34(1), 65-74 , 2001.
14. Pielesz, A., The process of the reduction of azo dyes used in dyeing textiles on the basis of infrared spectroscopy analysis. J. Mol. Struct., 511-512, 337-344 , 1999.
15. Sullivan, Anthony G.; Gaskell, Simon ,The analysis of polysulfonated azo dyes by matrix-assisted laser desorption/ionization and electrospray mass spectrometry, J. Rapid Commun.
Mass Spectrom., 11(7), 803-809, 1997.
16. Sullivan, Anthony. G.; Garner, Robert;
Gaskell, Simon. J..Structural analysis of sulfonated monoazo dyestuff
intermediates by electrospray tandem mass spectrometry and matrix-assisted laser desorption/ionization post-source decay mass spectrometry, Rapid Commun. Mass Spectrom.,12(17), 1207-1215, 1998.
17. Cioni, Fabio; Bartolucci, Gianluca;
Pieraccini, Giuseppe; Meloni, Stefano; Moneti, Gloriano, Development of a solid phase
microextraction method f or detection of the use of banned azo dyes in colored textiles and leather, Rapid Commun.
Mass Spectrom.,13(18), 1833-1837, 1999.
18. Gennaro, M. C.; Gioannini, E.;
Angelino, S.; Aigotti, R.; Giacosa, D., Identification and determination of red dyes in confectionery by ion-interaction high-performance liquid
chromatography.,J. Chromatogr., A, 767(1 + 2), 87-92 , 1997.
19. Rafols, Clara; Barcelo, Damia, Determination of mono- and disulfonated azo dyes by liquid
chromatography-atmospheric pressure ionization mass spectrometry, J.
Chromatogr., A, 777(1), 177-192, 1997.
20. Holcapek, Michal; Jandera, Pavel;
Prikryl, Josef.,Analysis of sulphonated dyes and intermediates by electrospray mass spectrometry, Dyes Pigm., 43(2),127-137, 1999.
21. Fuh, Ming-Ren; Chia, Kan-Jung, Determination of sulfonated azo dyes in food by ion-pair liquid
chromatography with photodiode array and electrospray mass spectrometry detection. Talanta, 56(4), 663-671, 2002.
22.T. Bechtold, E. Burtscher, A. Turcanu, Direct cathodic reduction of Leuco sulfur Black 1 and sulfur Black 1, J.
Appli.Electrochem., 28,1243-1250,1998.
23.Zhemin Shen, Wenhua Wang, Jinping Jia, Jianchang Ye, Xue Feng, An Peng, Degradation of dye solution by an activated carbon fiber electrode electrolysis system, J. Hazard.
Mater.B84, 107-116(2001).
24. Guaratini, C. C. I.; Fogg, A. G.; Zanoni, M. V. B ,Assessment of the application of cathodic stripping voltammetry to the
analysis of diazo reactive dyes and their hydrolysis products., Dyes and
Pigments, 50(3), 211-221, 2001.
25. Lopez-De-Alba, Pedro Luis;
Lopez-Martinez, Leticia;
De-Leon-Rodriguez, Luis
Manuel ,Simultaneous determination of synthetic dyes tartrazine, allura red and sunset yellow by differential pulse polarography and partial least squares.
A multivariate calibration method, Electroanalysis, 14(3), 197-205, 2002.
26. Borges, Gary L.; Kanazawa, K. Keiji;
Gordon, Joseph G., II; Ashley, Kevin;
Richer, Jocelyn, An in-situ electrochemical quartz crystal microbalance study of the
underpotential deposition of copper on Au(111) electrodes J. Electroanal.
Chem., 364(1-2), 281-4 (English) 1994.
27 Yamamoto, Nobushige; Yamane, Tetsuya; Tatsuma, Tetsu; Oyama, Noboru, In-situ and ex-situ monitoring of electrochemical deposition of silver using quartz crystal resonators, Bull. Chem. Soc.
Jpn., 68(6), 1641-5 (English) 1995.
28 Matsushima, J. T.; Trivinho-Strixino, F.;
Pereira, E. C., Investigation of cobalt deposition using the electrochemical quartz crystal microbalance,
Electrochimica Acta, 51(10),1960-1966,2006
29 Marlot, A.; Vedel, J., Electrodeposition of copper-selenium compounds onto gold using a rotating electrochemical quartz crystal microbalance.J.
Electrochem. Soc., 146(1), 177-183 (English) 1999
30 Kelly, J. J.; Kern, P.; Landolt, D.
Electrochemical quartz crystal
microbalance study of additive effects in pulsed deposition of Cu-Co alloys, J.
Electrochem. Soc., 147(10), 3725-3729 (English) 2000
31. K. C. Cho; S. K. Yoon; M. C. Jung; H Kim; Stable mercury films on gold for the electrochemical quartz crystal microbalance, Colloids Surfaces A, 134, 1998, 59-65.
研究方法 Experimental
Materials and reagents The sample of
4-[(2-hydroxy-1-naphthyl)azo]
benzenesulfonic acid monosodium salt (D&C orange No:4; CI:15510) was from Sensient cosmetic technologies low.
Other chemical reagents used were of analytical grade.
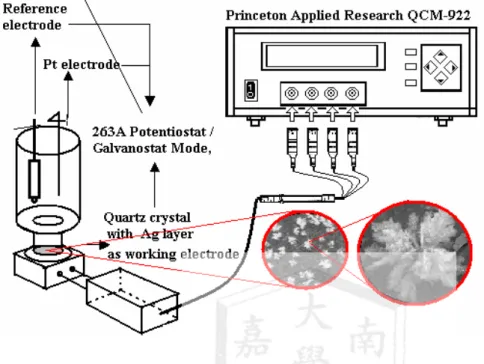
Apparatus
Electrochemical experiments were made with an EG&G Princeton Applied Research Model 394 Polarographic Analyzer (Princeton, NJ, USA) or 263 A potentiostat /galvanostat. The
electrochemical quartz crystal
microbalance (EQCM) system consisted of a 263 A potentiostat /galvanostat, which was coupled to a Seiko/ EG&G model QCA 922 quartz crystal analyzer.
The QCM cell was manufactured in a home- made and connected to QA-CL4 Well Type Quartz Crystal Holder
(Seiko).The crystal was mounted in the holder and connected with the
QCA922-10 Adapter Cable. When quartz crystal is immersed into the solution, only one side of the crystal was exposed to the electrolyte solution and used as the sensing surface that enables measurements of small changes in mass and in viscosity of the liquid. The 9 MHz quartz crystal used for working electrode substrate (geometric area is 0.196 cm2) was purchased from Seiko Japan, which gold or silver 300 nm sputtered onto a titanium layer (100 nm)on a quartz crystal. A platinum wire counter and a Ag/AgCl reference
electrode (Model RE-1, BAS) completed the electrochemical set-up.
Preparation working electrodes Metals (lead, zinc, copper, tin, antimony, cadmium and nickel) were deposited potentiostatically onto the Ag and Au electrodes of the quartz exposed to 0.1 M acetate buffer, and the
resonance frequency of the quartz was monitored. QCM crystals covered with a thin layer of metals and were the
subsequent voltammetric studies. The accumulation of D&C orange No 4 on M/Ag quartz, or M/Au quartz was made between 0.2 and – 1.0 V.
結果與討論
D&C orange No 4 on Ag/quartz and Au/quartz
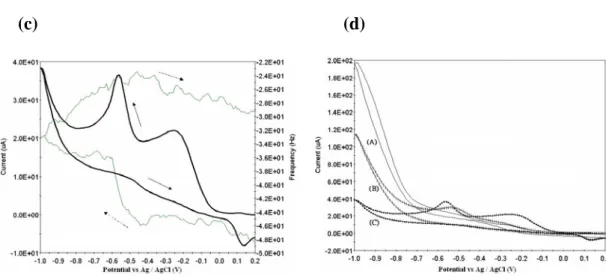
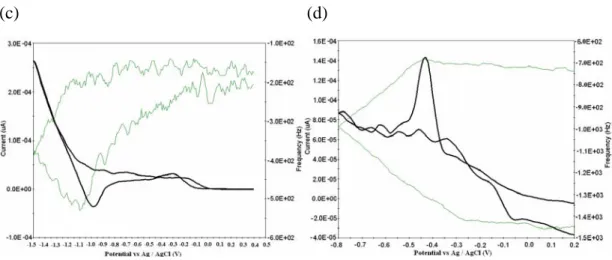
Fig. 2(a), (b), (c) and (d) depicts the cyclic voltammogram (CV) and
frequency shift (Δf) of D&C orange No
4 (4.34×10⁻⁴ mole L-1) on a Ag (K.C.C), Ag(Seiko) and Au(Seiko) quartz crystals in the potential region between 0.2 and -1.0 V, respectively. It can be seen in Fig. 2 that frequency decreases during the CV process, i.e., mass on the electrode increases, which means D&C orange No 4 is adsorbed on the electrode.
The sharp frequency shift and peak current on a Ag(Seiko) is higher than the other. CV obtained using the standard addition method (the regression equations used was y = 0.1222 x + 11.16; the correlation coefficient was r = 0.9998; and y = 0.1387 x + 16.37 r
=0.9990 for Au and Ag electrodes, respectively) showed a well-defined reduction peak. The calibration graphs were linear for D&C orange No 4 over the range of concentrations used (0.567 - 8.25 × 10⁻⁴
M
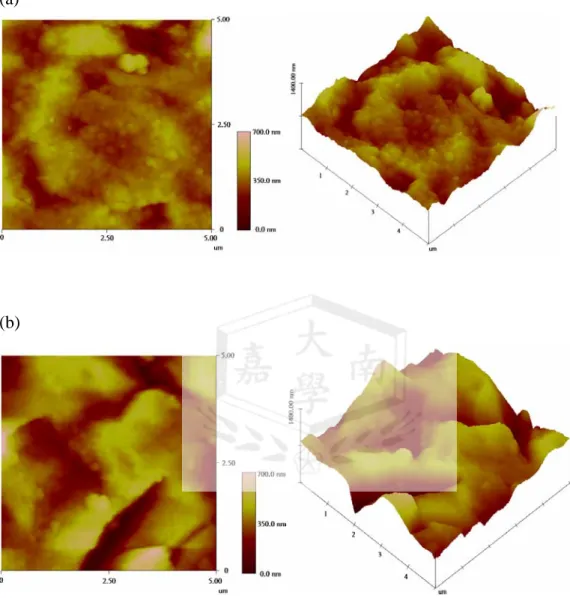
), and a representative CVs on a Ag electrode were shown in Fig. 3. The adsorption of D&C orange No 4 to Ag/QCM was also examined using AFM (AFM, NanoManNS4+D3100) and shown in Fig. 4 a and b. The azo dye absorption formed island (b), rather than a film surface of uniform thickness (a).
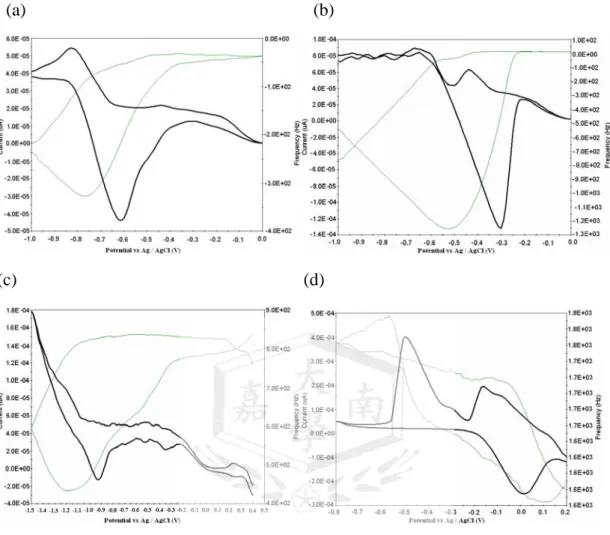
Surface alloy electrodes
Thin film of metals (Zn, Pb, Sb, Cu, Cd, Sn and Ni) deposited on the silver and gold electrodes, respectively. Fig.5 and 6 show frequency shifts data and CV recorded at a Au and Ag - coated quartz crystal electrodes as a function of scanning potential in 0.1 M acetate
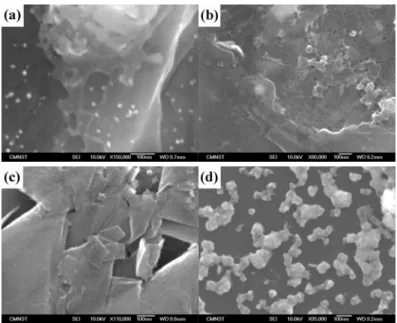
buffer solution. It is apparent from Fig. 5 and 6 the frequency responses change significantly for Pb, Sb, Cd, and Zn deposition on electrodes. These results are in agreement with voltammetric evidence, that the electrocatalytic properties of Pb, Sb, Cd, and Zn are superior to the other metals at Ag, Au and graphite electrodes. For comparision modified electrode substance, four pictures of scanning electron microscope (FE-SEM, JEOL: JSM- 7000) shown in Fig.7 A, B and C. It is can be seen Sb nanoparticles were distributed more uniformly and apparent in Ag, Au and graphite electrodes than the other metals, respectively. The Zn particles (smaller than 100 nm) were dispersed with very slight aggregation, as seen in Fig.7C, because of Zn weak absorption on the surface graphite. However, the particles of Sb on the surface graphite were dispersed more aggregation than the other metal on the surface graphite
The surface morphology of a Zn/Ag/QCM and Sb/Ag/QCM nanoparticle hybrid films were investigated by atomic force microscopy that can provide molecular imaging. The Fig. 8 a and 8b show AFM images of a Zn/Ag/QCM and Sb/Ag/QCM, respectively. The Sb diameter ( ~500 nm) on the Ag/QCM surface (Fig.8b) is smaller than Zn ( ~ 600nm) on the Ag/QCM (Fig.8a). To confirm the electroanalytical utility of Sb/Ag nano-composite electrode, we studied
the electrochemical experiments the antimony had diameters in the range 250
~500 nm, and in cyclic voltammograms.
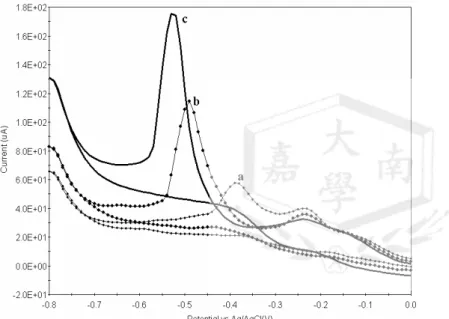
It was found that Sb-Cd /Ag film gave a better performance than Sb-Pb/Ag and Sb-Zn/Ag, and were chosen for use in the determination of azo dyes. The calibration graphs were linear for D&C orange No 4 over the range of concentrations used (4.34 - 15.1×10⁻⁴M), and a representative CVs on a Sb-Cd /Ag alloy electrode were shown in Fig.9.
The sensitivity of Sb-Cd /Ag alloy(y=0.4244x+0.077) is higher than Ag (y = 0.1387 x + 16.37). The order is Sb-Cd /Ag > Sb-Zn /Ag> Sb-Pb /Ag
>Ag.
Conclusions
The EQCM response from the cyclic voltammogramms has been demonstrate for seven underpotential deposition (UDP)systems, i.e., Pb , Zn, Cu, Sn, Sb, Cd , Ni and their alloys on Ag and Au quartz crystal electrodes, respectively.
These electrodes were applied to absorb process of azo dye D&C orange No 4 and used as a sensitive, dynamic, piezoelectric sensor.
Acknowledgments
Financial support of this work by the National Science Council of the
Republic of Chia (NSC
95-2113-M-041-002) is gratefully acknowledged.
Fig. 1 Schematic representation of the experimental set up
(a) (b)
(c) (d)
Fig. 2 Potentiodynamic simultaneous recording of current and frequency of D&C orange No 4 (4.34×10⁻⁴ mole L-1) on a (a) Ag(K.C.C.),(b) Au(Seiko), and (c) Ag(Seiko) (d) Cyclic voltammograms at a different Ag, Au(Seiko), and Ag(Seiko) EQCM electrodes in 0.1 mole L-1 acetate buffer solution, sweep rate at 25 mV/s.
Fig. 3 Cyclic voltammograms of different concentrations at a Ag electrode and related current-concentration curve: (a) 0.567×10⁻⁵; (b)
1.127x10
-4;(c)
2.22×10⁻⁴(d)
4.34×10⁻⁴; (e)
8.25×10⁻⁴M
in 0.1 mole L-1 acetate buffer solution, sweep rate at 25 mV/s.
(a)
(b)
Fig. 4 AFM 2D and 3D images of (a) silver coated QCM; (b) azo dye/silver coated QCM.
(a) (b)
(c) (d)
Fig. 5 Potentiodynamic simultaneous recording of current and frequency of metals on a Ag surface (a) Cd /Ag (b) Pb/Ag(c) Zn/Ag (d) Sb/Ag alloy EQCM electrodes in 0.1 mole L-1 acetate buffer solution, sweep rate at 25 mV/s.
(a) (b)
(c) (d)
Fig. 6 Potentiodynamic simultaneous recording of current and frequency of metals on a Ag surface (a) Cd /Au (b) Pb/Au(c) Zn/Au (d) Sb/Au alloy EQCM electrodes in 0.1 mole L-1 acetate buffer solution, sweep rate at 25 mV/s.
Fig. 7 A SEM (at 10 kV) of metal particles distribution in the Ag surfaces: (a) Cd /Ag (b) Pb/Ag(c) Zn/Ag (d) Sb/Ag alloy EQCM electrodes
Fig. 7 B SEM (at 10 kV) of metal particles distribution in the Au surfaces: (a) Cd /Au (b) Pb/Au(c) Zn/Au (d) Sb/Au alloy EQCM electrodes
Fig. 7 C SEM (at 10 kV) of metal particles distribution in the graphite surfaces: (a) Cd / graphite (b) Pb/ graphite (c) Zn/ graphite (d) Sb/ graphite electrodes
(a)
(b)
Fig. 8 AFM 2D and 3D images of (a) Zn (1 mM)/Ag/QCM); (b) Sb(1 mM)/Ag/QCM).
Fig. 9 Cyclic voltammograms of different concentrations at aSb-Cd/ Ag electrode and related current-concentration curve: (a) 4.34 ×10⁻⁴; (b)8.25
x10
-4;(c)1.51
×10-3(M
in 0.1 mole L-1 acetate buffer solution, sweep rate at 25 mV/s.