s-Allyl Cysteine, s-Ethyl Cysteine and s-Propyl Cysteine Alleviate
1
beta-Amyloid, Glycative and Oxidative Injury in Brain of Mice Treated by
2
D-galactose
3 4 5
SHIH-JEI TSAIø,§, C. PERRY CHIU#, HUI-TING YANG*, MEI-CHIN YIN*,‡ 6
7
øSchool of Medicine, Chung Shan Medical University, Taichung City, Taiwan 8
§Department of Neurology, Chung Shan Medical University Hospital, Taichung City, Taiwan 9
#Department of Food Science, Fu Jen Catholic University, New Taipei City, Taiwan 10
‡Department of Health and Nutrition Biotechnology, Asia University, Taichung City, Taiwan 11
*Department of Nutrition, China Medical University, Taichung City, Taiwan 12
13
Running title: Neuro-protection of SAC and SEC 14
15
*To whom correspondence should be addressed: Dr. Mei-chin Yin, Professor, Department 16
of Nutrition, China Medical University, 16th Floor, 91, Hsueh-shih Rd, Taichung City, 17
Taiwan, R.O.C.
18
TEL: 886-4-22053366 ext. 7510, FAX: 886-4-22062891 19
Email: [email protected] 20
ABSTRACT 1
The neuro-protective effects of s-allyl cysteine, s-ethyl cysteine and s-propyl cysteine in 2
D-galactose (DG) treated mice were examined. DG treatment increased the formation of 3
A1-40 and A1-42, and enhanced mRNA expression of-amyloid precursor protein (APP) 4
and beta-site APP cleavage enzyme 1 (BACE1), and reduced neprilysin expression in 5
brain (P<0.05); however, the intake of three test compounds significantly decreased the 6
production of A1-40and A1-42, and suppressed expression of APP and BACE1 (P<0.05).
7
DG treatments declined brain protein kinase C (PKC) activity and mRNA expression 8
(P<0.05). Intake of test compounds significantly retained PKC activity and the 9
expression of PKC-alpha and PKC-gamma (P<0.05). DG treatments elevated brain 10
activity and mRNA expression of aldose reductase (AR) and sorbitol dehydrogenase, as 11
well as increased brain level of carboxymethyllysine (CML), pentosidine, sorbitol and 12
fructose (P<0.05). Test compounds significantly lowered AR activity, AR expression, 13
and CML and pentosidine levels (P<0.05). DG treatments also significantly increased 14
the formation of reactive oxygen species (ROS) and protein carbonyl; and decreased the 15
activity of glutathione peroxidase (GPX), superoxide dismutase (SOD) and catalase 16
(P<0.05); however, the intake of test compounds in DG-treated mice significantly 17
decreased ROS and protein carbonyl levels, and restored brain GPX, SOD and catalase 18
activities (P<0.05). These findings support that these compounds via their anti-A, 19
anti-glycative and anti-oxidative effects were potent agents against the progression of 20
neurodegenerative disorders such as Alzheimer’sdisease. 21
22
KEYWORDS:-amyloid; s-allyl cysteine; s-ethyl cysteine; s-propyl cysteine; glycation;
23
protein kinase C 24
INTRODUCTION 1
Alzheimer’s disease (AD), a progressive neurodegenerative disorder, is the most 2
common form of dementia in many countries. The ‘amyloid cascade hypothesis’ 3
considers the amyloid-beta peptide (A) a central role in the pathogenesis of AD (1, 2).
4
Ais derived from the -amyloid precursor protein (APP), a large transmembrane protein, 5
in which a transmembrane aspartyl protease termed as beta-site APP cleavage enzyme 1 6
(BACE1) is responsible for the cleavage (3, 4). On the other hand, Acould be 7
degraded by a variety of proteases such as neprilysin (NEP) (5). Thus, any agents with 8
ability to down-regulate APP or BACE1, or up-regulate NEP, may potentially protect 9
neurons against A-induced neurotoxicity via decreasing Aformation and/or increasing 10
Aclearance. In addition, it has been documented that Adeposition in brain tissue 11
causes generation of free radicals and advanced glycation endproducts (AGEs) such as 12
carboxymethyllysine (CML) and pentosidine, which in turn enhances oxidative and 13
glycative damage, and consequently leads to neuronal cells apoptosis (6, 7). Thus, any 14
agents with anti-glycative and anti-oxidative effects may also attenuate AD development.
15
s-Allyl cysteine (SAC), s-ethyl cysteine (SEC) and s-propyl cysteine (SPC) are 16
hydrophilic cysteine-containing compounds naturally formed in Allium plants such as 17
garlic and onion (8). Our previous study has reported that pre-intake of SEC and SPC 18
markedly protected mice brain against 1-methyl-4-phenyl-1,2,3,6-tetrahydropyridine 19
induced Parkinson-like oxidative and inflammatory injury via increasing retention of 20
dopamine and glutathione, elevating glutathioneperoxidase(GPX) mRNA expression and 21
diminishing tumor necrosis factor-mRNA expression (9). Our another study further 22
observed that SEC and SPC protected PC12 cells against A-caused oxidative and 23
apoptotic damage via retaining mitochondrial membrane potential and decreasing DNA 24
fragmentation (10). These findings support that these cysteine-containing compounds 1
via acting as anti-oxidative and anti-inflammatory agents are able to prevent or mitigate 2
cytotoxicity and oxidative stress occurred in neurodegenerative disorders. Therefore, an 3
animal study was conducted to further examine the in vivo protective effects and possible 4
action modes of these agents against AD progression.
5
It has been documented that D-galactose (DG) induced aging-related and/or AD-like 6
pathological changes including the increase of reactive oxygen species (ROS) and the 7
decrease of antioxidant enzyme activity in brain (11, 12). The animal study of Hsieh et 8
al. (12) reported that DG treatment increased AGEs level in circulation and enhanced A
9
expression in brain. In our present study, DG injected mouse was used as an AD model 10
to examine the anti-A,anti-glycative and anti-oxidative effects of SAC, SEC and SPC.
11 12
MATERIALS AND METHODS 13
Chemicals. SEC (99.5%) was purchased from Aldrich Chemical Co. (Milwaukee, 14
WI, USA). SAC (99.5%) and SPC (99%) were supplied by Wakunaga Pharmaceutical 15
Co. (Hiroshima, Japan).
16
Animals. Three- to four-week-old male C57BL/6 mice were obtained from National 17
Laboratory Animal Center (National Science Council, Taipei City, Taiwan). Mice were 18
housed on a 12-h light-12-h dark schedule, and fed with water and mouse standard diet for 19
16 wk. Use of the mice was reviewed and approved by both Chung Shan Medical 20
University and China Medical University animal care committees.
21
Experimental Design. Mice at 19-20 wk old were used for experiments. Mice 22
were divided into two groups, in which one group was treated with DG (100 mg/kg body 23
weight) via i.p. daily injection and the other group was treated with saline injection.
24
Both DG and non-DG treated mice were further divided into four sub-groups, in which 25
water, SAC, SEC or SPC was supplied. SAC, SEC or SPC, each compound at 1 g/L, 1
was directly added into the drinking water. Consumed water volume and body weight 2
were recorded weekly. After 7-wk DG treatment and cysteine-containing compounds 3
supplementation, mice were sacrificed by decapitation. Brain was quickly removed and 4
collected. Brain tissue at 0.1 g was homogenized on ice in 2 mL of phosphate buffer 5
saline (PBS, pH 7.2) and the filtrate was collected. Protein concentration of filtrate was 6
determined by a commercial assay kit (Pierce Biotechnology Inc., Rockford, IL, USA) 7
with bovine serum albumin as standard. In all experiments, the sample was diluted to a 8
final concentration of 1 mg protein/mL.
9
MeasurementofAβ Levels. Aβ1–40 and Aβ1–42 were measured using commercial 10
colorimetric ELISA kits (The Genetics Company, Schlieren, Switzerland) according to 11
manufacturer's instructions. All values were standardized to the protein concentration of 12
sample.
13
Determination of BACE1 and NEP Activities. For BACE1 activity assay, brain 14
tissue was homogenized and lysed in 100L buffer (20mM MES pH 6.0, 150mM NaCl, 15
2mM EDTA, 5g/mL leupeptin, 0.2mM PMSF, 1 g/mL pepstatin A, 2 g/mL aprotinin, 16
and 0.5% Triton X-100). After centrifuged at 16,000 xg for 20 min at 4 °C, 50 L of 17
lysate was incubated with reaction buffer containing 10 M of fluorogenic substrate, 18
MOCAc-Ser-Glu-Val-Asn-Leu-Asp-Ala-Glu-Phe-Arg-Lys-Arg-Arg-NH2 (Peptide 19
Institute, Inc., Osaka, Japan), at 37 °C for 1 h. Absorbance at 405 nm was measured on a 20
fluorescence plate reader. NEP activity was determined using the NEP-specific 21
fluorogenic peptide substrate, N-dansyl-D-Ala-Gly-p-(nitro)-Phe-Gly (DAGPNG; Sigma 22
Chem. Co., St Louis, MO, USA). Briefly, 50g brain membrane protein was incubated 23
with 50M DAGPNG and 20 M elanapril dissolved in 0.5 mL Tris-HCl, pH 7.4. Then, 24
0.8 mU leucine aminopeptidase was added to the reaction mixture and further incubated 1
for 20 min at 37 °C. Following centrifugation at 3000 xg for 5 min, the supernatant was 2
removed and fluorescence (340 nm excitation, 520 nm emission) was read on a 3
fluorescence plate reader.
4
Protein Kinase C (PKC) Activity Assay. Sample (100 μL)was incubated with a salt 5
solution for 15 min in the presence or absence of 100 µM PKC-specific substrate, and 6
followed by adding 5 mg/mL digitonin and 1 mM ATP mixed with -[32P]ATP (<1500 7
cpm/pmol). The reaction was stopped by 5% trichloroacetic acid, and then spotted onto 8
P81 phosphocellulose paper and washed with phosphoric acid and acetone. The amount 9
of incorporated radioactivity into the substrate was determined by scintillation counting.
10
PKC activity was normalized by the corresponding protein content.
11
Measurement of CML, Pentosidine, Sorbitol and Fructose Content. CML was 12
immunochemically determined with ELISA technique using the CML-specific 13
monoclonal antibody 4G9 and calibration with 6-(N-carboxymethylamino)caproic acid 14
(Roche Diagnostics, Penzberg, Germany). Intra- and interassay variability were 5.3 and 15
6.2%, respectively. Pentosidine was analyzed by a HPLC equipped with a C18 16
reverse-phase column and a fluorescence detector according to the method described in 17
Miyata et al. (13). Briefly, sample was lyophilized and acid hydrolyzed in 500 µL 6 N 18
HCl for 16 h at 110 °C in screw-cap tubes purged with nitrogen. After neutralization 19
with NaOH and diluted with PBS, sample was used for HPLC measurement. In addition, 20
100 mg brain was homogenized with PBS (pH 7.4) containing U-[13C]-sorbitol as an 21
internal standard. After precipitating protein by ethanol, the supernatant was lyophilized.
22
The content of sorbitol and fructose in each lyophilized sample was determined by liquid 23
chromatography with tandem mass spectrometry, according to the method of Guerrant 24
and Moss (14).
25
Activity of Aldose Reductase (AR) and Sorbitol Dehydrogenase (SDH). The 1
method of Nishinaka and Yabe-Nishimura (15) was used to measure AR activity in brain 2
by monitoring the decrease in absorbance at 340 nm due to NADPH oxidation. SDH 3
activity was assayed according to the method of Ulrich (16) by mixing 100 L 4
homogenate, 200L NADH (12 mM) and 1.6 mL triethanolamine buffer (0.2 M, pH 7.4), 5
and monitoring the absorbance change at 365 nm.
6
Determination of Malonyldialdehyde (MDA), ROS, Protein Carbonyl and 7
Glutathione (GSH) Levels. MDA, an index of lipid peroxidation, was measured by using 8
a commercial assay kit (OxisResearch, Portland, OR, USA). The method described in 9
Gupta et al. (17) was used to measure ROS level. Briefly, 10 mg tissue was 10
homogenized in 1 mL of ice cold 40 mM Tris–HCl buffer (pH 7.4), and further diluted to 11
0.25% with the same buffer. Then, samples were divided into two equal fractions. In 12
one fraction,40 μL 1.25 mM 2’,7’-dichlorofluorescin diacetate in methanol was added 13
forROS estimation. Anotherfraction,in which 40 μL methanolwasadded,served asa 14
control for auto fluorescence, which was determined at 488 nm excitation and 525 nm 15
emission using a fluorescence plate reader. Protein carbonyls were determined with the 16
Zentech PC kit (BioCell, Auckland, New Zealand). Briefly, 50 µL sample was mixed 17
with a 200 L dinitrophenylhydrazine (DNP) solution. The adsorbed DNP–protein was 18
reacted with an anti-DNP-biotin antibody, and followed by reacting with 19
streptavidin-linked horseradish peroxidase probe and chromatin reagent. The absorbance 20
at 450 nm was measured. GSH concentration was determined by a commercial 21
colorimetricGSH assay kitaccording to themanufacturer’sinstruction (OxisResearch, 22
Portland, OR, USA). Reduced GSH was determined in this study.
23
Catalase, Superoxide Dismutase (SOD) and GPX Activity Assay. The activities 24
of catalase, SOD, and GPX were determined by catalase, SOD, and GPX assay kits 25
(Calbiochem, EMD Biosciences, Inc., San Diego, CA, USA). The enzyme activity was 1
expressed in U/mg protein.
2
Real-time Polymerase Chain Reaction (RT-PCR) for mRNA Expression. Brain 3
tissue was homogenized in guanidinethiocyanate, and total RNA was isolated using Trizol 4
reagent (Invitrogen, Life Technologies, Carlsbad, CA, USA). Oneg RNA was used to 5
generate cDNA, which was amplified using Taq DNA polymerase. PCR was carried out 6
in 50 L of reaction mixture containing Taq DNA polymerase buffer (20 mM Tris-HCl, 7
pH 8.4, 50 mM KCl, 200 mM dNTP, 2.5 mM MgCl2, 0.5 mM of each primer) and 2.5 U 8
Taq DNA polymerase. The specific oligonucleotide primers of targets are shown in 9
Table 1. The cDNA was amplified under the following reaction conditions: 95 ºC for 1 10
min, 55 ºC for 1 min, and 72 ºC for 1 min. 28 cycles were performed for 11
glyceraldehyde-3-phosphate dehydrogenase (GAPDH, the housekeeping gene) and 35 12
cycles were performed for others. Generated fluorescence from each cycle was 13
quantitatively analyzed by using the Taqman system based on real-time sequence 14
detection system (ABI Prism 7700, Perkin-Elmer Inc., Foster City, CA, USA). In this 15
study, mRNA level was calculated as percentage of the control group.
16
Statistical Analysis. The effect of each treatment was analyzed from ten different 17
preparations (n = 10). Data were reported as means standard deviation (SD), and 18
subjected to analysis of variance (ANOVA). Differences among means were determined 19
by the Least Significance Difference Test with significance defined at P<0.05.
20 21
RESULTS 22
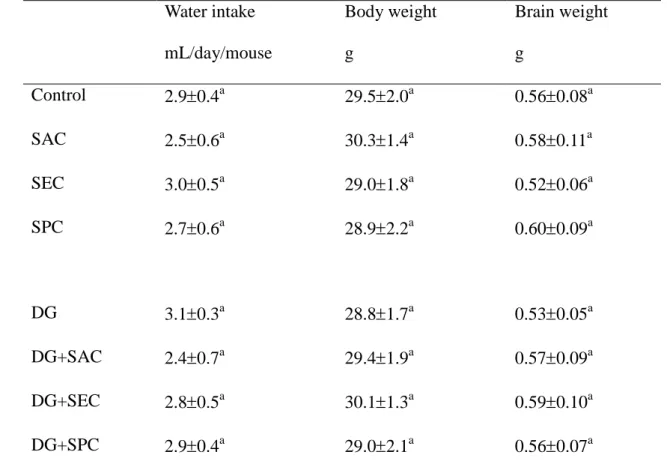
As shown in Table 2, DG treatment and intake of SAC, SEC and SPC did not 23
significantly affected water intake, body weight and brain weight (P>0.05). DG 24
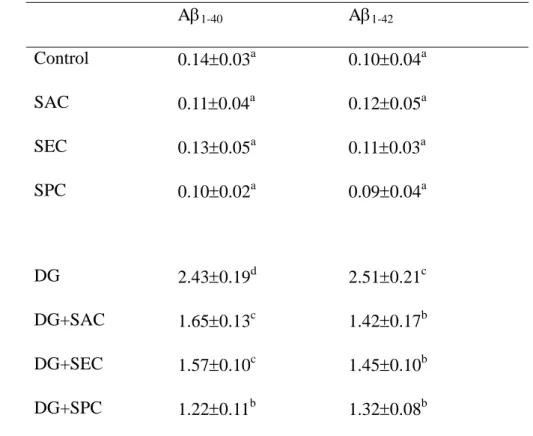
treatment significantly increased the formation of A1-40 and A1-42 in brain (Table 3, 25
P<0.05); however, the intake of three test compounds significantly decreased the brain 1
level of A1-40 and A1-42(P<0.05). DG treatment enhanced mRNA expression of APP 2
and BACE1, and reduced NEP expression in brain (Figure 1, P<0.05). The intake of test 3
compounds lowered APP and BACE1 expression (P<0.05); but failed to affect NEP 4
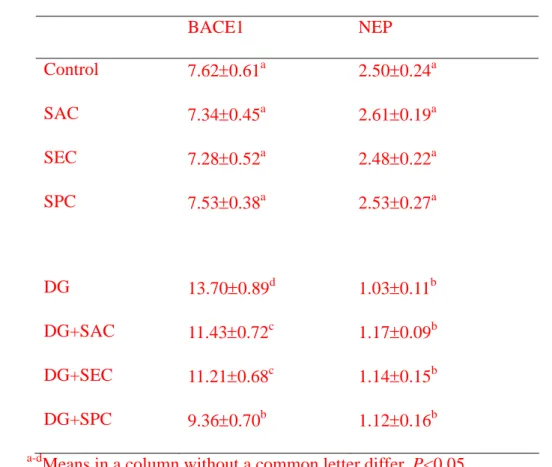
expression (P>0.05). As shown in Table 4, DG enhanced BACE1 activity and decreased 5
NEP activity (P<0.05); the intake of test compound significantly reduced BACE1 activity 6
only (P<0.05). DG treatments also declined brain PKC activity and mRNA expression 7
of PKC-alpha, PKC-beta and PKC-gamma (Figure 2, P<0.05). Intake of test compounds 8
significantly retained PKC activity and the expression of PKC-alpha and PKC-gamma 9
(P<0.05).
10
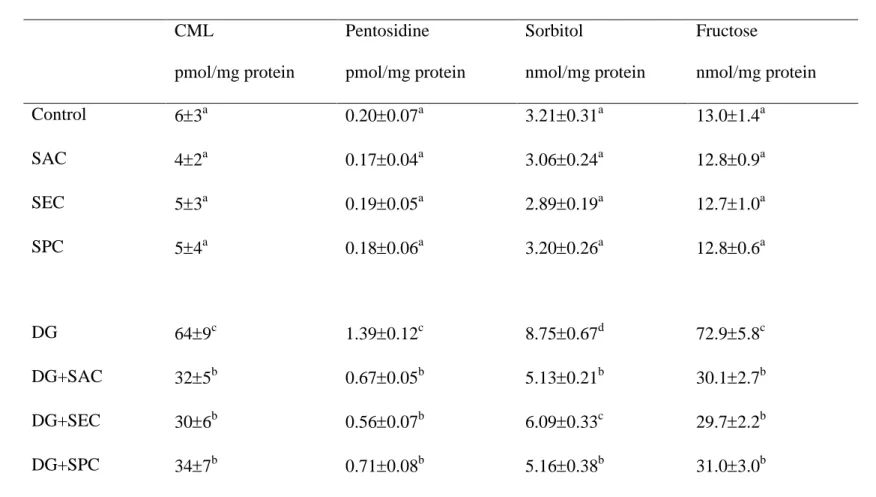
Brain level of CML, pentosidine, sorbitol and fructose was significantly increased in 11
DG-treated mice (Table 5, P<0.05). Three test compounds significantly reduced the 12
levels of these parameters (P<0.05). As shown in Table 6 and Figure 3, DG treatments 13
elevated brain activity and mRNA expression of AR and SDH (P<0.05); however, three 14
test compounds significantly lowered AR activity and expression (P<0.05), but did not 15
affect SDH activity and expression (P>0.05). As shown in Table 7, intake of test 16
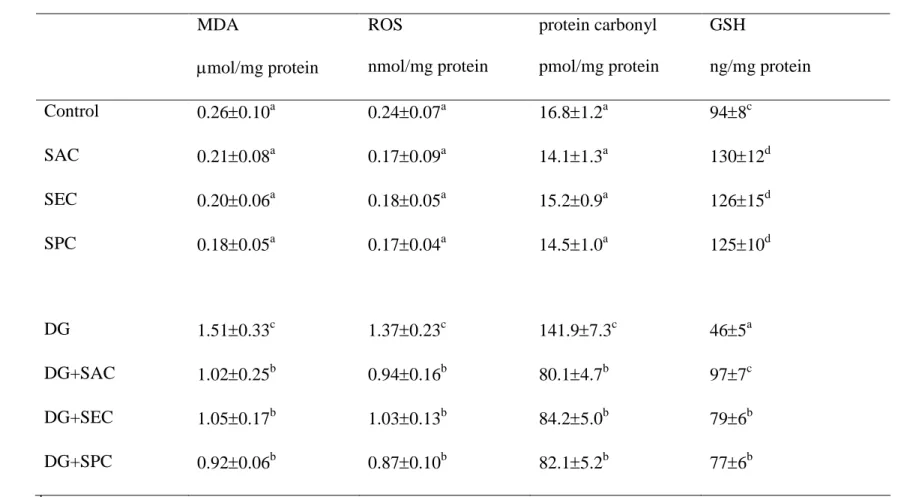
compounds significantly raised GSH content in brain from mice without DG treatment 17
(P<0.05). DG treatments led to a significant increase in the formation of MDA, ROS 18
and protein carbonyl; and a decrease in GSH level (P<0.05); however, the intake of test 19
compounds in DG-treated mice significantly reduced MDA, ROS and protein carbonyl 20
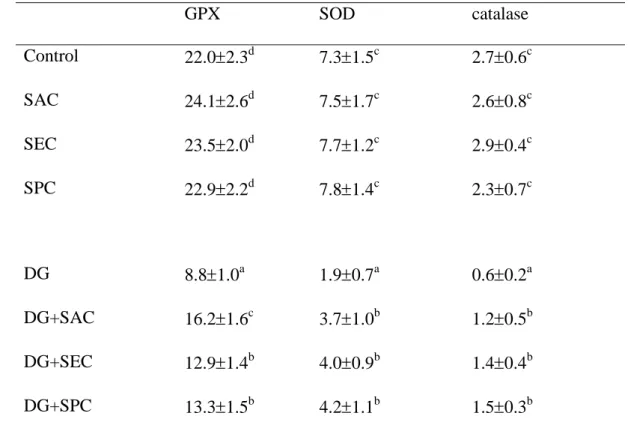
levels, and restored GSH level in brain (P<0.05). DG treatments lowered brain activity 21
of GPX, SOD and catalase (Table 8, P<0.05); however, the intake of test compounds 22
significantly retained brain GPX, SOD and catalase activities (P<0.05).
23 24
DISCUSSION 25
As reported by others (11, 12) and our present study, DG treatments caused AD-like 1
pathological characteristics such as increased A deposition, AGEs generation and 2
oxidative stress. Our present study further found that the intake of SAC, SEC and SPC 3
down-regulated APP mRNA expression, diminished activity and expression of BACE1, 4
retained PKC activity and expression, and decreased Aformation. In addition, we 5
notified that these compounds markedly reduced the production of CML, pentosidine, 6
ROS, protein carbonyl, and declined AR activity, as well as maintained activity of GPX 7
and SOD, which contributed to attenuate glycative and oxidative stress in brain of 8
DG-treated mice. These novel findings suggested that these cysteine-containing 9
compounds were able to penetrate blood brain barrier and exhibited anti-A, 10
anti-glycative and anti-oxidative neuro-protection to alleviate AD progression.
11
Furthermore, these compounds might exert their functions at the level of transcription 12
because they mediated mRNA expression of several factors.
13
Both APP level and BACE1 activity are crucial factors responsible for A
14
accumulation and AD progression (18). So far, decreasing APP and/or inhibiting 15
BACE1 have been considered as targets for developing therapeutic strategy for AD (18, 16
19). A1-40and A1-42are major Aforms occurred in brain tissue and circulation of AD 17
patients, they also play clinical significance for AD deterioration because both are 18
insoluble and able to cause aggregation of amyloid plaques (20, 21). In our present study, 19
the intake of test compounds lowered BACE1 activity, and repressed the mRNA 20
expression of APP and BACE1, which subsequently decreased available Aprecursors 21
and lowered Aformation. Our data regarding brain levels of A1-40 and A1-42 also 22
agreed that the supplementation of test compounds reduced Aproduction. These 23
results indicated that these compounds exhibited anti-Aaction via mediating APP and 24
BACE1. On the other hand, Acould be degraded by a variety of proteases including 1
NEP, which favors Acatabolism and clearance (22). In our present study, treatments 2
from cysteine-containing compoundsfailed to affect NEP expression and activity. Thus, 3
the anti-Aeffects of these agents was not due to they regulate this protease. It is 4
reported that PKC activation lowered A accumulation via modulating 5
non-amyloidogenic pathway of APP cleavage and led to the generation of soluble APP, 6
which was released into the extracellular media, and precluded the deposition of A(23, 7
24). Our results revealed that SAC, SEC and SPC restored PKC activity, and improved 8
DG-caused down-regulation in PKC-alpha and PKC-gamma expression in mice brain 9
under AD-like condition, which further benefited APP cleavage and decreased the 10
available APP for Aformation. These findings suggested that the anti-Aaction of 11
these test compounds might be partially due to they enhance PKC activation.
12
Enhanced glycative stress is involved in AD progression. CML and pentosidine, 13
two AGEs, have been implied in AD associated pathological development (6, 25). The 14
lower generation of CML and pentosidine in brain tissue of test compound-treated mice as 15
we observed indicated that glycative injury in those mice has been mitigated. Aldose 16
reductase and sorbitol dehydrogenase are two key enzymes responsible for AGEs 17
generation in polyol pathway. Increased activity and expression of these enzymes 18
facilitate the production of sorbitol and fructose, which in turn promote AGEs formation 19
and glycative stress (26, 27). Our present study found that three test compounds 20
declined both activity and mRNA expression of aldose reductase, which subsequently 21
decreased the production of sorbitol. Although these test compounds failed to affect 22
SDH activity and expression, it is highly possible that the lower available sorbitol further 23
decreased fructose production. Since fructose and sorbitol levels had been reduced, the 24
observed lower formation of CML and pentosidine could be partially explained. These 1
findings indicated that these compounds could alleviate glycative stress in brain via 2
suppressing polyol pathway and inhibiting AGEs formation, which consequently 3
contributed to attenuate AD progression.
4
Oxidative damage is another hallmark of AD (28). It is reported that AD patients 5
had increased carbonyl compounds and/or decreased GSH level in circulation (29, 30).
6
In our present study, the intake of test compounds increased GSH content in brain from 7
mice without DG treatment. This finding implied that these agents might be able to 8
spare GSH and favor GSH homeostasis, which definitely contributed to enhance 9
anti-oxidative protection for this tissue. In addition, we found the supplement of these 10
compounds not only maintained GSH level but also effectively restored GPX, catalase and 11
SOD activities in brain from DG-treated mice. These results explained the lower 12
formation of MDA, ROS and protein carbonyl, and indicated that SAC, SEC and SPC 13
could abate oxidative injury in brain of DG-treated mice via both non-enzymatic and 14
enzymatic antioxidant protective actions. It is reported that Adeposition favors free 15
radicals generation and exacerbates oxidative damage (31). In our present study, test 16
compounds markedly reduced A production in brain, which might in turn benefit 17
lowering free radicals formation and mitigating oxidative stress. On the other hand, it is 18
known that free radicals could promote AGEs formation (32). Thus, it is highly possible 19
that the lower AGEs production in brain from test compound-treated mice as we observed 20
was partially due to these compounds diminish free radicals generation via their 21
anti-oxidative activities.
22
It has been documented that AD could be considered as type 3 diabetes mellitus (DM) 23
because both DM and AD shared common pathological features including oxidative and 24
glycative stress (33, 34). The results of our present study revealed that AD progression 25
not only increased the production of AGEs but also enhanced the activity and expression 1
of glycation associated enzyme such as AR in brain. These findings supported that there 2
was a closed link between AD and DM, and agreed that AD was a form of DM. Thus, 3
the agents with anti-AD activity might also benefit the prevention or treatment of DM. It 4
is interesting to find that the neuro-protective effects from three test agents in DG-treated 5
mice was different because SAC was more effective in maintaining GPX activity, SEC 6
was marked in restoring PKC-gamma expression and SPC was greater than other agents in 7
lowering A1-40 generation and suppressing BACE1 expressionand activity. Obviously, 8
the allyl group of SAC, ethyl group of SEC and propyl group of SPC played important 9
roles in determining their bioactivities. These compounds are hydrophilic peptide 10
derivates and naturally formed in Allium foods such as garlic. Further studies are 11
necessary to ensure the safety of these agents before they are applied for human. It is 12
known that the content of these cysteine-containing compounds in Allium plants is 13
dependent on the species or vegetation period (35). Thus, it may not be always possible 14
to obtain these compounds by supplementing the diet with garlic or other Allium plants.
15
In conclusion, the treatments from s-allyl cysteine, s-ethyl cysteine or s-propyl 16
cysteine effectively decreased Aproduction, and alleviated glycative and oxidative stress 17
in DG-treated mice. These agents exhibited anti-A, anti-glycative and anti-oxidative 18
effects via suppressing APP and BACE1 expression, retaining activity and expression of 19
PKC, declining activity and expression of AR, as well as enhancing activity of GPX, SOD 20
and catalase. These findings support that these compounds were potent agents against 21
the progression of neurodegenerative disorders such as Alzheimer’sdisease. 22
REFERENCES 1
1. Christensen, D.D.Alzheimer’sdisease:progressin thedevelopmentofanti-amyloid 2
disease-modifying therapies. CNS Spectr. 2007, 12, 113-116.
3
2. Seabrook, G.R.; Ray, W.J.; Shearman, M.; Hutton, M. Beyond amyloid: the next 4
generation ofAlzheimer’sdiseasetherapeutics.Mol. Interv. 2007, 7, 261-270.
5
3. Marques, C.A.; Keil, U.; Bonert, A.; Steiner, B.; Haass, C.; Muller, W.E.; Eckert, A.
6
Neurotoxic mechanisms caused by the Alzheimer's disease-linked Swedish amyloid 7
precursor protein mutation: oxidative stress, caspases, and the JNK pathway. J. Biol.
8
Chem. 2003, 278, 28294-28302.
9
4. Wang, L.; Shim, H.; Xie, C.; Cai, H. Activation of protein kinase C modulates 10
BACE1-mediated beta-secretase activity. Neurobiol. Aging 2008, 29, 357-367.
11
5. Tanzi, R.E.; Moir, R.D.; Wagner,S.L.Clearance ofAlzheimer’sAbetapeptide:the 12
many roads to perdition. Neuron 2004, 43, 605-608.
13
6. Reddy, V.P.; Obrenovich, M.E.; Atwood, C.S.; Perry, G.; Smith, M.A. Involvement 14
of Maillard reactions in Alzheimer disease. Neurotox. Res. 2002, 4, 191-209.
15
7. Ko, S.Y.; Lin, Y.P.; Lin, Y.S.; Chang, S.S. Advanced glycation end products enhance 16
amyloid precursor protein expression by inducing reactive oxygen species. Free 17
Radic. Biol. Med. 2010, 49, 474-480.
18
8. Jones, M.G.; Hughes, J.; Tregova, A.; Milne, J.; Tomsett, A.B.; Collin, H.A.
19
Biosynthesis of the flavour precursors of onion and garlic. J. Exp. Botany. 2004, 55, 20
1903-1918.
21
9. Chen, C.M.; Yin, M.C.; Hsu, C.C.; Liu, T.C. Anti-oxidative and anti-inflammatory 22
effects of four cysteine-containing agents in striatum of MPTP-treated mice.
23
Nutrition 2007, 23, 589-597.
24
10. Tsai, S.J.; Lin, C.Y.; Mong, M.C.; Ho, M.W.; Yin, M.C. s-Ethyl cysteine and 1
s-propyl cysteine alleviate beta-amyloid induced cytotoxicity in nerve growth factor 2
differentiated PC12 cells. J. Agric. Food Chem. 2010, 58, 7104-7108.
3
11. Luo, Y.; Niu, F.; Sun, Z.; Cao, W.; Zhang, X.; Guan, D.; Lv, Z.; Zhang, B.; Xu, Y.
4
Altered expression of Abeta metabolism-associated molecules from 5
D-galactose/AlCl(3) induced mouse brain. Mech. Ageing Dev. 2009, 130, 248-252.
6
12. Hsieh, H.M.; Wu, W.M.; Hu, M.L. Soy isoflavones attenuate oxidative stress and 7
improve parameters related to aging and Alzheimer's disease in C57BL/6J mice 8
treated with D-galactose. Food Chem. Toxicol. 2009, 47, 625-632.
9
13. Miyata, T.; Taneda, S.; Kawai, R.; Ueda, Y.; Horiuchi, S.; Hara, M.; Maeda, K.;
10
Monnier, V.M. Identification of pentosidine as a native structure for advanced 11
glycation end products in 2-microglobulin-containing amyloid fibrils in patients 12
with dialysis-related amyloidosis. Proc. Natl. Acad. Sci. USA 1996, 93, 2353-2358.
13
14. Guerrant, G.; Moss, C.W. Determination of monosaccharides as aldononitrile, 14
O-methyoxime, alditol, and cyclitol acetate derivatives by gas chromatography. Anal.
15
Chem. 1984, 56, 633-638.
16
15. Nishinaka, T.; Yabe-Nishimura, C. EGF receptor-ERK pathway is the major 17
signaling pathway that mediates upregulation of aldose reductase expression under 18
oxidative stress. Free Radic. Biol. Med. 2001, 31, 205-216.
19
16. Ulrich, H.B. In: Bergmeyer, H.U., editor. Methods of enzyme analysis, vol. 2. New 20
York: Academic press; 1974. pp. 567-573.
21
17. Gupta, R.; Dubey, D.K.; Kannan, G.M.; Flora, S.J.S. Concomitant administration of 22
Moringa oleifera seed powder in the remediation of arsenic-induced oxidative stress 23
in mouse. Cell Biol. Internal. 2007, 31, 44-56.
24
18. Zou, L.; Yang, R.; Zhang, P.; Dai, Y. The enhancement of amyloid precursor protein 25
and beta-site amyloid cleavage enzyme 1 interaction: amyloid-beta production with 1
aging. Int. J. Mol. Med. 2010, 25, 401-407.
2
19. Klaver, D.W.; Wilce, M.C.; Cui, H.; Hung, A.C.; Gasperini, R.; Foa, L.; Small, D.H.
3
Is BACE1 a suitable therapeutic target for the treatment of Alzheimer's disease?
4
Current strategies and future directions. Biol. Chem. 2010, 391, 849-859.
5
20. Maddalena, A.S.; Papassotiropoulos, A.; Gonzalez-Agosti, C.; Signorell, A.; Hegi, T.;
6
Pasch, T.; Nitsch, R.M.; Hock, C. Cerebrospinal fluid profile of amyloid beta 7
peptides in patients with Alzheimer's disease determined by protein biochip 8
technology. Neurodegener. Dis. 2004, 1, 231-235.
9
21. Ikeda, T.; Ono, K.; Elashoff, D.; Condron, M.M.; Noguchi-Shinohara, M.; Yoshita, 10
M.; Teplow, D.B.; Yamada, M. Cerebrospinal Fluid from Alzheimer's disease patients 11
promotes amyloid beta-protein oligomerization. J. Alzheimers Dis. 2010, 21, 81-86.
12
22. Carson, J.A.; Turner, A.J. Beta-amyloid catabolism: roles for neprilysin (NEP) and 13
other metallopeptidases? J. Neurochem. 2002, 81, 1-8.
14
23. Bandyopadhyay, S.; Goldstein, L.E.; Lahiri, D.K.; Rogers, J.T. Role of the APP 15
non-amyloidogenic signaling pathway and targeting alpha-secretase as an alternative 16
drug target for treatment of Alzheimer's disease. Curr. Med. Chem. 2007, 14, 17
2848-2864.
18
24. Fu, H.; Dou, J.; Li, W.; Cui, W.; Mak, S.; Hu, Q.; Luo, J.; Lam, C.S.; Pang, Y.;
19
Youdim, M.B.; Han, Y. Promising multifunctional anti-Alzheimer's dimer 20
bis(7)-Cognitin acting as an activator of protein kinase C regulates activities of 21
alpha-secretase and BACE-1 concurrently. Eur. J. Pharmacol. 2009, 623, 14-21.
22
25. Gironès, X.; Guimerà, A.; Cruz-Sánchez, C.Z.; Ortega, A.; Sasaki, N.; Makita, Z.;
23
Lafuente, J.V.; Kalaria, R.; Cruz-Sánchez, F.F. N epsilon-carboxymethyllysine in 24
brain aging, diabetes mellitus, and Alzheimer's disease. Free Radic. Biol. Med. 2004, 25
36, 1241-1247.
1
26. Dan, Q.; Wong, R.L.; Yin, S.; Chung, S.K.; Chung, S.S.; Lam, K.S. Interaction 2
between the polyol pathway and non-enzymatic glycation on mesangial cell gene 3
expression. Nephron Exp. Nephrol. 2004, 98, 89-99.
4
27. Leto, G.; Pricci, F.; Amadio, L.; Iacobini, C.; Cordone, S.; Diaz-Horta, O.; Romeo, G.;
5
Barsotti, P.; Rotella, C.M.; di Mario, U.; Pugliese, G. Increased retinal endothelial 6
cell monolayer permeability induced by the diabetic milieu: role of advanced 7
non-enzymatic glycation and polyol pathway activation. Diabetes Metab. Res. Rev.
8
2001, 17, 448-458.
9
28. Su, B.; Wang, X.; Nunomura, A.; Moreira, P.I.; Lee, H.G.; Perry, G.; Smith, M.A.;
10
Zhu, X. Oxidative stresssignaling in Alzheimer’sdisease.Curr. Alzheimer Res. 2008, 11
5, 525-532.
12
29. Calabrese, V.; Sultana, R.; Scapagnini, G.; Guagliano, E.; Sapienza, M.; Bella, R.;
13
Kanski, J.; Pennisi, G.; Mancuso, C.; Stella, A.M.; Butterfield, D.A. Nitrosative 14
stress, cellular stress response, and thiol homeostasis in patients with Alzheimer's 15
disease. Antioxid. Redox Signal. 2006, 8, 1975-1986.
16
30. Greilberger, J.; Fuchs, D.; Leblhuber, F.; Greilberger, M.; Wintersteiger, R.; Tafeit, E.
17
Carbonyl proteins as a clinical marker in Alzheimer's disease and its relation to 18
tryptophan degradation and immune activation. Clin. Lab. 2010, 56, 441-448.
19
31. Picklo, M.J.; Olson, S.J.; Markesbery, W.R.; Montine, T.J. Expression and activities 20
of aldo-keto oxidoreductases in Alzheimer disease. J. Neuropathol. Exp. Neurol.
21
2001, 60, 686-695.
22
32. Lee, H.B.; Yu, M.R.; Yang, Y.; Jiang, Z.; Ha, H. Reactive oxygen species-regulated 23
signaling pathways in diabetic nephropathy. J. Am. Soc. Nephrol. 2003, 14, 24
S241-245.
25
33. Kroner, Z. The relationship between Alzheimer's disease and diabetes: Type 3 1
diabetes? Altern. Med. Rev. 2009, 14, 373-379.
2
34. de la Monte, S.M.; Wands, J.R. Alzheimer's disease is type 3 diabetes-evidence 3
reviewed. J. Diabetes Sci. Technol. 2008, 2, 1101-1113.
4
35. Krest, I.; Glodek, J.; Keusgen, M. Cysteine sulfoxides and alliinase activity of some 5
Allium species. J. Agric. Food Chem. 2000, 48, 3753-3760.
6 7 8
Table 1. Forward and reverse primers for real time PCR analysis.
1
Target forward reverse
APP 5′-GAC TGA CCA CTC GAC CAG GTT CTG-3’ 5’-CTT GAA GTT GGA TTC TCA TAC CG-3′ BACE1 5’-TTG CCC AAG AAA GTA TTT GA-3’ 5’-TGA TGC GGA AGG ACT GAT T-3’
NEP 5’-GAC CTA CCG GCC AGA GTA-3’ 5’-AAA CCC GAC ATT TCC TTT-3’
PKC-alpha 5’-GAA CCA TGG CTG ACG TTT AC-3’ 5’-GCA AGA TTG GGT GCA CAA AC-3’ PKC-beta 5’-TTC AAG CAG CCC ACC TTC TG-3’ 5’-AAG GTG GCT GAA TCT CCT TG-3’ PKC-gamma 5’-GAC CCC TGT TTT GCA GAA AG-3’ 5’-GTA AAG CCC TGG AAA TCA GC-3’ AR 5’-CCC AGG TGT ACC AGA ATG AGA-3’ 5’-TGG CTG CAA TTG CTT TGA TCC-3’ SDH 5’-TGG GAG CTG CTC AAG TTG TG-3′ 5′-GGT CTC TTT GCC AAC CTG GAT-3′ GAPDH 5’-TGA TGA CAT CAA GAA GGT GGT GAA G-3’ 5’-CCT TGG AGG CCA TGT AGG CCA T-3’
Table 2. Water intake, body weight and brain weight of mice with or without 1
d-galactose (DG) treatment and consumed 0 (control) or 1 g/L SAC, SEC or SPC.
2
Data are meanSD (n = 10).
3
Water intake mL/day/mouse
Body weight g
Brain weight g
Control 2.90.4a 29.52.0a 0.560.08a
SAC 2.50.6a 30.31.4a 0.580.11a
SEC 3.00.5a 29.01.8a 0.520.06a
SPC 2.70.6a 28.92.2a 0.600.09a
DG 3.10.3a 28.81.7a 0.530.05a
DG+SAC 2.40.7a 29.41.9a 0.570.09a
DG+SEC 2.80.5a 30.11.3a 0.590.10a
DG+SPC 2.90.4a 29.02.1a 0.560.07a
aMeans in a column without a common letter differ, P<0.05.
4 5
Table 3. Level (pg/mg protein) of A1-40and A1-42 in brain from mice with or without 1
d-galactose (DG) treatment and consumed 0 (control) or 1 g/L SAC, SEC or SPC.
2
Data are meanSD (n = 10).
3
A1-40 A1-42
Control 0.140.03a 0.100.04a
SAC 0.110.04a 0.120.05a
SEC 0.130.05a 0.110.03a
SPC 0.100.02a 0.090.04a
DG 2.430.19d 2.510.21c
DG+SAC 1.650.13c 1.420.17b
DG+SEC 1.570.10c 1.450.10b
DG+SPC 1.220.11b 1.320.08b
a-dMeans in a column without a common letter differ, P<0.05.
4
Table 4. Activity (nmol/mg protein) of BACE1 and NEP in brain from mice with or 1
without d-galactose (DG) treatment and consumed 0 (control) or 1 g/L SAC, SEC or 2
SPC. Data are meanSD (n = 10).
3
BACE1 NEP
Control 7.620.61a 2.500.24a
SAC 7.340.45a 2.610.19a
SEC 7.280.52a 2.480.22a
SPC 7.530.38a 2.530.27a
DG 13.700.89d 1.030.11b
DG+SAC 11.430.72c 1.170.09b
DG+SEC 11.210.68c 1.140.15b
DG+SPC 9.360.70b 1.120.16b
a-dMeans in a column without a common letter differ, P<0.05.
4 5
Figure 1. mRNA expression of APP, BACE1 and NEP in brain from mice with or 1
without d-galactose (DG) treatment and consumed 0 (control) or 1 g/L SAC, SEC or 2
SPC. Data are meanSD (n = 10). a-dMeans among bars without a common letter 3
differ, P<0.05.
4
a a a a a a a a b b b b d
c
a b c
a c
b
a b
b
a
0 50 100 150 200 250 300 350 400 450
APP BACE1 NEP
relativemRNAexpression(%ofcontrol)
control SAC SEC SPC DG DG+SAC DG+SEC DG+SPC
1 2
Figure 2. Activity (pmol/min/mg protein, upper part) and expression (lower part) of 1
PKC in brain from mice with or without d-galactose (DG) treatment and consumed 0 2
(control) or 1 g/L SAC, SEC or SPC. Data are meanSD (n = 10). a-dMeans 3
among bars without a common letter differ, P<0.05.
4
a
b
b b
c c
c c
0 1 2 3 4 5 6
control SAC SEC SPC DG DG+SAC DG+SEC DG+SPC
pmol/min/mgprotein
1 2
d b
d d b d
d
d b d
d b
a a a
b a
b
c a
b a b
c
0 20 40 60 80 100 120
PKC-alpha PKC-beta PKC-gamma
relativemRNAexpression(%ofcontrol)
control SAC SEC SPC DG DG+SAC DG+SEC DG+SPC
1
Table 5. Level of CML, pentosidine, sorbitol and fructose in brain from mice with or without d-galactose (DG) treatment and consumed 0 1
(control) or 1 g/L SAC, SEC or SPC. Data are meanSD (n = 10).
2
CML
pmol/mg protein
Pentosidine pmol/mg protein
Sorbitol
nmol/mg protein
Fructose
nmol/mg protein
Control 63a 0.200.07a 3.210.31a 13.01.4a
SAC 42a 0.170.04a 3.060.24a 12.80.9a
SEC 53a 0.190.05a 2.890.19a 12.71.0a
SPC 54a 0.180.06a 3.200.26a 12.80.6a
DG 649c 1.390.12c 8.750.67d 72.95.8c
DG+SAC 325b 0.670.05b 5.130.21b 30.12.7b
DG+SEC 306b 0.560.07b 6.090.33c 29.72.2b
DG+SPC 347b 0.710.08b 5.160.38b 31.03.0b
a-dMeans in a column without a common letter differ, P<0.05.
3
Table 6. Activity of AR (nmol/min/mg protein) and SDH (U/g protein) in brain from 1
mice with or without d-galactose (DG) treatment and consumed 0 (control) or 1 g/L 2
SAC, SEC or SPC. Data are meanSD (n = 10).
3
AR SDH
Control 1.070.25a 4.110.61a
SAC 0.980.16a 4.140.57a
SEC 1.030.19a 3.960.45a
SPC 1.050.08a 4.020.64a
DG 3.820.30d 7.811.02b
DG+SAC 2.400.24c 7.120.84b
DG+SEC 1.680.16b 7.200.69b
DG+SPC 2.290.19c 7.270.93b
a-dMeans in a column without a common letter differ, P<0.05.
4 5
Figure 3. Expression of AR and SDH in brain from mice with or without d-galactose 1
(DG) treatment and consumed 0 (control) or 1 g/L SAC, SEC or SPC. Data are 2
meanSD (n = 10). a-dMeans among bars without a common letter differ, P<0.05.
3
a
a a a a a a a
d
b c
b
b
b c
b
0 50 100 150 200 250 300 350
AR SDH
relativemRNAexpression(%ofcontrol)
control SAC SEC SPC DG DG+SAC DG+SEC DG+SPC
1
Table 7. Level of MDA, ROS, protein carbonyl and GSH in brain from mice with or without d-galactose (DG) treatment and consumed 0 1
(control) or 1 g/L SAC, SEC or SPC. Data are meanSD (n = 10).
2
MDA
mol/mg protein
ROS
nmol/mg protein
protein carbonyl pmol/mg protein
GSH
ng/mg protein
Control 0.260.10a 0.240.07a 16.81.2a 948c
SAC 0.210.08a 0.170.09a 14.11.3a 13012d
SEC 0.200.06a 0.180.05a 15.20.9a 12615d
SPC 0.180.05a 0.170.04a 14.51.0a 12510d
DG 1.510.33c 1.370.23c 141.97.3c 465a
DG+SAC 1.020.25b 0.940.16b 80.14.7b 977c
DG+SEC 1.050.17b 1.030.13b 84.25.0b 796b
DG+SPC 0.920.06b 0.870.10b 82.15.2b 776b
a-dMeans in a column without a common letter differ, P<0.05.
3
Table 8. Activity (U/mg protein) of GPX, SOD and catalase in brain from mice with 1
or without d-galactose (DG) treatment and consumed 0 (control) or 1 g/L SAC, SEC 2
or SPC. Data are meanSD (n = 10).
3
GPX SOD catalase
Control 22.02.3d 7.31.5c 2.70.6c
SAC 24.12.6d 7.51.7c 2.60.8c
SEC 23.52.0d 7.71.2c 2.90.4c
SPC 22.92.2d 7.81.4c 2.30.7c
DG 8.81.0a 1.90.7a 0.60.2a
DG+SAC 16.21.6c 3.71.0b 1.20.5b
DG+SEC 12.91.4b 4.00.9b 1.40.4b
DG+SPC 13.31.5b 4.21.1b 1.50.3b
a-dMeans in a column without a common letter differ, P<0.05.
4