CHAPTER FOUR
RESULTS
This chapter aims to present the results of the study. It comprises three parts.
The first part is about the results of written recall. The analysis of the three types of questions forms the second section. The last part reveals the result of the questionnaire about students’ perception toward QtA lessons.
Results of QtA Lessons on Written Recall and Inference Generation
Written recall will be analyzed in two ways: match of the original text – recall,
or mismatch of the original text – inference, as stated in Chapter Three. The results will be given respectively.
Effects of QtA Lessons on Written Recall
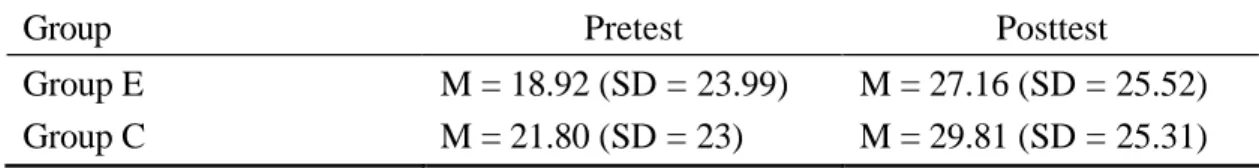
Table 11 gives the mean score and standard deviation of Group E and Group C.
In the pretest, Group E obtained lower means and bigger standard deviation 18.92 (SD = 23.99) than Group C in the pretest 21.80 (SD = 23). For the posttest, the mean score of Group E rose to 27.16 (SD = 25.52) whereas Group C ascended to 29.81 (SD = 25.31).
Table 11. Descriptive Statistics of the Pretest and the Posttest for Written Recall
Group Pretest Posttest
Group E M = 18.92 (SD = 23.99) M = 27.16 (SD = 25.52) Group C M = 21.80 (SD = 23) M = 29.81 (SD = 25.31)
However, ANCOVA analyses on groups shows that there is no significant
difference between groups in the posttest, F (1, 59) = .00, p > .05. Group E did not
outperform Group C on written recall after the treatment (See Table 12). Thus, QtA
lessons did not successfully enhance students’ ability to remember the text. The effect of QtA lessons failed to prove the salience in written recall.
Table 12. ANCOVA Summary for Written Recall
SS df MS F p Covariate (pretest) 30291.38 1 30291.38 210.89 < .00
Group .14 1 .14 .00 .97
Error 8474.44 59 143.63
* p < .05.
Effects of QtA Lessons on Inference Generation
The results of three types of inferences are based on recall from the mismatch of the original text.
Text-based Inference
In the pretest, the mean frequency of Group E was 2.39 (SD = 2.85) while that of Group C was 2.26 (SD = 2.25) (See Table 13). Group E generated a little more text-based inferences in the pretest. However, in the posttest, the mean frequency of the inference for Group E was 3.84 (SD = 3.05) whereas that of Group C was 3.97 (SD = 2.74).
Table 13. Descriptive Statistics of the Pretest and the Posttest for Text-based Inference
Group Pretest Posttest
Group E M = 2.39 (SD = 2.85) M = 3.84 (SD = 3.05) Group C M = 2.26 (SD = 2.25) M = 3.97 (SD = 2.74)
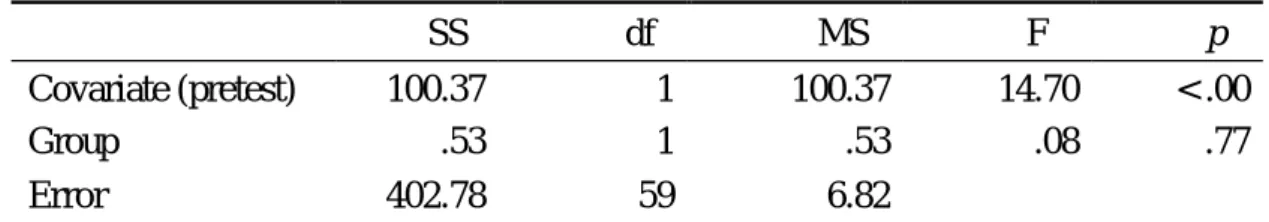
An ANCOVA analysis on the posttest, with pretest as a covariate, shows that
there is no significant difference, F (1, 59) = .08, p > .05 (See Table 14). After a
five-week training, QtA lessons failed to aid the generation of text-based inferences.
Table 14. ANCOVA Summary for Text-based Inferences
SS df MS F p Covariate (pretest) 100.37 1 100.37 14.70 < .00
Group .53 1 .53 .08 .77
Error 402.78 59 6.82
* p < .05.
Reader-based Inference
In the pretest, the mean frequency of Group E was about zero (SD = .18) and that of Group C was .13 (SD = .34). The mean frequency of Group E in the posttest was .23 (SD = .5) and that of Group C was almost zero (SD = .18) (See Table 15).
As there were much fewer frequencies being found, ANCOVA analysis was not a suitable tool for further analysis. Instead, the researcher used Φ test (phi coefficient), which is used to compare small numbers to see whether there was difference in the probability of answering the pretest and the posttest.
Table 15. Descriptive Statistics of the Pretest and the Posttest for Reader-based Inference
Group Pretest Posttest
Group E M = 0.00 (SD = .18) M = 0.23 (SD = .50) Group C M = 0.13 (SD = .34) M = 0.00 (SD = .18)
Participants who generated one or more reader-based inferences were assigned to the group of “Yes” while those who did not generate any reader-based inferences to the group of “No.” Among sixty-two participants, five were in “Yes” group in the pretest; seven in the posttest. None of them generated reader-based inferences in both the pretest and the posttest. Fifty participants did not generate any reader-based inferences.
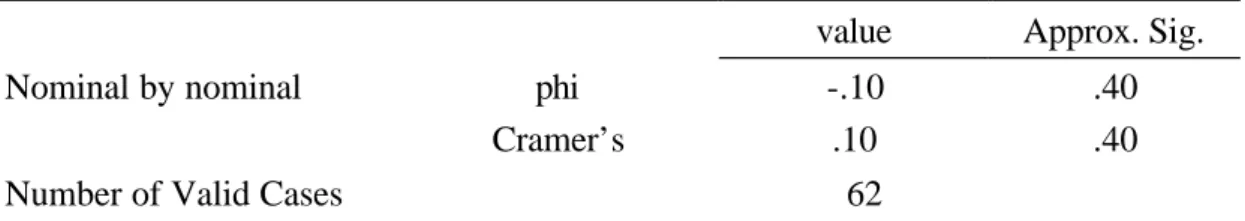
As shown in Table 16, no difference was found for the probability of doing the
pretest and the posttest. The result showed Φ = -.10 (See Table 16). In other
words, the way participants answered in the pretest was the same as that they did in the posttest. Therefore, the assumption of homogeneity was met for valid comparison between groups on posttest in the next step.
Table 16. Symmetric Measures of Phi Coefficient
value Approx. Sig.
Nominal by nominal phi -.10 .40
Cramer’s .10 .40
Number of Valid Cases 62
* p < .05.
With a small scale of frequencies and the participants engendered too few reader-based inferences, a Mann-Whitney Test replaced ANCOVA and was then executed to explore the effect of QtA lessons on reader-based inferences.
Table17. Summary of Reader-based Inferences
Reader-based inference
Mann-Whitney U 402.50
Wilcoxon W 898.50
Z -2.00
Asymp. Sig. (2-tailed) .045 *
* p < .05.
Table 17 displays the result of reader-based inferences. There is a significant difference, Wilcoxon W test= 898.50, p < .05. QtA lessons were able to assist participants to effectuate more reader-based inferences. QtA training offered students more space to read in their own way.
Incorrect Inference
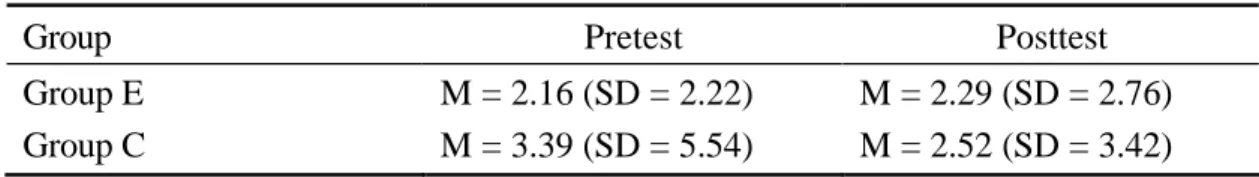
In the pretest, the mean frequency of Group E was 2.16 (SD = 2.22) while that
of Group C was 3.39 (SD = 5.54). In the posttest, Group E made 2.29 inferences (SD
= 2.76) whereas Group C brought about 2.52 (SD = 3.42) (See Table 18).
Table 18. Descriptive Statistics of the Pretest and the Posttest for Incorrect Inference
Group Pretest Posttest
Group E M = 2.16 (SD = 2.22) M = 2.29 (SD = 2.76) Group C M = 3.39 (SD = 5.54) M = 2.52 (SD = 3.42)
ANCOVA was also conducted to see the effect of the intervention. No significant difference is traced, F (1, 59) = .31, p > .05. Table 19 provides the result in detail.
Table 19. ANCOVA Summary for Incorrect Inferences
SS df MS F p Covariate (pretest) 234.07 1 234.07 39.90 < .00
Group 1.83 1 1.83 .31 .57
Error 346.05 59 5.86
* p < .05.
The treatment makes no difference in making incorrect inference. As far as inference generation was concerned, QtA lessons enhanced the ability to develop more reader-based inferences. The lessons did not show effect on text-based inferences, nor on incorrect inferences.
Results of QtA Lessons on Three Types of Comprehension Questions
This section discusses effects of QtA lessons on three types of questions. The three types of questions are factual, interpretive, and responsive questions. In each type, there are three questions. The total is nine questions. The following are the statistical analysis of the result.
Effects on Factual Questions
As Table 20 shows, in the pretest, the mean score of factual questions for Group
E is 6.65 (SD = 3.43), and 6.52 (SD = 3.83) for Group C. The posttest mean for Group E and Group C are 7.32 (SD = 3.24) and 7.38 (SD = 3.69), respectively.
Table 20. Descriptive Statistics of the Pretest and the Posttest for Factual Questions
Group Pretest Posttest
Group E M = 6.65 (SD = 3.43) M = 7.32 (SD = 3.24) Group C M = 6.52 (SD = 3.83) M = 7.38 (SD = 3.69)
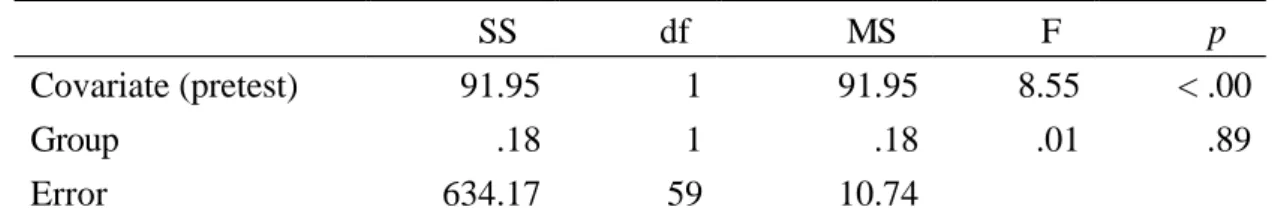
Again, the pretest was taken as a covariate. ANCOVA analysis on factual questions shows there is no significance between the groups, F (1, 59) = .01, p > .05 (See Table 21). Even though Group E made some progress in the posttest, Group C increased their ability to comprehend the explicit text as well. Group E did not outperform Group C in answering factual questions.
Table 21. ANCOVA Summary for Factual Questions
SS df MS F p
Covariate (pretest) 91.95 1 91.95 8.55 < .00
Group .18 1 .18 .01 .89
Error 634.17 59 10.74
* p < .05.
Effects on Interpretive Questions
For the pretest, the mean score of the interpretive questions for Group E was
4.19 (SD = 3.08) whereas that for Group C was 5.58 (SD = 3.64). In the posttest, the
mean scores were 5.74 (SD = 2.56) and 5.48 (SD = 3.12) for Group E and Group C,
respectively. Group E did not perform as well as Group C in the pretest, but they
obtained higher scores in the posttest. See Table 22 for details.
Table 22. Descriptive Statistics of the Pretest and the Posttest for Interpretive Questions
Group Pretest Posttest
Group E M = 4.19 (SD = 3.08) M = 5.74 (SD = 2.56) Group C M = 5.58 (SD = 3.64) M = 5.48 (SD = 3.12)
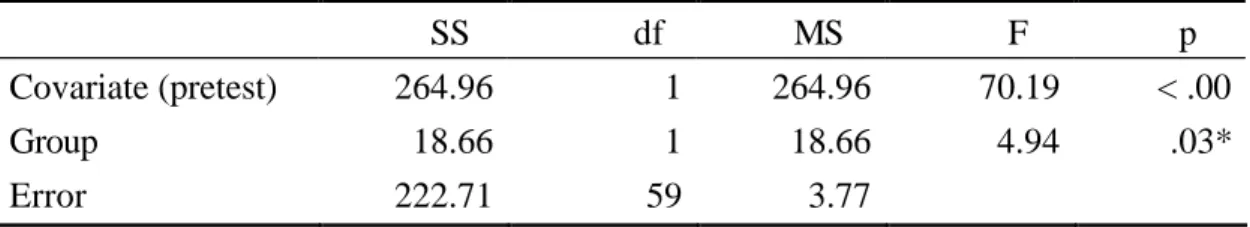
ANCOVA was done with pretest as a covariate on interpretive questions. As Table 23 shows, there is significant difference between groups, F (1, 59) = 4.94, p < .05. Group E outperformed Group C in answering interpretive questions. QtA lessons successfully ushered participants to construct their own meaning and interpret the text.
Table 23. ANCOVA Summary for Interpretive Questions
SS df MS F p Covariate (pretest) 264.96 1 264.96 70.19 < .00
Group 18.66 1 18.66 4.94 .03*
Error 222.71 59 3.77
* p < .05.
Effects on Responsive Questions
In the pretest, the mean score of the responsive questions for Group E is 5.45 (SD = 2.86) and for Group C, 6.16 (SD = 2.46) (See Table 24). In the posttest, the mean scores of Group E and Group C were 6.90 (SD = 2.02) and 6.65 (SD = 2.24) respectively.
Table 24. Descriptive Statistics of the Pretest and the Posttest for Responsive Questions
Group Pretest Posttest
Group E M = 5.45 (SD = 2.86) M = 6.90 (SD = 2.02) Group C M = 6.16 (SD = 2.46) M = 6.65 (SD = 2.24)
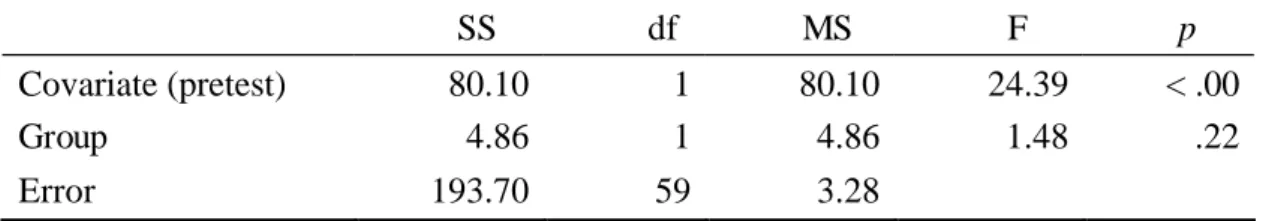
Table 25 shows the result of ANCOVA for the effect of QtA lesson on
responsive questions. The result shows there is no significant difference between
groups, F (1, 59) = 1.48, p > .05. After the intervention, Group E did not show greater change.
Table 25. ANCOVA Summary for Responsive Questions
SS df MS F p Covariate (pretest) 80.10 1 80.10 24.39 < .00
Group 4.86 1 4.86 1.48 .22
Error 193.70 59 3.28
* p < .05.
In summary, as far as three types of questions were concerned, QtA lessons contributed to greater improvement on interpretive questions. After the intervention, with a considerable expansion in the mean score of interpretive questions, Group E was able to interpret the text better. Group E might engage themselves with the text more.
Results of the Perception Questionnaire
In order to understand participants’ perception after the intervention, a questionnaire of three questions about how they felt toward the lesson was administered for Group E. The following are the results of the questionnaire.
Perception of Progress Made via QtA Procedure
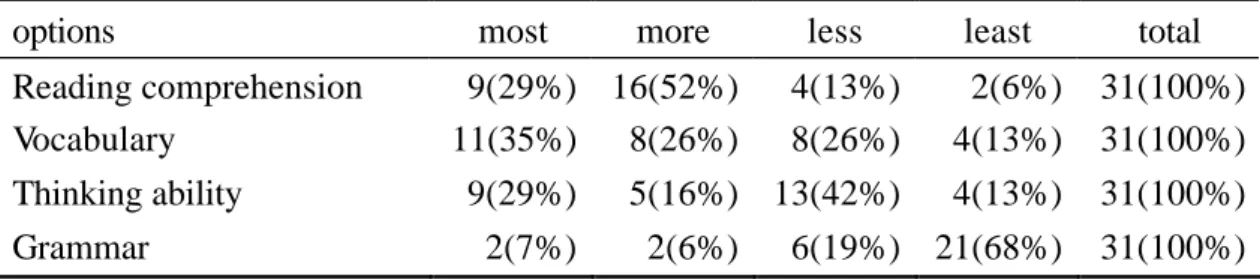
The first question focused on the kind of ability QtA lessons could enhance.
Participants ranked the order for the four skills- reading, vocabulary, thinking and grammar-from the most to the least. The result is shown in Table 26.
Regarding reading comprehension, in total, more than 80 percent students
believed QtA lesson enhanced reading comprehension (29% the most and 52% more)
Table 26. The Ranking of the Ability QtA Lessons Enhance
options most more less least total
Reading comprehension 9(29%) 16(52%) 4(13%) 2(6%) 31(100%) Vocabulary 11(35%) 8(26%) 8(26%) 4(13%) 31(100%) Thinking ability 9(29%) 5(16%) 13(42%) 4(13%) 31(100%)
Grammar 2(7%) 2(6%) 6(19%) 21(68%) 31(100%)
The second skill that is regarded as successfully enhanced via QtA is vocabulary. In total, 61 percent participants claimed a positive attitude toward vocabulary empowerment (35% the most and 26% more).
Following vocabulary, thinking ability was the third skill that QtA lessons enhanced, with 45 percent participants regarded QtA lesson promoted thinking (29%
the most and 16% more).
For grammar, only 13 percent participants increased; almost ninety percent participants did not think their grammar had been improved through the instruction.
In conclusion, the result coheres to the basic concept of the QtA lesson that it prompts not so much on linguistic ability but on global ability, that is, thinking and reading as a whole (Beck et al., 1997).
Perception of Difficulty Encountered in QtA Lessons
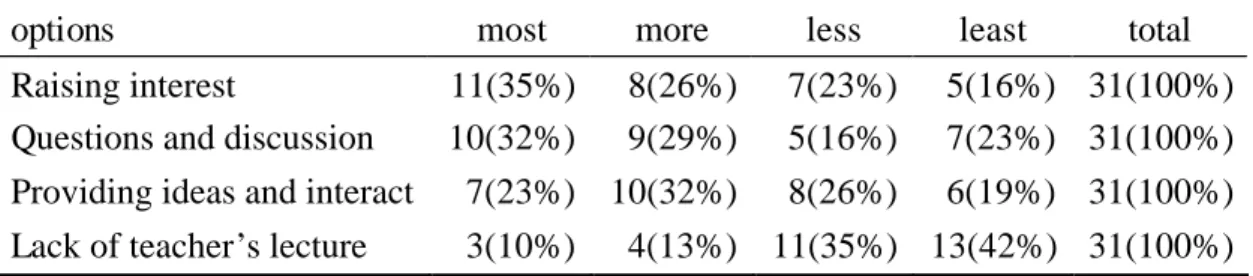
The second question attempted to investigate what difficulty students might encounter in QtA lessons. Table 27 summarizes students’ perception of difficulty.
First, 61 percent of participants think raising interest difficult in QtA lessons (35% the
most and 26 % more).
Table 27. The Ranking of Difficulty QtA Lessons Cause
options most more less least total
Raising interest 11(35%) 8(26%) 7(23%) 5(16%) 31(100%) Questions and discussion 10(32%) 9(29%) 5(16%) 7(23%) 31(100%) Providing ideas and interact 7(23%) 10(32%) 8(26%) 6(19%) 31(100%) Lack of teacher’s lecture 3(10%) 4(13%) 11(35%) 13(42%) 31(100%)
As for the understanding of the questions and the content, 61 percent of the participants (32% the most and 29% more) expressed difficulty in understanding the questions and the content of QtA lessons.
In addition to raising interest and understanding questions and contents, the third aspect was whether they had difficulty providing their own idea or interacting with others. 55 percent of the participants (23% the most and 32% more) thought providing ideas and interacting difficult.
The last part is students’ perceptions of teacher’s lecture. Only 23 percent of the participants (10% the most and 13% more) felt it difficult without the teacher’s lecture. The rest of seventy-seven percent of participants (35% less and 42% the least) did not think lack of teacher’s lecture caused difficulty in learning in QtA lessons. Although they listened to the teacher’s lecture all the time, the majority found they had few problems in the new lessons in this aspect.
Attitudes towards QtA Lessons
The third question probes to present students’ attitudes toward QtA lessons.
The open-ended question was composed of three sub questions. The first one was
about the difference of QtA lessons and the traditional teaching style. Every
student’s response was categorized into one of the five items. Table 28 gives a full
account of the result. The second one was whether they liked QtA lessons and the
reasons why. The third one was to see their opinion about having more QtA lessons in the future.
Table 28. Opinions about the Difference between QtA Lessons and the Traditional Teaching Style
Items N = 31(100%)
Teacher-student interaction 10(32%)
Relaxing, active, learn together, interesting 8(26%)
Discussions 6(19%)
No difference 5(16%)
So-so 2(7%)
As Table 28 shows, 32 percent of the participants stated QtA lessons focused on teacher-student interaction. 26 percent declared the lessons were active, interesting, relaxing and classmates could learn together, and 19 percent thought that discussions in the lessons were abundant. 16 percent of the participants thought the lessons were not different from the traditional ones and 7% showed no opinion. In total, 77 percent of the participants held a positive view about the new strategy. Their opinions were:
“I can interact with the teacher actively.” (E4)
1(Teacher-student interaction)
“We sit together and feel united.” (E5) (Relaxing, active)
“Everybody is discussing.” (E22) (Discussions)
Next, about their preference toward the QtA lessons, 71 percent of the participants liked QtA lessons; 10 percent of the students held a neutral opinion toward the lesson, but 19 percent did not like QtA lessons at all. Some positive opinions were:
“Yes, I could know more stories and words.” (E20)
1