CHAPTER V
RESULTS AND INTERPRETATIONS
According to the research questions, the first section explored the development of different indicators across interviews; therefore, the descriptive statistics were computed.
To answer questions concerning relationships between the indicators tested, the Pearson correlations were calculated. The second section presented the results of correlation analysis. In order to explore the effect of instruction, a series of independent t-test was used. The third section presented descriptive data, and correlation, sorted by two different groups (experimental group and control group). The fourth section explored the role of students’ academic achievement. Additionally, the descriptive data, result of comparison and result of correlation derived from three different achiever groups was presented in this section. In order to explore the interaction between instructional modes and individual academic achievement, a 2 (instructional modes) x 3 (achievers) factorial design was employed. To address this issue, two-way analysis of variance test (two-way ANOVA) was used to detect significant difference in the fifth section. Furthermore, a discussion of the role of knowledge domain was presented in the sixth section.
V.1 Students’ Development of Cognition, Information Processing, and Metacognitive Regulation Derived from “Flow Map” Technique
This section explored the development of the subjects’ cognitive structure performance, information processing strategies, and metacognitive regulation strategies.
This section contained these three major parts. The first part revealed the performance of cognitive structure. The second part explored the information processing strategies. The last part showed the results of metacognitive regulation strategies.
This study interviewed the subjects across three different units (knowledge domain),
including the bicycle unit (Physics), the rust-proof and decay-proof unit (Chemistry), and
the energy and eco-conservation unit (Earth Science and Biology). The order of data
presentation followed the order of instruction. First, it presented the results from the
bicycle. Then, of the results of rust-proof and decay-proof, and the results from energy and eco-conservation are discussed successively.
V.1.1. Development of cognitive structures
This study tried to explore students’ development of cognitive structure. The cognitive structure contained two indicators, Extent and Richness. As defined in section III.3.3, this section discussed the development of these two indicators from three different units.
V.1.1.1. Students’ descriptive data in the bicycle unit. After transcribing the subjects’
narratives into graphics display by using the “Flow Map” technique, the results for the indicators of cognitive structures were represented in this section. The indicator of Extent showed how many concepts students recalled in interview. The indicator of Richness represented the number of revisited and linked ideas. Table 5.1.1 revealed the subjects’
performance on cognitive structure recalled from four different interview periods after the last instruction of the bicycle unit.
On average, the subjects recalled 3.31 concepts in the first interview. Following recalled concepts was 3.75 (second interview), 3.47 (third interview), and 3.96 (fourth interview). The number of revisited and linked ideas was 0.72 (first interview), 0.88 (second interview), 0.85 (third interview), and 1.00 (fourth interview). The recalled concept was ranging from 0 to 13 and the count of richness was ranging from 0 to 8.
Table 5.1.1. Students’ development of cognitive structure in learning bicycle (n=110)
Extent Richness
Mean S.D. Range Mean S.D. Range
1
stinterview 3.31 2.20 0-11 0.72 1.29 0-8
2
ndinterview 3.75 2.48 0-13 0.88 1.61 0-8
3
rdinterview 3.47 2.11 0-10 0.85 1.32 0-6
4
thinterview 3.96 2.47 0-11 1.00 1.56 0-7
V.1.1.2. Students’ descriptive data in the rust-proof and decay-proof unit. The
following instructional unit was the rust-proof and decay-proof unit. The result of this unit was displayed in Table 5.1.2. On average, the subjects recalled 4.01 concepts in the first interview. Following number of recalled concepts was 4.30 (second interview), 4.50 (third interview), and 4.36 (fourth interview). The number of revisited and linked ideas was 1.54 (first interview), 1.92 (second interview), 1.97 (third interview), and 1.80 (fourth interview). The recalled concept was ranging from 0 to 17 and the count of richness ranged from 0-16 in this unit.
Table 5.1.2. Students’ development of cognitive structure in learning rust-proof and decay-proof (n=110)
Extent Richness
Mean S.D. Range Mean S.D. Range
1
stinterview 4.01 2.53 0-14 1.54 2.12 0-12
2
ndinterview 4.30 2.70 0-15 1.92 2.61 0-16
3
rdinterview 4.50 3.10 0-17 1.97 2.96 0-14
4
thinterview 4.36 2.44 0-12 1.80 2.06 0-9
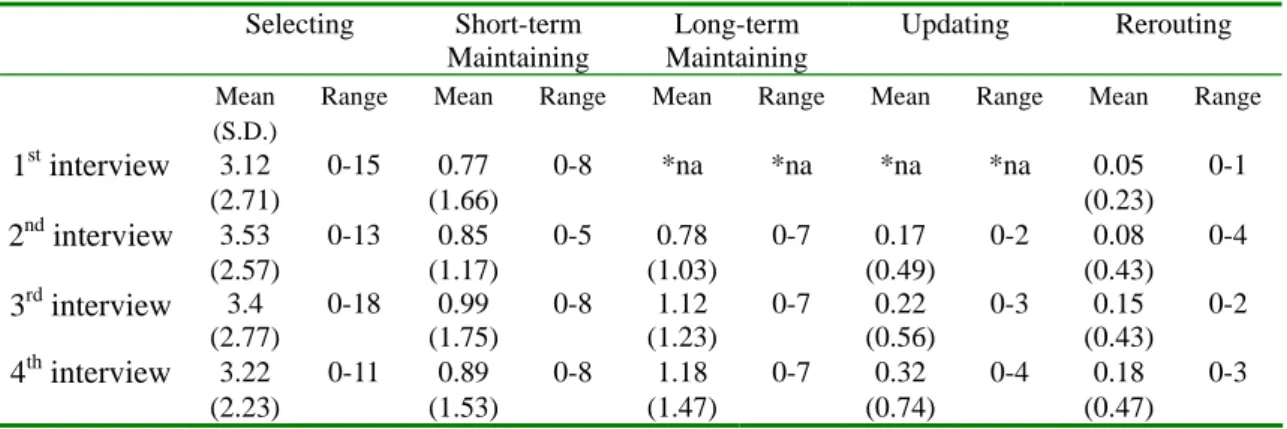
V.1.1.3. Students’ descriptive data in the energy and eco-conservation unit. Table 5.1.3 revealed the results from learning energy and eco-conservation. It showed that the subjects recalled 3.12 concepts in the first interview. Following number of recalled concepts was 3.53 (second interview), 3.40 (third interview), and 3.22 (fourth interview).
The number of revisited and linked ideas was 0.77 (first interview), 0.85 (second
interview), 0.99 (third interview), and 0.89 (fourth interview). The extent was ranging
from 0 to 18 and the richness was ranging from 0 to 8.
Table 5.1.3. Students’ development of cognitive structure in learning energy and eco-conservation (n=110)
Extent Richness
Mean S.D. Range Mean S.D. Range
1
stinterview 3.12 2.71 0-15 0.77 1.66 0-8
2
ndinterview 3.53 2.57 0-13 0.85 1.17 0-5
3
rdinterview 3.40 2.77 0-18 0.99 1.75 0-8
4
thinterview 3.22 2.23 0-11 0.89 1.53 0-8
V.1.1.4. A brief summary of development of cognitive structures. Figure 5.1.1 showed the development of variable Extent across three knowledge domains. It revealed that the number of recalled concepts was increasing from the first interview to the second interview. After the second interview, the development of extent was different, for
example, bicycle unit and energy and eco-conservation unit were in a decreasing pattern from the second interview to the third interview. At the same time, the extent of the rust-proof and decay-proof unit was increasing. Besides, the all measures of rust-proof and decay-proof unit, from the first interview to the fourth interview, were higher than those of bicycle unit and the energy and eco-conservation unit. The further investigation about the knowledge domain was presented in section V.6.
0.00 0.50 1.00 1.50 2.00 2.50 3.00 3.50 4.00 4.50 5.00
1st interview 2nd interview 3rd interview 4th interview
Bicycle
Rust-proof and decay-proof Energy and eco-conservation
Figure 5.1.1: The development of indicator extent
0.00 0.50 1.00 1.50 2.00 2.50
1st interview 2nd interview 3rd interview 4th interview
Bicycle
Rust-proof and decay-proof Energy and eco-conservation
Figure 5.1.2: The development of indicator richness
In Figure 5.1.2, it displayed the development of richness across three knowledge domains. The mean of unit of rust-proof and decay-proof was higher than the rest of two units. This role of knowledge domain was discussed in section V.6.
V.1.2. Development of information processing strategies
After coding the subjects’ recalled concepts that were transcribed by using the
“Flow Map” technique, the results for the indicators of information processing strategy were represented in this section. The information processing strategies contained five indicators, including Defining, Describing, Comparing, Conditional Inferring, and Explaining (Tsai, & Huang, 2001). As to the complexity of aforementioned information processing strategies, defining is viewed as a basic information processing strategy, and explaining is a more sophisticated, higher-rank information processing strategy
4. The following subsections discussed the five indicators respectively. Each section contained the performance of indicator from three instructional units.
V.1.2.1. Students’ descriptive data in the bicycle unit. Table 5.1.4 presented the descriptive data of the bicycle unit. On average, the frequencies of using defining strategy were 0.05 (first interview, second interview, and fourth interview), 0.03 (third interview).
The number of defining was ranging from 0 to 1. Comparing with the other strategies, the subjects might seldom use the defining strategy in this unit.
4 For detailed information, please refer to section III.5.2. Indicators of the information processing strategies
Table 5.1.4. Students’ information processing strategies in learning bicycle (n=110)
Defining Describing Comparing Conditional inferring
Explaining Mean
(S.D.)
Range Mean Range Mean Range Mean Range Mean Range
1
stinterview
0.05 (0.210-1 2.56 (1.69)
0-7 0.41 (0.69)
0-3 0.2 (0.5)
0-2 0.09 (0.29)
0-1
2
ndinterview
0.05(0.21)
0-1 2.72 (1.81)
0-10 0.51 (0.85)
0-4 0.32 (0.63)
0-4 0.16 (0.5)
0-4
3
rdinterview
0.03(0.16)
0-1 2.55 (1.61)
0-7 0.55 (0.88)
0-4 0.21 (0.45)
0-2 0.14 (0.44)
0-2
4
thinterview
0.05(0.21)
0-1 2.89 (1.67)
0-7 0.63 (0.89)
0-4 0.2 (0.54)
0-3 0.2 (0.6)
0-3
As to the describing strategy, Table 5.1.4 showed the frequencies of using
describing strategy 2.56 (first interview), 2.72 (second interview), 2.55 (third interview), and 2.89 (fourth interview). The number of using describing strategy was ranging from 0 to 7 (first, third, and fourth interview), or 0 to 10 (second interview). Table 5.1.4
indicated that the describing strategy was the most frequently used information processing strategy.
As to the comparing strategy, the means were 0.41 (first interview), 0.51 (second interview), 0.55 (third interview), and 0.63 (fourth interview). The frequencies of using comparing strategy was ranging from 0 to 3 (first interview) or 4 (second interview, third interview and fourth interview).
According to Table 5.1.4, for one of the higher-rank information processing strategies, conditional inferring, the frequencies of using this strategy were 0.2 (first interview), 0.32 (second interview), 0.21 (third interview), and 0.2 (fourth interview). It was ranging from 0 to 4.
As to the explaining strategy, the means were 0.09 (first interview), 0.16 (second interview), 0.14 (third interview), and 0.2 (fourth interview). The explaining strategy was ranging from 0 to 4.
V.1.2.2. Students’ descriptive data in the rust-proof and decay-proof unit. Table
5.1.5 revealed the descriptive data of the rust-proof and decay-proof unit. On average, the
frequencies of using defining strategy were 0.19 (first interview), 0.15 (second interview),
0.26 (third interview), and 0.21 (fourth interview). The number of defining was ranging from 0 to 2. Comparing with the other strategies, the defining strategy was the least used in this unit.
As to the describing strategy, Table 5.1.5 showed the frequencies of using describing strategy were 2.66 (first interview), 2.77 (second interview), 2.52 (third interview), and 2.25 (fourth interview). The number of using describing strategy was ranging from 0 to 10 (first interview), 0 to 12 (second interview), 0 to 8 (third interview), and 0 to 6 (fourth interview). It also revealed that the describing strategy was the most frequent information processing strategy.
As to the comparing strategy, the means were 0.8 (first interview), 0.79 (second interview), 0.89 (third interview), and 1.01 (fourth interview).
Table 5.1.5. Students’ information processing strategies in learning rust-proof and decay-proof (n=110)
Defining Describing Comparing Conditional inferring
Explaining Mean
(S.D.)
Range Mean Range Mean Range Mean Range Mean Range
1
stinterview
0.19 (0.44)0-2 2.66 (1.85)
0-10 0.8 (1.06)
0-4 0.3 (0.68)
0-4 0.05 (0.23)
0-1
2
ndinterview
0.15(0.43)
0-2 2.77 (1.91)
0-12 0.79 (1.03)
0-4 0.35 (0.71)
0-4 0.22 (0.6)
0-3
3
rdinterview
0.26(0.58)
0-2 2.52 (1.81)
0-8 0.89 (1.17)
0-6 0.53 (0.9)
0-4 0.32 (0.87)
0-5
4
thinterview
0.21(0.51)
0-2 2.25 (1.32)
0-6 1.01 (1.2)
0-6 0.52 (0.81)
0-3 0.37 (0.89)
0-4
According to Table 5.1.5, the results of conditional inferring showed the frequencies of using this strategy were 0.3 (first interview), 0.35 (second interview), 0.53 (third interview), and 0.52 (fourth interview).
As to the explaining strategy, the means were 0.05 (first interview), 0.22 (second interview), 0.32 (third interview), and 0.37 (fourth interview). The explaining strategy was ranging from 0 to 4. Besides, the frequencies of using explaining strategy was increasing along with interview.
V.1.2.3. Students’ descriptive data in the energy and eco-conservation unit. Table
5.1.6 revealed the descriptive data of the energy and eco-conservation unit. In this unit, the frequencies of using defining strategy were 0.02 (first interview), 0.03 (second interview), 0.03 (third interview), and 0 (fourth interview). According to this table, the students did not use this strategy in the fourth interview.
As to the describing strategy, Table 5.1.6 showed the frequencies of using describing strategy were 2.26 (first interview), 2.35 (second interview), 2.16 (third interview), and 2.14 (fourth interview). The frequencies of using describing strategy was ranging from 0 to 7 (first, third, and fourth interview), 0 to 8 (second interview).
The means of comparing strategy were 0.61 (first interview), 0.98 (second interview), 0.88 (third interview), and 0.69 (fourth interview). The usage of comparing strategy was ranging from 0 to 9.
Table 5.1.6. Students’ information processing strategies in learning energy and eco-conservation (n=110)
Defining Describing Comparing Conditional inferring
Explaining Mean
(S.D.)
Range Mean Range Mean Range Mean Range Mean Range
1
stinterview
0.02 (0.13)0-1 2.26 (1.83)
0-7 0.61 (1.04)
0-6 0.17 (0.49)
0-2 0.05 (0.23)
0-1
2
ndinterview
0.03(0.16)
0-1 2.35 (1.64)
0-8 0.98 (1.45)
0-7 0.08 (0.31)
0-2 0.09 (0.44)
0-4
3
rdinterview
0.03(0.16)
0-1 2.16 (1.63)
0-7 0.88 (1.46)
0-9 0.17 (0.52)
0-3 0.15 (0.43)
0-2
4
thinterview
0(0)
0 2.14 (1.52)
0-7 0.69 (1.08)
0-6 0.22 (0.63)
0-3 0.18 (0.47)
0-3
According to Table 5.1.6, the strategy of conditional inferring, it showed that the subjects used 0.17 (first interview), 0.08 (second interview), 0.17 (third interview), and 0.22 (fourth interview). The number of this indicator was ranging from 0 to 3.
As to the explaining strategy, the means were 0.05 (first interview), 0.09 (second interview), 0.15 (third interview), and 0.18 (fourth interview). The number of explaining strategy was ranging from 0 to 4. Besides, the usage of explaining strategy was increasing along with interview.
V.1.2.4. A brief summary of development of information processing strategies. In
order to display the development of every indicator of information processing strategies from different units, Figure 5.1.3 to Figure 5.1.7 presented relevant charts for
highlighting the development of information processing strategies.
0.00 0.05 0.10 0.15 0.20 0.25 0.30
1st interview 2nd interview 3rd interview 4th interview
Bicycle
Rust-proof and decay-proof Energy and eco-conservation
Figure 5.1.3: The development of indicator defining
Figure 5.1.3 showed that the development of defining across three units. It revealed that the means of rust-proof and decay-proof unit was higher than the other two units.
0.00 0.50 1.00 1.50 2.00 2.50 3.00 3.50
1st interview 2nd interview 3rd interview 4th interview
Bicycle
Rust-proof and decay-proof Energy and eco-conservation
Figure 5.1.4: The development of indicator describing
Figure 5.1.4 revealed that the means of describing strategy was ranging from 2 to 3 across three knowledge domains. According to Figure 5.1.4, it revealed that the application of describing strategy seemed not changed over different knowledge domains.
The further discussion about the role of knowledge domain was presented in section V.6.
0.00 0.20 0.40 0.60 0.80 1.00 1.20
1st interview 2nd interview 3rd interview 4th interview
Bicycle
Rust-proof and decay-proof Energy and eco-conservation
Figure 5.1.5: The development of indicator comparing
In Figure 5.1.5, the means of comparing strategy was increasing in the unit of bicycle and unit of rust-proof and decay-proof. In the energy and eco-conservation unit, the development of comparing strategy was decreasing from the second interview.
0.00 0.10 0.20 0.30 0.40 0.50 0.60
1st interview 2nd interview 3rd interview 4th interview
Bicycle
Rust-proof and decay-proof Energy and eco-conservation
Figure 5.1.6: The development of indicator conditional inferring
Figure 5.1.6 revealed the development of conditional inferring strategy. This chart
showed that the variation could be dramatic during the second interview and third
interview by different knowledge domains. The further exploration about the role of
knowledge domain was discussed in section V.6.
0.00 0.05 0.10 0.15 0.20 0.25 0.30 0.35 0.40
1st interview 2nd interview 3rd interview 4th interview
Bicycle
Rust-proof and decay-proof Energy and eco-conservation
Figure 5.1.7: The development of indicator explaining
Figure 5.1.7 showed the application of explaining strategy. It revealed that the frequencies of using explaining strategy were increasing along with interview. It showed that the students might use the higher-rank information processing strategy in reconstruction of knowledge. This finding was similar to previous study. (e.g. Tsai &
Huang ; 2001). On the other hand, the basic strategy, for example, the frequency of using describing strategy decreased by interviews. Because of the limited capacity of working memory, the students tried to use the higher-rank information processing strategy to organize or integrate information. Therefore, the usage of explaining strategy was increasing by interviews.
Comparing with the information processing strategies across three different units, it revealed that the defining was the least used. The subjects might rely on the describing strategies in learning. These higher-rank information processing strategies, comparing, conditional inferring, and explaining, might be varied with interviews. The further correlational analysis about these indicators of information processing was discussed in section V.2.
V.1.3. Development of metacognitive regulation strategies
In this section, the descriptive data of metacognitive regulation strategies was
presented first. Moreover, the subjects were administrated the Pupils’ Metacognitive
Scale questionnaire; therefore, the result of this scale was also presented.
The metacognitive regulation strategies contained five indicators, including Selecting, Short-term Maintaining, Long-term Maintaining, Updating, and Rerouting (Shimamura, 2000). The order of aforementioned strategies was sorted by their sophistication, for example, selecting is basic metacognitive regulation strategies, and rerouting is more advanced, higher-rank metacognitive regulation strategy (Shimamura, 2000).
V.1.3.1. Students’ descriptive data on bicycle unit. Table 5.1.7 revealed the descriptive data of the bicycle unit. On average, the frequencies of using selecting strategy were 3.31 (first interview), 3.75 (second interview), 3.47 (third interview), and 3.96 (fourth interview). The number of selecting was ranging from 0 to 13.
As to the short-term maintaining strategy, Table 5.1.7 showed the frequencies of using this strategy were 0.72 (first interview), 0.88 (second interview), 0.85 (third interview), and 1 (fourth interview). The means of using short-term maintaining strategy was ranging from 0 to 8 (first interview and second interview), 0 to 6 (third interview), and 0 to 7 (fourth interview).
As to the long-term maintaining and updating strategies, these two indicators should compare with previous interview; therefore, the result was derived only from the second interview, the third interview and the fourth interview. The means of using long-term maintaining strategy were 1.31 (second interview), 1.47 (third interview), and 1.61 (fourth interview). The frequencies of the usage of long-term maintaining ranged from 0 to 5.
The means of using updating strategy were 0.28 (second interview), 0.4 (third interview), and 0.41 (fourth interview). It was ranging from 0 to 4. The indicator,
long-term maintaining, was a process of retrieving information from long-term memory.
The long-term maintaining means that the individual retrieved the same concept in two
successive interviews. For example, Jason (pseudonym) stated the concept “Painting can
prevent from rust” in the first interview. In the second interview, if Jason retrieved intact
concept “Painting can prevent from rust” that was categorized into application of
long-term maintaining strategy. On the other hand, if Jason retrieved the concept “Paint can prevent from rust. Because the paint could isolate iron from oxygen and water” this could be categorized into updating strategy. In other words, long-term maintaining might rely on long-term memory. The updating was based on long-term memory and additional metacognitive regulation processing. In the bicycle unit, the means of rerouting strategy were 0.15 (first interview), 0.24 (second interview), 0.19 (third interview), and 0.35 (fourth interview). It was ranging from 0 to 5.
Table 5.1.7. Students’ metacognitive regulation strategies in learning bicycle (n=110)
Selecting Short-term Maintaining
Long-term Maintaining
Updating Rerouting Mean
(S.D.)
Range Mean Range Mean Range Mean Range Mean Range
1
stinterview
3.31 (2.20)0-11 0.72 (1.29)
0-8 *na *na *na *na 0.15 (0.45)
0-2
2
ndinterview
3.75(2.48)
0-13 0.88 (1.61)
0-8 1.31 (1.30)
0-5 0.28 (0.59)
0-3 0.24 (0.59)
0-4
3
rdinterview
3.47(2.11)
0-10 0.85 (1.32)
0-6 1.47 (1.28)
0-5 0.37 (0.76)
0-4 0.19 (0.61)
0-4
4
thinterview
3.96(2.47)
0-11 1.00 (1.56)
0-7 1.61 (1.28)
0-5 0.41 (0.77)
0-4 0.35 (0.83)
0-5
*na: not available. The long-term maintaining and updating was not available in the first interview
V.1.3.2. Students’ descriptive data in the rust-proof and decay-proof unit. Table 5.1.8 showed the descriptive data derived from rust-proof and decay-proof unit. On average, the frequencies of using selecting strategy were 4.01 (first interview), 4.3 (second interview), 4.5 (third interview), and 4.36 (fourth interview). It was ranging from 0 to 17.
As to the short-term maintaining strategy, Table 5.1.8 showed the means were 1.54 (first interview), 1.92 (second interview), 1.97 (third interview), and 1.8 (fourth interview). It was ranging from 0 to 16.
As to the long-term maintaining, the means of long-term maintaining were 1.36
(second interview), 1.65 (third interview), and 1.95 (fourth interview). The frequencies of
usage of long-term maintaining ranged from 0 to 8.
Table 5.1.8. Students’ metacognitive regulation strategies in learning rust-proof and decay-proof (n=110)
Selecting Short-term Maintaining
Long-term Maintaining
Updating Rerouting Mean
(S.D.)
Range Mean Range Mean Range Mean Range Mean Range
1
stinterview
4.01 (2.53)0-14 1.54 (2.12)
0-12 *na *na *na *na 0.06 (0.28)
0-2
2
ndinterview
4.30(2.70)
0-15 1.92 (2.61)
0-16 1.36 (1.14)
0-5 0.65 (1.02)
0-4 0.27 (0.72)
0-4
3
rdinterview
4.50(3.1)
0-17 1.97 (2.96)
0-14 1.65 (1.55)
0-7 0.78 (1.16)
0-4 0.33 (0.9)
0-5
4
thinterview
4.36(2.44)
0-12 1.8 (2.06)
0-9 1.95 (1.51)
0-8 0.64 (1.03)
0-5 0.38 (0.9)
0-4
*na: not available. The long-term maintaining and updating was not available in the first interview
As to the higher-rank strategies, the means of updating strategy were 0.65 (second interview), 0.78 (third interview), and 0.64 (fourth interview). It was ranging from 0 to 5.Besides, the means of rerouting strategy was 0.15 (first interview), 0.24 (second
interview), 0.19 (third interview), and 0.35 (fourth interview). It was ranging from 0 to 5.
V.1.3.3. Students’ descriptive data on energy and eco-conservation unit. Table 5.1.9 showed the descriptive data derived from energy and eco-conservation unit. On average, the frequencies of using selecting strategy were 3.12 (first interview), 3.53 (second interview), 3.4 (third interview), and 3.22 (fourth interview). It was ranging from 0 to 18.
Table 5.1.9. Students’ metacognitive regulation strategies in learning energy and eco-conservation (n=110)
Selecting Short-term Maintaining
Long-term Maintaining
Updating Rerouting Mean
(S.D.)
Range Mean Range Mean Range Mean Range Mean Range
1
stinterview
3.12 (2.71)0-15 0.77 (1.66)
0-8 *na *na *na *na 0.05 (0.23)
0-1
2
ndinterview
3.53(2.57)
0-13 0.85 (1.17)
0-5 0.78 (1.03)
0-7 0.17 (0.49)
0-2 0.08 (0.43)
0-4
3
rdinterview
3.4(2.77)
0-18 0.99 (1.75)
0-8 1.12 (1.23)
0-7 0.22 (0.56)
0-3 0.15 (0.43)
0-2
4
thinterview
3.22(2.23)
0-11 0.89 (1.53)
0-8 1.18 (1.47)
0-7 0.32 (0.74)
0-4 0.18 (0.47)
0-3
*na: not available. The long-term maintaining and updating was not available in the first interview
As to the short-term maintaining strategy, Table 5.9 showed the means were 0.77
(first interview), 0.85 (second interview), 0.99 (third interview), and 0.89 (fourth
interview). It was ranging from 0 to 8.The means of long-term maintaining were 0.78
(second interview), 1.12 (third interview), and 1.18 (fourth interview). The frequencies of usage of long-term maintaining was ranging from 0 to 7.In this unit, the means of rerouting strategy were 0.05 (first interview), 0.04 (second interview), 0.15 (third interview), and 0.18 (fourth interview). It was ranging from 0 to 4.
V.1.3.4. A brief summary of development of metacognitive regulation strategies. In order to explore the development of metacognitive regulation strategies across three different knowledge domains, Figure 5.1.8 to Figure 5.1.12 illustrated the development of these five metacognitive regulation strategies by interviews.
0.00 0.50 1.00 1.50 2.00 2.50 3.00 3.50 4.00 4.50 5.00
1st interview 2nd interview 3rd interview 4th interview
Bicycle
Rust-proof and decay-proof Energy and eco-conservation
Figure 5.1.8: The development of indicator selecting
Figure 5.1.8 displayed the development of selecting. Comparing with the other
metacognitive regulation strategies, most of the subjects could use this strategy. In the
unit of rust-proof and decay-proof, the subjects seemed to use more selecting strategy
than the others. This issue about the effect of knowledge domain and indicator was
discussed in the section V.6.
0.00 0.50 1.00 1.50 2.00 2.50
1st interview 2nd interview 3rd interview 4th interview
Bicycle
Rust-proof and decay-proof Energy and eco-conservation
Figure 5.1.9: The development of indicator short-term maintaining Figure 5.1.9 displayed the development of short-term maintaining across three knowledge domains. It revealed that the means of short-term maintaining might vary with knowledge domain. The mean of unit of rust-proof and decay-proof was higher than the rest of two units. The possible relationship or interaction between the performance of short-term maintaining and role of knowledge domain was discussed in the section V.6.
0.00 0.50 1.00 1.50 2.00 2.50
1st interview 2nd interview 3rd interview 4th interview
Bicycle
Rust-proof and decay-proof Energy and eco-conservation
Figure 5.1.10: The development of Long-term maintaining strategy
Figure 5.1.10 showed the long-term maintaining strategy across three knowledge domains. It revealed that this strategy was increasing along the interviews. In addition to this, the unit of rust-proof and decay-proof was higher than energy and eco-conservation.
This result was discussed in the section V.6.
0.00 0.10 0.20 0.30 0.40 0.50 0.60 0.70 0.80 0.90
1st interview 2nd interview 3rd interview 4th interview
Bicycle
Rust-proof and decay-proof Energy and eco-conservation
Figure 5.1.11: The development of indicator updating
Figure 5.1.11 showed the updating strategy across three knowledge domains. It revealed that this strategy was increasing by interviews, except the rust-proof and decay-proof unit. In addition to this, the value in the unit of rust-proof and decay-proof was higher than that in energy and eco-conservation. This result was discussed in section V.6.
Figure 5.1.12 revealed the development of rerouting strategy showing that the frequencies of using this strategy were increasing by interviews.
0.00 0.05 0.10 0.15 0.20 0.25 0.30 0.35 0.40 0.45
1st interview 2nd interview 3rd interview 4th interview
Bicycle
Rust-proof and decay-proof Energy and eco-conservation
Figure 5.1.12: The development of indicator rerouting
The first interview was conducted at the end of formal instruction. The rest of
interviews were conducted a certain period of time after the formal instruction. This
figure revealed that the frequencies of using rerouting were increasing after formal
instruction. This might imply that the rerouting strategy still was utilized in constructing
subjects’ knowledge after the formal instruction.
V.1.3.5. Development of Pupils’ Metacognition Scale. In this study, the Pupils’
Metacognitive Scale (PMCS) was administrated four times. The first one was before the first interview of bicycle unit. This might be regard as the pre-test. The second was held within the fourth interview of bicycle and the first interview of rust-proof and decay-proof. The third was administrated within the fourth interview of rust-proof and decay-proof unit and the first interview of energy and eco-conservation unit. This might be the post-test (I) of PMCS. Finally, the fourth test was implemented after the fourth interview of energy and eco-conservation unit. The fourth test was regarded as the post-test (II). The PMCS contained two aspects, metacognitive knowledge and metacognitive regulation. This documented the development of pupil metacognition.
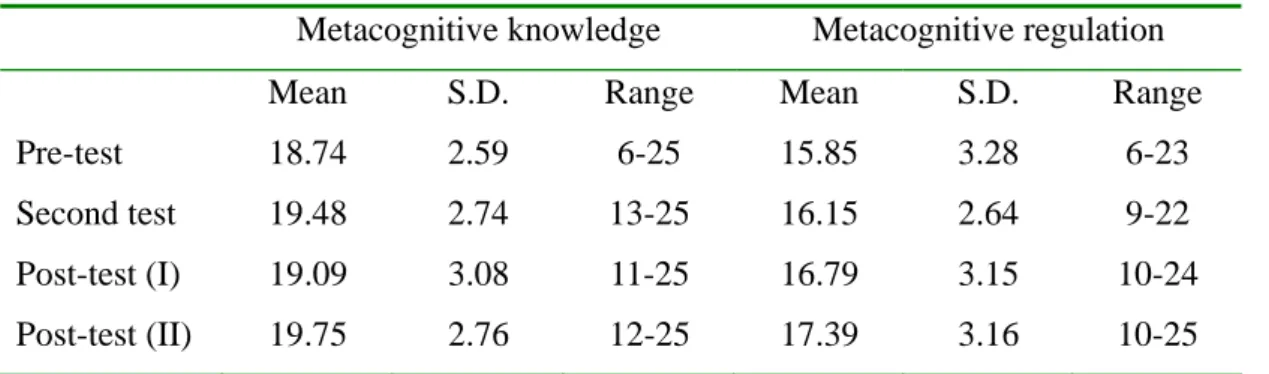
Table 5.1.10 showed the results of PMCS
5. Table 5.1.10. The development of PMCS (n=110)
Metacognitive knowledge Metacognitive regulation
Mean S.D. Range Mean S.D. Range
Pre-test 18.74 2.59 6-25 15.85 3.28 6-23
Second test 19.48 2.74 13-25 16.15 2.64 9-22
Post-test (I) 19.09 3.08 11-25 16.79 3.15 10-24 Post-test (II) 19.75 2.76 12-25 17.39 3.16 10-25
In order to explore the development of PMCS, the results were shown in Figure 5.13. Figure 5.1.13 revealed that the means of metacognitive knowledge were higher than metacognitive regulation. In addition, Figure 5.1.13 showed that the two subscales were gradually increasing by interviews.
5 For more information about the PMCS, please refer to section III.6. Construction of Pupils’
Metacogntion Scale (PMCS)
0.00 5.00 10.00 15.00 20.00 25.00
Pre-test M iddle test Post-test (I) Post-test (II)
M etacognitive knowledge M etacognitive regulation
Figure 5.1.13: The development of PMCS
V.1.4. A brief summary of descriptive analysis
This section displayed result of descriptive statistics. Further discussions were
necessary, for example, the correlation analysis within indicators. According to the
discussion regarding the development of these indicators, some indicators might vary
with different knowledge domains, for example, rerouting, short-term maintaining,
conditional inferring and so on. The effect of knowledge domain was discussed in section
V.6.
V.2 Correlation of Cognitive Structure, Information Processing Strategy, and Metacognitive Regulation Strategy
This section presented the correlation among the subjects’ cognitive structures, information processing strategies, and metacognitive regulation strategies. In order to highlight the relationship between indicators, three summary tables were presented
6in this section. In every table, a letter was given when the correlation was significant. The letter A was represented as the first interview, the letter B was represented as the second interview, the letter C was represented as the third interview, and the letter D was represented as the fourth interview. The capital letter was represented when the p<.01, the lowercase letter was represented when the p<.05. Besides, every table showed the outcomes of individual unit across four interviews. In other words, the Table 5.2.1 revealed the result correlations of the bicycle unit. Table 5.2.2 showed the results of the rust-proof and decay-proof unit. Table 5.2.3 revealed the results of energy and eco-conservation unit.
In order to explore the correlation between indicators and outcomes of PMCS, all subjects administrated four times of Pupils’ Metacognition Scale (PMCS) questionnaire in different period. The outcomes of PMCS across different periods might represent subjects’ status of metacognitive knowledge and metacognitive regulation.
In every summary table, it contained two results of PMCS; therefore, the maximum number of letter was two. The maximum number of letter of indicators (extent, richness, selecting, short-term maintaining, rerouting, defining, describing, comparing, conditional inferring and explaining) was four, except the indicator long-term maintaining and updating. The maximum number of letter of long-term maintaining and updating was three
7.
V.2.1. Unit of bicycle
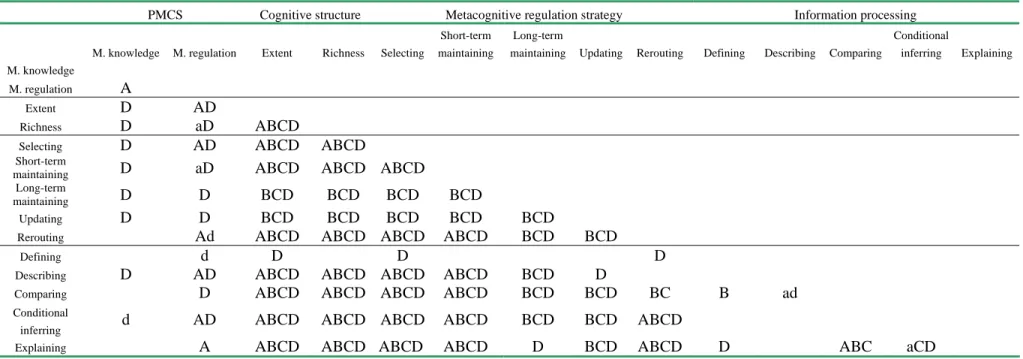
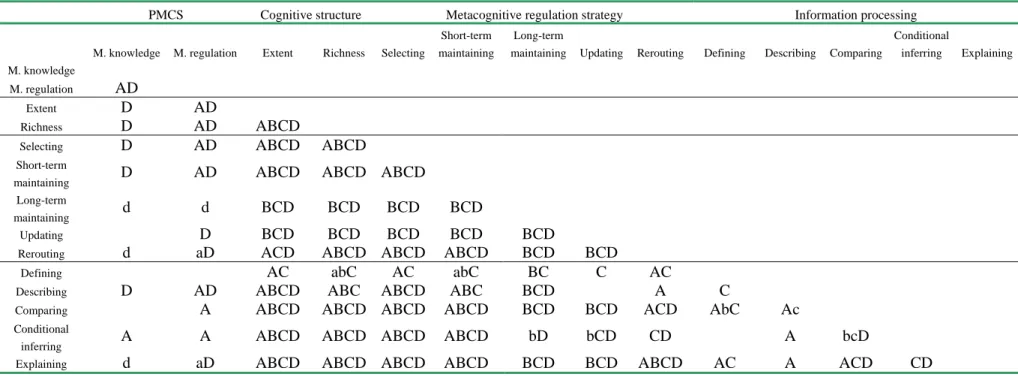
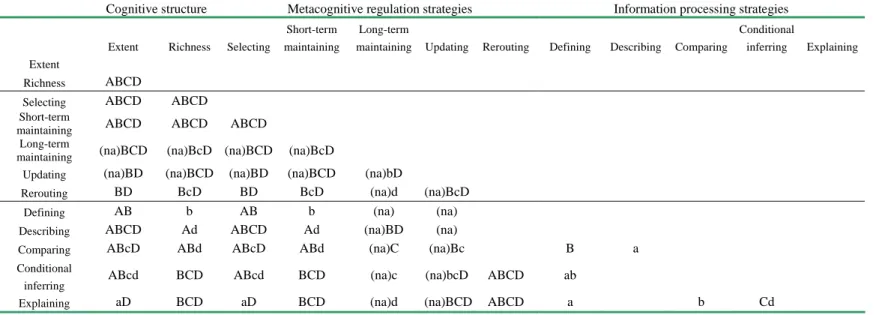
Table 5.2.1 revealed the correlation of all indicators and subscales of PMCS. The
6 For detailed information of correlation results, please refer to Appendix C
7 The result of long-term maintaining and updating was not available in the first interview.
subscale of PMCS, metacognitive regulation, was related to all indicators significantly.
As to the cognitive structures, both indicators; extent and richness, were related to all indicators.
As to the indicators of metacognitive regulation strategies, all of them were related to each other. Moreover, the selecting and short-term maintaining was related to the indicators of information processing strategies. Both strategies, updating and rerouting, were related to higher-rank information processing strategies, for example conditional inferring and explaining. This might indicate that the higher-rank metacognitive regulation strategies were related to higher-rank information processing strategies. In other words, these higher-rank metacognitive regulation strategies might depend on higher-rank or more sophisticated information processing strategies. On the other hand, these higher-rank information processing strategies might be facilitated by these metacognitive regulation strategies.
Table 5.2.1 also showed that the relationships among the indicators of information processing strategies. It revealed that the higher-rank information processing strategy,
“explaining” was related to “comparing” and “conditional inferring”. The finding might
imply that the initial recalled information might be refined by means of metacognitive
regulation strategies. Finally, the individual might yield a more complex concept and
organize the information by means of those higher-rank information processing
strategies.
Table 5.2.1. Correlation among cognitive structure, information processing, metacognitive regulation, and PMCS in unit bicycle (n=110)
PMCS Cognitive structure Metacognitive regulation strategy Information processing
M. knowledge M. regulation Extent Richness Selecting
Short-term maintaining
Long-term
maintaining Updating Rerouting Defining Describing Comparing
Conditional
inferring Explaining M. knowledge
M. regulation
A
Extent
D AD
Richness
D aD ABCD
Selecting
D AD ABCD ABCD
Short-term
maintaining
D aD ABCD ABCD ABCD
Long-term
maintaining
D D BCD BCD BCD BCD
Updating
D D BCD BCD BCD BCD BCD
Rerouting
Ad ABCD ABCD ABCD ABCD BCD BCD
Defining
d D D D
Describing
D AD ABCD ABCD ABCD ABCD BCD D
Comparing
D ABCD ABCD ABCD ABCD BCD BCD BC B ad
Conditional
inferring
d AD ABCD ABCD ABCD ABCD BCD BCD ABCD
Explaining
A ABCD ABCD ABCD ABCD D BCD ABCD D ABC aCD
a: first interview, b: second interview, c: third interview, d: fourth interview
The capital letter was represented when the p<.01, the lowercase letter was represented when the p<.05.
This table was derived from Appendix C: Table 5A.2.1 to Table 5A.2.4
V.2.2. Unit of rust-proof and decay-proof
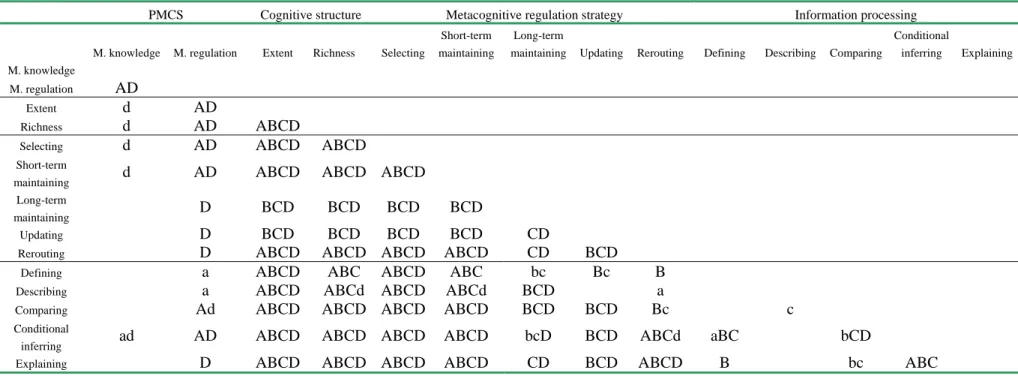
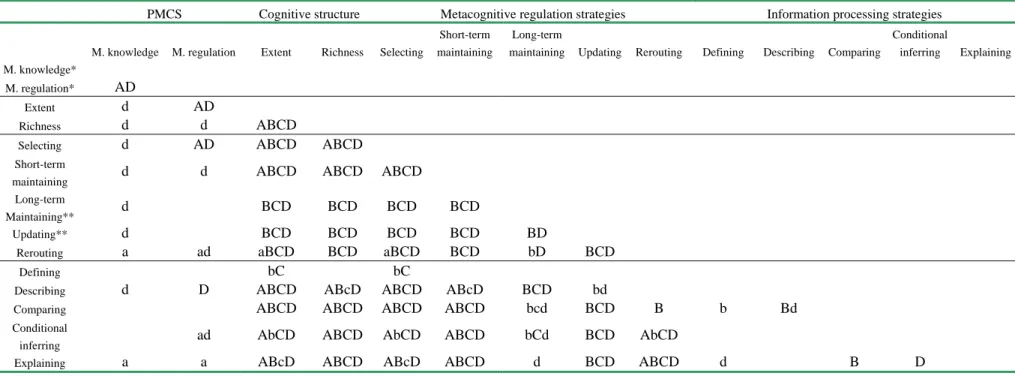
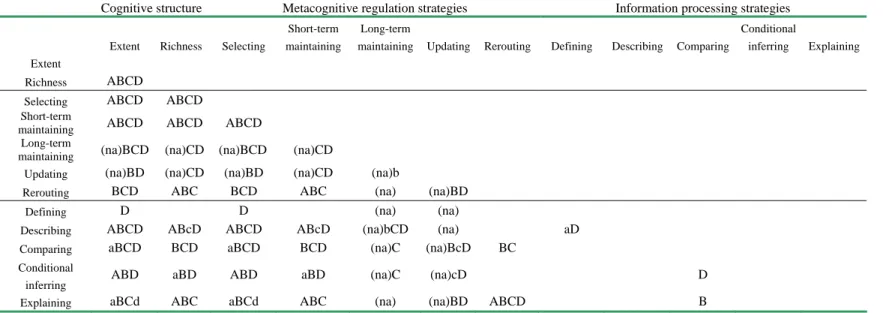
Table 5.2.2 showed the correlation outcomes of rust-proof and decay-proof unit. It revealed that the subscale of PMCS, metacognitive regulation, was related to all indicators significantly. This finding was similar to the result of the bicycle unit.
As to the cognitive structure, both indicators, extent and richness, were related to metacognitive regulation strategies and information processing strategies. The findings were similar to those in previous learning unit. By means of flow map method, the retrieved information not only could be presented as individual’s cognitive structures but also could be provided for further investigation, including metacognitive regulation strategies and information processing strategies.
The finding also revealed that the metacognitive regulation strategies were related to each other significantly. Moreover, the selecting and short-term maintaining were related to indicators of information processing strategies, such as comparing, conditional inferring. Both strategies, updating and rerouting, were related to higher-rank information processing strategies, including conditional inferring and explaining. This might indicate that the higher-rank metacognitive regulation strategies were related to higher-rank information processing strategies. In other words, these higher-rank metacognitive regulation strategies might depend on higher-rank or more sophisticated information processing strategies. On the other hand, these higher-rank information processing strategies might be facilitated by these metacognitive regulation strategies.
Table 5.2.2 also showed that the relationships of the indicators of information processing strategies. It revealed that the higher-rank information processing strategy, explaining, was related to comparing and conditional inferring. The finding might imply that the initial recalled information might be refined by means of further processing.
Finally, the individual might yield a more complex concept and organize the information
by means of those higher-rank information processing strategies.
Table 5.2.2. Correlation among cognitive structure, information processing, metacognitive regulation, and PMCS in unit rust-proof and decay-proof (n=110)
PMCS Cognitive structure Metacognitive regulation strategy Information processing
M. knowledge M. regulation Extent Richness Selecting
Short-term maintaining
Long-term
maintaining Updating Rerouting Defining Describing Comparing
Conditional
inferring Explaining M. knowledge
M. regulation
AD
Extent
d AD
Richness
d AD ABCD
Selecting
d AD ABCD ABCD
Short-term
maintaining
d AD ABCD ABCD ABCD
Long-term
maintaining
D BCD BCD BCD BCD
Updating
D BCD BCD BCD BCD CD
Rerouting
D ABCD ABCD ABCD ABCD CD BCD
Defining
a ABCD ABC ABCD ABC bc Bc B
Describing
a ABCD ABCd ABCD ABCd BCD a
Comparing
Ad ABCD ABCD ABCD ABCD BCD BCD Bc c
Conditional
inferring
ad AD ABCD ABCD ABCD ABCD bcD BCD ABCd aBC bCD
Explaining
D ABCD ABCD ABCD ABCD CD BCD ABCD B bc ABC
a: first interview, b: second interview, c: third interview, d: fourth interview
The capital letter was represented when the p<.01, the lowercase letter was represented when the p<.05.
This table was derived from Appendix C: Table 5A.2.5 to Table 5A.2.8.
V.2.3. Unit of energy and eco-conservation
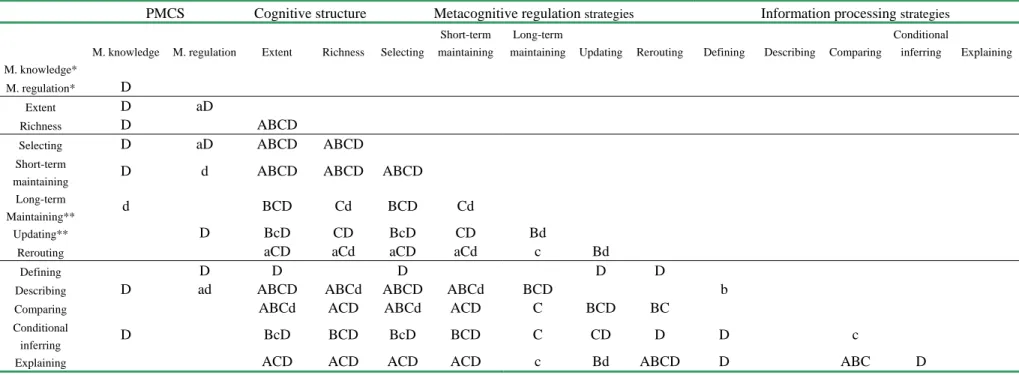
Table 5.2.3 showed the outcomes of energy and eco-conservation unit. It revealed that the subscale of PMCS, metacognitive regulation, was related to some indicators significantly, such as extent, short-term maintaining, rerouting.
As to the indicators of cognitive structures; extent and richness, both of them were related to metacognitive regulation strategies and information processing strategies significantly.
The exploration of the relationships of indicators of metacognitive regulation strategies revealed that all of indicators were related to each other. Moreover, the higher-rank metacognitive regulation strategies, updating and rerouting, were related to higher-rank information processing strategies, including comparing, conditional inferring and explaining. This might indicate that the application of higher-rank metacognitive regulation strategies depended on some higher-rank, complex, and sophisticated information processing strategies. On the other hand, there was a significant relationship between higher-rank information processing strategies and metacognitive regulation strategies in learning.
As to the relationships of indicators of information processing strategies, it also
revealed that the higher-rank information processing strategy, explaining, was related to
comparing and conditional inferring significantly. This finding might reveal that these
higher-rank information processing strategies could support each other.
Table 5.2.3. Correlation among cognitive structure, information processing, metacognitive regulation, and PMCS in unit energy and eco-conservation (n=110)
PMCS Cognitive structure Metacognitive regulation strategy Information processing
M. knowledge M. regulation Extent Richness Selecting
Short-term maintaining
Long-term
maintaining Updating Rerouting Defining Describing Comparing
Conditional
inferring Explaining M. knowledge
M. regulation
AD
Extent
D AD
Richness
D AD ABCD
Selecting
D AD ABCD ABCD
Short-term
maintaining
D AD ABCD ABCD ABCD
Long-term
maintaining
d d BCD BCD BCD BCD
Updating
D BCD BCD BCD BCD BCD
Rerouting
d aD ACD ABCD ABCD ABCD BCD BCD
Defining
AC abC AC abC BC C AC
Describing
D AD ABCD ABC ABCD ABC BCD A C
Comparing
A ABCD ABCD ABCD ABCD BCD BCD ACD AbC Ac
Conditional
inferring
A A ABCD ABCD ABCD ABCD bD bCD CD A bcD
Explaining
d aD ABCD ABCD ABCD ABCD BCD BCD ABCD AC A ACD CD
a: first interview, b: second interview, c: third interview, d: fourth interview
The capital letter was represented when the p<.01, the lowercase letter was represented when the p<.05.
This table was derived from Appendix C: Table 5A.2.9 to Table 5A.2.12.
V2.4. A brief summary of correlation analysis
According to previous findings, the subscale of metacognitive regulation of PMCS was related to other indicators significantly. This might imply that the metacognitive regulation of PMCS could offer an understanding of individual’s metacognition.
Moreover, in the exploration of metacognitive regulation strategies, it might offer an underpinning for the PMCS, especially in the subscale of metacognition regulation.
When investigating the indicators of cognitive structures, extent and richness, it revealed that both of them were related to information processing strategies and metacognitive regulation strategies significantly. This study tried to use the flow map method to obtain individual’s cognitive structures. In exploring the relationship between cognitive structures and other indicators, the findings indicated that the cognitive
structures could offer more information for further exploration, for example, information processing strategies, and metacognitive regulation strategies. This finding might imply that the flow map seemed to extend its potential function and offer further applications (Tsai & Huang, 2002).
According to the correlation analysis, the metacognitive regulation strategies were related to each other significantly. Moreover, the higher-rank metacognitive regulation strategies (i.e. updating strategy and rerouting strategy) were related to higher-rank information processing strategies (i.e. comparing, conditional inferring and explaining) significantly. In other words, the relationship between application of metacognitive regulation strategies (i.e. updating strategy and rerouting strategy) and sophisticated information processing strategies (i.e. conditional inferring and explaining) was significantly. These higher-rank information strategies might offer more important information for individual’s following metacognitive regulation. For example, Peter’s (pseudonym) interview showed the concept “painting could prevent iron from rust”
(comparing strategy) and concept “in lab, we found that once the iron contacted with water and air, the rust would be generated” (conditional inferring). In the second
interview, Peter presented the concept “painting could prevent iron from rust, because the
paints could isolate from water and air” (conditional inferring). The combination of concepts might indicate that Peter could apply the updating strategy to his learning. In his third interview, Peter showed the concept “rust results from water and oxygen; therefore, painting could prevent from rust. The reason is the painting would isolate iron from water and oxygen” (explaining). In this interview, Peter tried to make causal relation between rust and rust-proof. This interview indicated that Peter might use rerouting strategy.
According to the content of concept, it revealed that Peter should understand the key concept of this unit. In the fourth interview, Peter uttered the same concept “rust results from water and oxygen; therefore, zinc coding, and painting could isolate from water and oxygen” (explaining). In this interview, Peter added the concept “zinc coding” to the previous concept. This process revealed that Peter seemed to use metacognitive regulation strategies in his learning even after formal instruction. According to
aforementioned discussion, it indicated that these higher-rank metacognitive regulation strategies and information processing strategies might play an important role in learning.
As to the relationship within information processing strategies, it revealed that the higher-rank information processing strategies were related to each other. The defining and describing perhaps were related to higher-rank indicators. But their relationships might be varied with learning unit or interview. In other words, their relationships were not in a stable condition. On the other hand, the relationships within higher-rank information processing strategies were in a stable way. They could not be varied with learning unit or interview.
This section provided a brief discussion about the relationship of indicators. Further discussion is necessary, for example the instructional modes and the role of achievement.
The relevant discussions were presented in the following section.
V.3 Role of Instruction
The following discussion presented the results of further exploration about the role of instruction. This section contained four subsections. V.3.1 presented the result in learning the bicycle unit. V.3.2 discussed the result which came from the rust-proof and decay-proof unit. V.3.3 explored the finding in learning the energy and eco-conservation unit. Moreover, the V.3.4 provided a summary discussion about the role of instruction.
In every subsection, the comparison between the inquiry instructional mode and the traditional instructional mode was discussed. The comparison includes the indicators of cognitive structure, indicators of metacognitive regulation strategies, and indicators of information processing strategies. Moreover, the correlational analysis was discussed separately.
In order to highlight the finding of this section, a summary table was presented. In the summary table, a letter was presented when the comparison was significant
8. The letter A was represented as the first interview, the letter B was represented as the second interview, the letter C was represented as the third interview, and the letter D was
represented as the fourth interview. The capital letter was represented when the p<.01, the lowercase letter was represented when the p<.05. As to the correlation results, the same legend was used in summary table of correlation results
9.
V.3.1. Comparison in the bicycle unit
In order to explore the influence of instructional modes on cognitive structure, metacognitive regulation strategies, and information processing strategies, Table 5.3.1 showed the results of comparison between these two instructional modes by interviews in the bicycle unit. In Table 5.3.1 revealed that the difference was significant in the
cognitive structures, metacognitive regulation strategies, and some information processing strategies (comparing, conditional inferring and explaining).
8 For detailed information about the result of comparison, please refer to Appendix D
9 For detailed information about the result of correlation, please refer to Appendix E
Table 5.3.1. Results of comparison in the bicycle unit (n=110)
Experimental group
(n=54)
Control group (n=56) Cognitive structures
Extent aD Richness aBd Metacognitive regulation strategies
Selecting aD
Short-term maintaining aBd
Long-term maintaining d
Updating BcD Rerouting aBD Information processing strategies
Defining Describing Comparing D
Conditional inferring Cd
Explaining bcd
A: First interview, B: Second interview, C: Third interview, D: Fourth interview
The capital letter was represented when the p<.01, the lowercase letter was represented when the p<.05.
This table was derived from Appendix D: Table 5A.3.1 to Table 5A.3.4.
Table 5.3.1 indicated that the inquiry instructional mode could enhance the performance in these indicators, for example it could help students to retrieve more information (extent) and to reconstruct more complex cognitive structures (richness).
Moreover, the inquiry instructional mode could elaborate the application of
metacognitive regulation strategies, for example use the updating strategies to refine learned concepts, or use the rerouting strategies to extend or integrate learned concepts.
As to the information processing strategies, the experimental group seemed to use more higher-order information processing strategies after the inquiry instruction. In other words, the inquiry instructional mode provided richer opportunities for reflection.
Consequentially, the process of reflection could enhance the application of metacognition
(e.g. Baird et al., 1991; Kuhn and Dean, 2004) Moreover, the table revealed that the
effect of inquiry instructional mode could be extended to the fourth interview. In other
words, the inquiry instruction mode could help individual keeping reconstructing
knowledge even after the formal instruction period.
Table 5.3.2 revealed the results of correlational analysis of experimental group. This table revealed that both of subscales of PMCS were related to each other. The
metacognitive knowledge was related to some indicators in the fourth interview, for example the richness and updating. The metacognitive regulation was related to the extent, selecting, rerouting, conditional inferring and explaining significantly in the fourth interview. It might indicate that the inquiry instructional mode might enhance the
performance of those higher-order strategies, for example, richness and conditional inferring. As to the indicators of cognitive structures, both of indicators were related to each other, moreover, they were related to all metacognitive regulation strategies. Besides, both of them were related to describing, comparing, conditional inferring, and explaining.
This might indicate that the flow map method could provide more information to further study in metacognition and information processing.
As to the relationship of metacognitive regulation strategies, this table revealed that all of these five strategies were related to each other. In other words, these strategies might depend on each other. For example, the updating strategy might depend on selecting strategy. By means of selecting, individual could select relevant concept and reorganize or update these concepts in the following interview. As to the short-term maintaining strategy, it was related to long-term maintaining, updating, and rerouting.
This might revealed that the short-term maintaining strategy could facilitate the application of updating and rerouting.
As to the relationships between metacognitive regulation strategies and information processing strategies, the rerouting related to high-rank information processing strategies, conditional inferring and explaining. This revealed that those high-rank information processing strategies might enhance the usage of updating and rerouting strategy.
As to the control group, the subscale of PMCS, metacognitive knowledge, was not
related to the other indicators in the first interview. Besides, the metacognitive regulation
was related to some indicators, for example extent, selecting, and describing in the first
interview. After the formal instruction, the subscale of metacognitive knowledge was
related to some indicators. Moreover, the metacognitive regulation was related to some indicators. This finding might reveal that the traditional and inquiry instruction could enhance the understanding of metacognitive knowledge. As to the metacognitive
regulation, the traditional instructional mode seemed to only facilitate some strategies, for example updating, defining, and describing.
As to the cognitive structures, Table 5.3.3 revealed that both of indicators of cognitive structures were related to metacognitive regulation strategies and information processing strategies significantly. This indicated that the flow map method could
provide rich information in exploring metacognitive regulation strategies and information processing strategies.
In exploring the relationships of metacognitive regulation strategies, it revealed that the relationship might be change over interview, for example short-term maintaining strategy, updating strategy and rerouting strategy. In other words, these metacognitive regulation strategies could be independent.
As to the relationships between metacognitive regulate strategies and information processing strategies, Table 5.3.3 revealed that the relationships were not stable. For example, the higher-rank metacognitive regulation strategy, rerouting was related the basic information processing strategy, defining strategy. As to the comparing strategy and conditional inferring strategy, both higher-rank strategies were seldom related to
higher-rank metacognitive regulation strategies, for example, updating strategy and rerouting strategy.
In the bicycle unit, it revealed that the experimental group (inquiry instructional
mode) exhibited a significant relationship between higher-rank metacognitive regulation
strategies and higher-rank information processing strategies. In addition to previous
finding, this finding showed that the metacognitive knowledge could be facilitated by
means of inquiry instruction. As to the metacognitive regulation, the inquiry instructional
mode could enhance the application of metacognitive regulation strategies.
Table 5.3.2. Correlation of experimental group among cognitive structure, information processing, metacognitive regulation, and PMCS in the bicycle unit (n=54)
PMCS Cognitive structure Metacognitive regulation strategies Information processing strategies
M. knowledge M. regulation Extent Richness Selecting
Short-term maintaining
Long-term
maintaining Updating Rerouting Defining Describing Comparing
Conditional
inferring Explaining M. knowledge*
M. regulation* AD
Extent d AD
Richness d d ABCD
Selecting d AD ABCD ABCD
Short-term
maintaining d d ABCD ABCD ABCD
Long-term
Maintaining** d BCD BCD BCD BCD
Updating** d BCD BCD BCD BCD BD
Rerouting a ad aBCD BCD aBCD BCD bD BCD
Defining bC bC
Describing d D ABCD ABcD ABCD ABcD BCD bd
Comparing ABCD ABCD ABCD ABCD bcd BCD B b Bd
Conditional
inferring ad AbCD ABCD AbCD ABCD bCd BCD AbCD
Explaining a a ABcD ABCD ABcD ABCD d BCD ABCD d B D
A: First interview, B: Second interview, C: Third interview, D: Fourth interview
The capital letter was represented when the p<.01, the lowercase letter was represented when the p<.05.
*:The subscales of PMCS only obtained in the first interview and the fourth interview.
**: Long-term maintaining and updating was not available in the first interview.
This table was derived from Appendix E: Table 5A.3.13,Table 5A.3.15, Table 5A.3.17, Table 5A.3.19
Table 5.3.3. Correlation of control group among cognitive structure, information processing, metacognitive regulation, and PMCS in the bicycle unit (n=56)
PMCS Cognitive structure Metacognitive regulation strategies Information processing strategies
M. knowledge M. regulation Extent Richness Selecting Short-term maintaining
Long-term
maintaining Updating Rerouting Defining Describing Comparing
Conditional
inferring Explaining M. knowledge*
M. regulation* D
Extent D aD
Richness D ABCD
Selecting D aD ABCD ABCD
Short-term
maintaining D d ABCD ABCD ABCD
Long-term
Maintaining** d BCD Cd BCD Cd
Updating** D BcD CD BcD CD Bd
Rerouting aCD aCd aCD aCd c Bd
Defining D D D D D
Describing D ad ABCD ABCd ABCD ABCd BCD b
Comparing ABCd ACD ABCd ACD C BCD BC
Conditional
inferring D BcD BCD BcD BCD C CD D D c
Explaining ACD ACD ACD ACD c Bd ABCD D ABC D
A: First interview, B: Second interview, C: Third interview, D: Fourth interview
The capital letter was represented when the p<.01, the lowercase letter was represented when the p<.05.
*:The subscales of PMCS only obtained in the first interview and the fourth interview.
**: Long-term maintaining and updating was not available in the first interview
This table was derived from Appendix E: Table 5A.3.14,Table 5A.3.16, Table 5A.3.18, Table 5A.3.20
V.3.2. Comparison in the rust-proof and decay-proof unit
In order to explore the difference between both groups in the rust-proof and decay-proof unit, Table 5.3.4 showed the results of comparison. The investigation of relationship between two different instructional modes was presented in Table 5.3.5 (experimental group), and Table 5.3.6 (control group).
Table 5.3.4. Results of comparison in the rust-proof and decay-proof unit (n=110)
Experimental group
(n=54)
Control group (n=56) Cognitive structures
Extent CD Richness bCD
Metacognitive regulation strategies
Selecting CD
Short-term maintaining bCD
Long-term maintaining D
Updating BCD
Rerouting CD Information processing strategies
Defining d*
Describing Comparing ABCD
Conditional inferring CD
Explaining CD
A: First interview, B: Second interview, C: Third interview, D: Fourth interview
The capital letter was represented when the p<.01, the lowercase letter was represented when the p<.05.
italic and bold capital letter was represented when the p<.00 d* the means of control group was greater than experimental groups This table was derived from Appendix D: Table 5A.3.5 to Table 5A.3.8.