科技部補助專題研究計畫報告
從都市之區域地理條件及家戶活動探討住宅能耗之時空比較分 析
報 告 類 別 : 成果報告 計 畫 類 別 : 個別型計畫
計 畫 編 號 : MOST 108-2410-H-006-091- 執 行 期 間 : 108年08月01日至109年07月31日 執 行 單 位 : 國立成功大學都巿計劃學系(所)
計 畫 主 持 人 : 陳彥仲
計畫參與人員: 碩士班研究生-兼任助理:黃守平 碩士班研究生-兼任助理:黃敏則 碩士班研究生-兼任助理:管彥婷
本研究具有政策應用參考價值:□否 ■是,建議提供機關內政部,經濟 部
(勾選「是」者,請列舉建議可提供施政參考之業務主管機關)
本研究具影響公共利益之重大發現:■否 □是
中 華 民 國 109 年 10 月 05 日
中 文 摘 要 : 台灣的有92%以上的能源是進口的,自給自足的能源非常有限。然 而,與日本等其他能源進口國相比,台灣的電價相當便宜。此導致 了電力過度的使用,特別是在台灣的住宅部門。本研究主要從需求 面,探討縣市層級的用電量及其影響因素,包括:居住習慣、當地 氣候、家庭經濟狀況、建築特徵和人口因素等。研究資料為2012年 至2016年政府部門公開之追蹤數據。另外,研究中使用合併均值
(PMG)模型進行估計,PMG為每個縣提供了短期使用特徵類型,以 便可以提供有關如何由下而上的修改政策的建議。透過構建之模型
,評估可能影響住宅用電的能源政策。
中 文 關 鍵 詞 : 住宅用電、Pooled Mean Group model、能源政策
英 文 摘 要 : More than 92% of Taiwan energy sources are imported, including coal, oil, natural gas, etc., because self- supported energy sources are quite limited. Nevertheless, the electric power price in Taiwan is rather cheap as
compared to other energy-imported countries, such as Japan.
This results in the issue of potential overuse of electric power beyond that really needed in Taiwan, especially in the residential sector. In this paper, we focused on the demand side to explore electricity consumption and factors affecting it at the county level. The factors include
residence habits, local climate, household economic status, building characteristics, and demographic factors, among others. The empirical data were selected from panel type data sources from 2012 to 2016. The data were collected from open data from governmental departments’. Also, applying individual effects was regarded as the habit difference effect in each county. Estimated was conducted using the pooled mean group (PMG) model. PMG provided
short-term use-characteristic types for each county so that advice could be provided to local government agencies
related to how to modify policies based on a bottom-up aspect. With the constructed model, we were able to
evaluate some energy policies that may affect residential power use.
英 文 關 鍵 詞 : Residential Electricity consumption, Pooled Mean Group model, Energy policy
Modeling Residential Electricity Consumption and Energy Policy Analysis in Taiwan
Abstract
More than 92% of Taiwan energy sources are imported, including coal, oil, natural gas, etc., because self-supported energy sources are quite limited. Nevertheless, the electric power price in Taiwan is rather cheap as compared to other energy-imported countries, such as Japan. This results in the issue of potential overuse of electric power beyond that really needed in Taiwan, especially in the residential sector. In this paper, we focused on the demand side to explore electricity consumption and factors affecting it at the county level. The factors include residence habits, local climate, household economic status, building characteristics, and demographic factors, among others. The empirical data were selected from panel type data sources from 2012 to 2016. The data were collected from open data from governmental departments’. Also, applying individual effects was regarded as the habit difference effect in each county. Estimated was conducted using the pooled mean group (PMG) model. PMG provided short-term use-characteristic types for each county so that advice could be provided to local government agencies related to how to modify policies based on a bottom-up aspect.
With the constructed model, we were able to evaluate some energy policies that may affect residential power use.
Keywords: Residential Electricity consumption, Pooled Mean Group model, Energy
policy1. Introduction
Since the industrial revolution in the 18th century, the manufacturing process for goods has changed from human and animal power to machines. The power to run these machines has come from coal, iron, steel and steam engines. Because of the discovery of oil fields in the 20
th
century and the use of internal combustion engines, the consumption of fuel has increased annually. According to Climate Change 2013: ThePhysical Science Basis published by the Intergovernmental Panel on Climate Change
(IPCC), since 1750, human activities have increased the concentration of greenhouse gases such as CO2
, CH4
, and N2
O in the atmosphere. In 2011, the concentrations of CO2
, CH4
, and N2
O were 391 ppm, 1803 ppb, and 324 ppb, respectively, which exceeded the pre-industrial revolutionary concentration of 40 %, 150% and 20%, reaching the highest in the past 80,000 years (IPCC, 2013).In 2014, 3.9 billion people lived in urban areas, accounting for 54% of the world's total population. The percent of the world's population living in urban areas is expected to rise to 66% by 2050 (UN, 2014). Therefore, the population is concentrated in urban areas, making urban areas an important field of action in response to climate change.
However, due to local finances, technologies, and capabilities, it is still necessary to provide state support. Internationally adopted climate change mitigation and adaptation strategies are mainly oriented toward disaster adaptation, building environments, carbon absorption, transportation, urban form, urban public facilities/energy, water, the recycling industry, and mitigation and adjustment of financial means (Lu & Zhou, 2017).
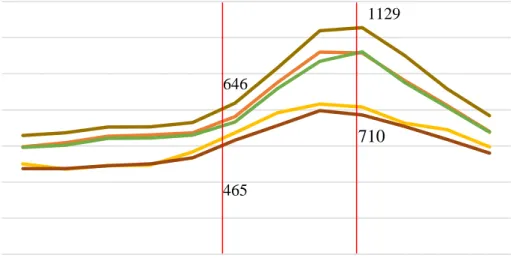
Based on spatial distribution, the average residential electricity consumption in each county in 2016 was observed, taking Taipei City, New Taipei City, Hsinchu City, Kaohsiung City, and Tainan City as examples. Figure 1 shows the cities in the northern regions (Taipei City, New Taipei City, and Hsinchu City) as compared with other counties. The cities exhibited a significant change in the range of power consumption (for example, Taipei City increased its average electricity consumption from 656 degrees in May to an average of 1129 degrees in August). In comparison, the magnitude of the change is not severe in Kaohsiung City, and Tainan City (for example, Tainan City grew from an average of 465 degrees in May to an average of 710 degrees in August). In summary, there was a consumption gap among the cities under observation.
The changes in consumption were different among cities, even if they were in same high-degree level of urban development.
Figure 1 Electricity Consumption Change in Each City in 2016
In recent years, economic research on the topic of energy has suggested that even the same variables have different marginal effects in different regions. For example, in the case of the climatic conditions, levels of socio-economic development, or usage habits of each city, the marginal effects of the residential electricity consumption factors in each city are not consistent over a short period of time (Garcia-Cerrutti, 2000;NREL, U.S., 2006; Hung, & Huang, 2015; Filippini, Hirl, & Masiero, 2018). In this view, as with urban planning and design, it is necessary to consider the local characteristics, and the concept of the proposed solution is similar. However, in the literature review, it was found that almost all of the papers discussed the impacts of overall urban development on the use of residential electricity. Based on this, in this paper, residential electricity use in urban areas is considered by integrating both of these research perspectives. The main purpose of this study is to model and analyze an electricity consumption model for each city. Based on the models, some advices related to energy policies are provided for local governments.
0 200 400 600 800 1000 1200 1400
Jan Feb Mar Apr May Jun Jul Aug Sep Oct Nov Dec
A v er ag e resid en tial E lectr icity C o n su m p tio n ( k W H/u ser )
Hsinchu City Kaohsiung New Taipei City Tainan Taipei
1129
710
646
465
2. Literature
The impact factor of residential electricity includes price, climate, economic considerations, architectural characteristics, demographic factors and urban form.
Residential electricity prices are often used as a variable in order to research the price elasticity and discuss energy price policies (Halvorsen, 1975; Cramer, et al., 1985;
Hung, & Huang, 2015). The residential electricity price in Mexico was the cheapest, and the price in Taiwan was next to Mexico in 2016 (IEA, 2016). In the residential sector, alternative energy of electricity includes liquefied petroleum gas and regenerated energy (such as solar power). In previous papers, there have been no consistent results suggesting which form the alternative energy of electricity is the substitute effect or the complementary effect (Hung, M.-F., & Huang, T.-H., 2015; Bernard, J.-T., Bolduc, D.,
& Yameogo, N.-D., 2011; Filippini, M., & Pachauri, S., 2004; Chang, Y.-H., 2013).
Temperature affects household' usage of home appliances, such as air-conditioning, heating, etc. In other words, temperature is a climate variable that affects household electricity use (Lam, 1998). Therefore, in the empirical analysis, the cooling degree- day (CDD) and the heat degree-day (HDD) have often been used as environmental variables to measure residential electricity consumption (Lam, 1998; Garcia-Cerrutti, 2000; Kavousian, et al., 2013; Bernard, et al., 2011; Guo, 2011).
Income is an important factor influencing residential power consumption. An elasticity analysis of household electricity consumption and price elasticity were used as the basis for the energy policy assessment. In addition, the resulting discussion can be subdivided into total household income (Zhou, & Teng, 2013; Silva, Soares, & Pinho, 2017; Jones, Fuertes, & Lomas, 2015; Kavousian, et al., 2013; Santamouris, et al., 2007; Schulte, &
Heindl, 2017; Bedir, et al., 2013; Cramer, et al., 1985; Guo, 2011), per household income (Halvorsen, 1975; Garcia-Cerrutti, 2000; Filippini, & Pachauri, 2004; Okajima,
& Okajima, 2013), disposable income, etc. (Jones, et al., 2015; Hung, & Huang, 2015;
Bernard, et al., 2011; Leahy, & Lyons, 2010). However, Garcia-Cerrutti (2000) indicated that household income per household is not statistically significant because household appliances are considered durable goods. Hence, households don’t have to add other similar types of home appliances (saturation level) as their income increases.
In case of housing area, in the past literature, most of the analytical results showed a positive and significant impact of the size of residential areas, where when the residential area was larger, the household electricity consumption was greater (Bedir, et
al., 2013; Yohanis, Mondol, Wright, & Norton, 2008; Kavousian, et al., 2013; Filippini,
& Pachauri, 2004; Santamouris, et al., 2007). The relationship between housing age and residential electricity consumption was impacted by earlier construction of residential
buildings when energy conservation norms were less stringent or when recent thermal insulation effects were better due to innovations in building materials. Therefore, the relationship between housing age and residential electricity consumption has been shown to be positive (Jones, et al., 2015; Silva, et al., 2017). In terms of building type, Bedir, et al. (2013) divided housing types into a terraced house, a top floor apartment, a ground floor apartment, and a semi-detached house. It was expected that there would be a significant difference in electricity consumption between the ground floor apartments and semi-detached houses in the Netherlands compared to townhouses. Due to less sunshine, the household had to use more lighting equipment and generate more electricity.
Yohanis, et al. (2008) surveyed 27 representative households in Northern Ireland. The results showed that as the members in the household increased, the residential consumption was greater. However, some of the analytical results did not indicate significant effects of number of residents in a household (Louw, Conradie, Howells, &
Dekenah, 2008; Liang, 2014), Louw, et al. (2008) indicated that the power consumption typically occured at the same time, such as dinner with family. Zhou, & Teng (2010) used the 2007-2009 China Urban Household Survey, in which the age of the head of the household was 50 years old, as a virtual variable. The analytical results were positive and reached a statistically significant level. Zhou, & Teng (2010) indicated that this was possible because the elderly tended to be at home for longer period of time than young adults. However, some studies have shown that the use of household appliances at all ages is similar. Therefore, age may not be a significant factor related to overall electricity use (Bedir, et al., 2013; Jones, et al., 2015; Chen, et al., 2017;
Liang, 2014).
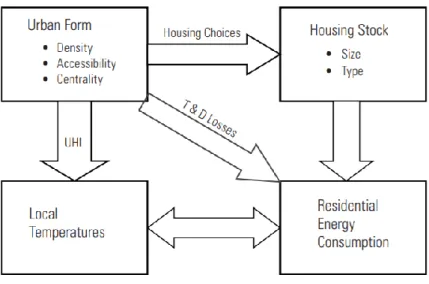
Ewing, & Rong (2008) proposed three impact paths depicting how urban form impacts residential electricity consumption, as shown in Figure 2. Urban form can directly and indirectly affect residential electricity consumption and influence the path of urban development strategies. There are different meanings attributed to these difference based on two urban planning perspectives of compact city and low carbon city. In the former, based on the centralized grid structure and the expansion of urban areas, the urbanization is considered to be highly centralized, which can reduce the additional energy consumption generated during the transmission of electricity, thereby achieving energy conservation. The latter advocates reducing residential energy consumption through energy conservation education, residential environment, and policy publicity.
Figure 2 Causal Paths between Urban Form and Residential Energy Consumption (Figure originated from: Ewing, & Rong, 2008)
From the perspective of urban planning, adjusting the architectural design, landscape, street network, density, an open space of urban designs should be considered. Ko (2013) suggested that density (such as residential density, and building density) reduce the negative feedback from the urban heat island effect, heat transfer, and improvements in the natural environment such as sunshine and wind direction.
Figure 3 Flowchart of how urban form variables impact the urban microclimate and residential space-conditioning energy use (Figure originated from: Ko, 2013) Lariviere & Lafrance (1999) indicated that when residential density is higher, the quantity of electricity used in the residential and business sector is less. Because urban sprawl is decreased by high density development, this results in reductions in extra concrete coverage and mitigates the urban heat island effect. Thus, high density
indirectly decreases in residential electricity consumption. However, Lee & Lee (2014) suggested that changes in density won’t significantly reduce the quantities of electricity consumption using a structural equation model. When urban development occurs in a high density city, the distance between buildings is naturally closer.
This street type acts like a canyon to generate air flow and cool down the temperature in urban areas. Moreover, the effect decreases indirectly the amount of electricity used.
In empirical research, Cheng, et al. (2017) calculated the aspect ratio using Arc GIS.
The results showed that urban canyon is significantly negative effect to decreasing residential electricity consumption. On overall, the elasticity is 0.13 in Tainan City.
Green spaces and parks are not only making living environments more comfortable, but they also adjust the urban micro-climate, cool down the temperature, and mitigate the urban heat island effect (Estoque, Murayama, & Myint, 2017). This indirectly leads to reductions in residential electricity consumption. In Taiwan, based on past empirical papers, parks and green spaces have been found to have significantly negative effects on the quantity of electricity used (Du, Y.-T., 2015). However, Liang (2014) showed that green spaces and parks didn’t significantly effect reduce electricity consumption.
Therefore, the results indicating whether green spaces and parks could prove to be good urban energy savings strategies have not been consistent.
3. Data description
The data base is in the form of panel data for which the spatial scale is 19 cities at the county level on a month time scale from 2012 to 2016. The dependent variable is the average monthly electricity consumption. The independent variables can be divided into several parts, including price, income, building characteristics, demographic factors, and urban form. Also, the data are calculated based on the government’s open data. The descriptive statistics are provided in Table 1. In addition, seasonal change are also considered and determined to be dummy variable (SUM) as a structural change in summer.
From June to October, the term is the summer in Taiwan. Thus, the months in summer are defined as 1, and otherwise as 0.
Table 1 Descriptive Statistics
Variable Description unit Mean Std. Data Resources
Q average monthly electricity
consumption kWh/user 634.66 156.99 Taiwan Power Company P Average monthly real
residential electricity price NT$/kWh 2.44 0.14 Bureau of Energy, Ministry of Economic Affairs
PG Average monthly actual
LPG price NT$/kg 26.25 5.38 Taiwan Zhongyou Co., Ltd.
PS Average monthly solar
power purchase price NT$/kWh 7.04 0.93 Taiwan Institute of Economic Research
CDD
Monthly sum of days in which outdoor temperature exceeds 23℃
day 17.62 13.00 Central Weather Bureau, Ministry of Communications Old
Average monthly number of elderly people per
household
people/
household 0.40 0.09 Ministry of Economic Affairs and Ministry of the Interior
WD
Monthly relative humidity is greater than 80% of the total number of days, multiplied by the
dehumidifier popularity rate
day 3.55 3.79 Central Weather Bureau, Ministry of Communications
I
Median monthly real income after tax per person per month
10 thousand
NT$ 5.01 0.50 Ministry of Finance BH
Average monthly percent of high-rises of 6 floors or more
% 0.21 0.15 Ministry of the Interior
HA Average monthly average
housing area m
2/household 42.39 6.64 Ministry of the Interior HP Average monthly household
population
people/
household 2.86 0.21 Ministry of Economic Affairs and Ministry of the Interior HY Average monthly average
housing age year 28.63 3.46 Ministry of the Interior Yng Average monthly population
per household
people/
household 0.44 0.06 Ministry of Economic Affairs and Ministry of the Interior
UP Per capita park green area m
2/person 4.33 3.32
Department of Household Registration, Ministry of the Interior and Department of Statistics, Ministry of the Interior
U Percentage of residential
metropolitan area % 0.72 0.19 Ministry of the Interior HS
The percentage of the family members under 3 people
% 0.56 0.05 Ministry of the Interior
4. Model specification and econometric approaches
The model is based on pooled mean group model (Pesaran, et al., 1999). Since the residential power markets in counties and cities in Taiwan are affected by the electricity price policies set by The Taiwan Power Company and the central government’s energy policies, it is assumed that the policies remained unchanged during the study period.
The long-term model can be expressed as:
𝑄
𝑖,𝑡
= Σ𝑐=1 𝑛
𝜃𝑐
𝑥𝑐,𝑖,𝑡
+ 𝑢𝑖,𝑡
𝑖 = 1,2, … ,19 , 𝑡 = 1,2, … ,60 (4.1) where 𝑥𝑐,𝑖,𝑡
is the independent variable, for example, CDD, income, housing area etc.𝑄
𝑖,𝑡
is the dependent variable. 𝑢𝑖,𝑡
is error term.Based on the data, it is difficult to change electricity consumption habits in a short period of time. The difference in electricity consumption between the previous and the last months was not significant, and electricity consumption was only affected by regional differences. In addition, due to the difference in the level of urban development among cities, the coefficient of residential electricity use was not consistent, so the short-term model is expressed as follows:
𝑄
𝑖,𝑡
= 𝜆𝑖
𝑄𝑖,𝑡−1
+ Σ𝑗=0 𝑙=1
𝛿𝑐,𝑖,𝑗
𝑥𝑐,𝑖,𝑡−𝑗
+ 𝛾𝑖
+ 𝑠𝑢𝑚𝑖
+ 𝑢𝑖,𝑡
(4.2) 𝑖 = 1,2, … ,19 , 𝑡 = 1,2, … ,60 where 𝜆𝑖
is the relationship between the residential electricity consumption in the previous period and the electricity consumption in the current period, implying the influence of electricity habits. l is the number of backward periods. 𝛿𝑐,𝑖,𝑗
is the current period (j=0), where in the previous period (j=1), the residential electricity consumption factor has a marginal effect on residential electricity consumption. 𝛾𝑖
is constant for each city. 𝑠𝑢𝑚𝑖
is the change quantities of electricity for each city in summer.Finally, after combining (3.1) and (3.2), the short-term impact model of residential electricity consumption in each county is expressed as follows:
Δ𝑄
𝑖,𝑡
= 𝜙𝑖
(𝑄𝑖,𝑡−1
− Σ𝑐=1 𝑛
𝜃𝑐
𝑥𝑐,𝑖,𝑡−1
) + Σ𝑐=1 𝑛
𝛿𝑐,𝑖
Δ𝑥𝑐,𝑖,𝑡
+ 𝛾𝑖
+ 𝑠𝑢𝑚𝑖
+ 𝑢𝑖,𝑡
∴ Δ𝑄
𝑖,𝑡
= 𝜙𝑖
𝜉(𝜃) + Σ𝑐=1 𝑛
𝛿𝑐,𝑖
Δ𝑥𝑐,𝑖,𝑡
+ 𝛾𝑖
+ 𝑠𝑢𝑚𝑖
+ 𝑢𝑖,𝑡
(4.3) 𝑢𝑖,𝑡
~𝑁(0, 𝜎𝑢 2
) 𝑖. 𝑖. 𝑑. , 𝑖 = 1,2, … ,19 , 𝑡 = 1,2, … ,60 where 𝜙𝑖
is an adjustment coefficient that represents the long-term effect of residential electricity consumption for each city, and 𝜙𝑖
< 0. 𝜉(𝜃) is a long-term error correction function. 𝛿𝑐,𝑖
is the cth variable of the ith county, which explain the marginal effect on short-term changes.5. Empirical Results and Discussion
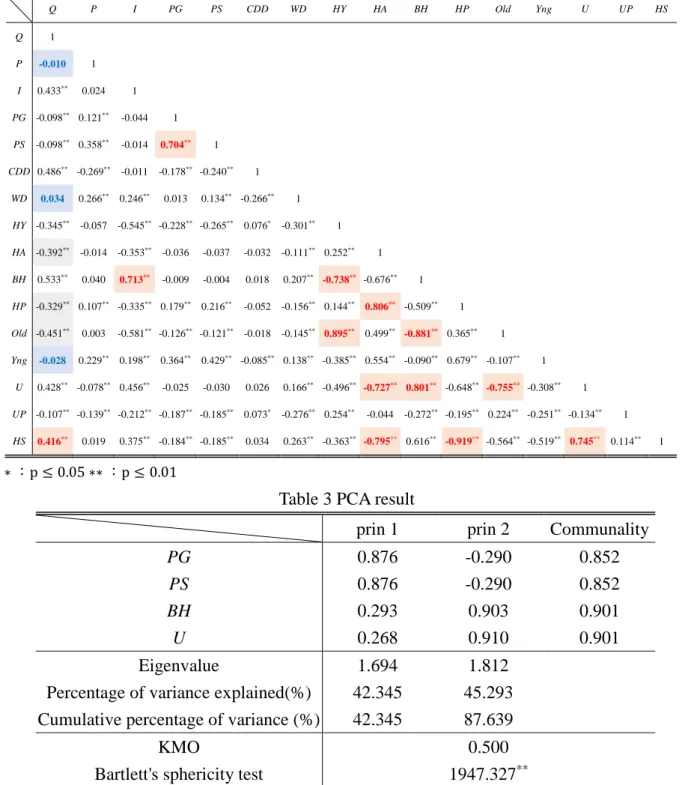
As shown in Table 2, residential electricity price and quantities of electricity have no significant correlation because the price has been controlled by the central government and The Taiwan Power Company. The sum of days dehumidifiers were used and the number of young people per household also show no significant correlation with quantities of electricity. Therefore, these variables were not adopted in the model.
In addition, it was found that the variables including housing area, household population, and the number of elderly people per household did not match the economic theory because the trend of the household population is decreasing, which allows the house area to become smaller so that these trends in electricity demand increase are different.
The scale under consideration is the county scale. This is an aggregative behavior study.
Therefore, the percentage of the family members under three people in the city (HS) was adopted to represent the housing area and household population. The number of elderly people per household is affected by the population structure because in highly developed cities, this is fewer than in areas that are less developed. Therefore, this didn’t match the theory. Based on the housing demand over supply, new buildings are still being built. This result in housing in high development areas being newer than in less developed. On the other hand, housing age was found to be positively correlated with quantities of electricity because of the necessity of being comfortable (Leahy & Lyons, 2010). Thus, housing age was still adopted in the model.
Based on Table 2, actual LPG price and the solar power purchase price were found to be highly related. The percent of residential metropolitan area and percent of high-rise buildings were also found to be highly related. Principle component analysis (PCA) was used in this paper to obtain two new variables, one of which was called as the alternative price (PA) which was combined with the actual LPG price and the solar power purchase price. The other variable was labeled as urban scale (US) which was combined with the percent of residential metropolitan area and the percent of high-rise buildings.
Table 2 Correlation Coefficient Table
Q P I PG PS CDD WD HY HA BH HP Old Yng U UP HS
Q 1
P -0.010 1
I 0.433
**0.024 1
PG -0.098
**0.121
**-0.044 1
PS -0.098
**0.358
**-0.014 0.704
**1
CDD 0.486
**-0.269
**-0.011 -0.178
**-0.240
**1
WD 0.034 0.266
**0.246
**0.013 0.134
**-0.266
**1
HY -0.345
**-0.057 -0.545
**-0.228
**-0.265
**0.076
*-0.301
**1
HA -0.392
**-0.014 -0.353
**-0.036 -0.037 -0.032 -0.111
**0.252
**1
BH 0.533
**0.040 0.713
**-0.009 -0.004 0.018 0.207
**-0.738
**-0.676
**1
HP -0.329
**0.107
**-0.335
**0.179
**0.216
**-0.052 -0.156
**0.144
**0.806
**-0.509
**1
Old -0.451
**0.003 -0.581
**-0.126
**-0.121
**-0.018 -0.145
**0.895
**0.499
**-0.881
**0.365
**1
Yng -0.028 0.229
**0.198
**0.364
**0.429
**-0.085
**0.138
**-0.385
**0.554
**-0.090
**0.679
**-0.107
**1
U 0.428
**-0.078
**0.456
**-0.025 -0.030 0.026 0.166
**-0.496
**-0.727
**0.801
**-0.648
**-0.755
**-0.308
**1
UP -0.107
**-0.139
**-0.212
**-0.187
**-0.185
**0.073
*-0.276
**0.254
**-0.044 -0.272
**-0.195
**0.224
**-0.251
**-0.134
**1
HS 0.416
**0.019 0.375
**-0.184
**-0.185
**0.034 0.263
**-0.363
**-0.795
**0.616
**-0.919
**-0.564
**-0.519
**0.745
**0.114
**1
∗ :p ≤ 0.05 ∗∗ :p ≤ 0.01
Table 3 PCA result
prin 1 prin 2 Communality
PG
0.876 -0.290 0.852PS
0.876 -0.290 0.852BH
0.293 0.903 0.901U
0.268 0.910 0.901Eigenvalue 1.694 1.812
Percentage of variance explained(%) 42.345 45.293 Cumulative percentage of variance (%) 42.345 87.639
KMO 0.500
Bartlett's sphericity test 1947.327
**
∗∗ :𝜒 2 ≤ 0.01
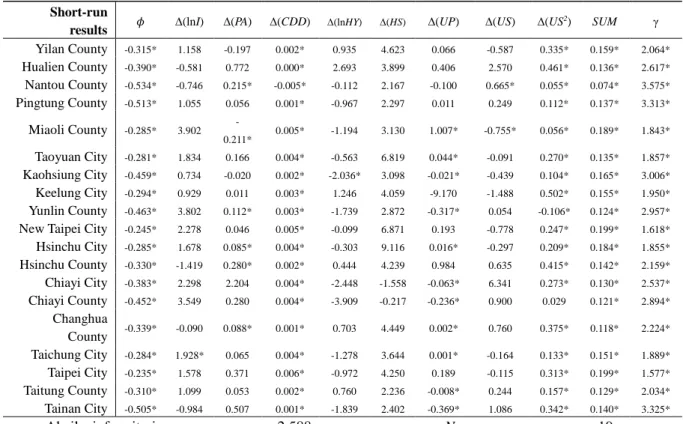
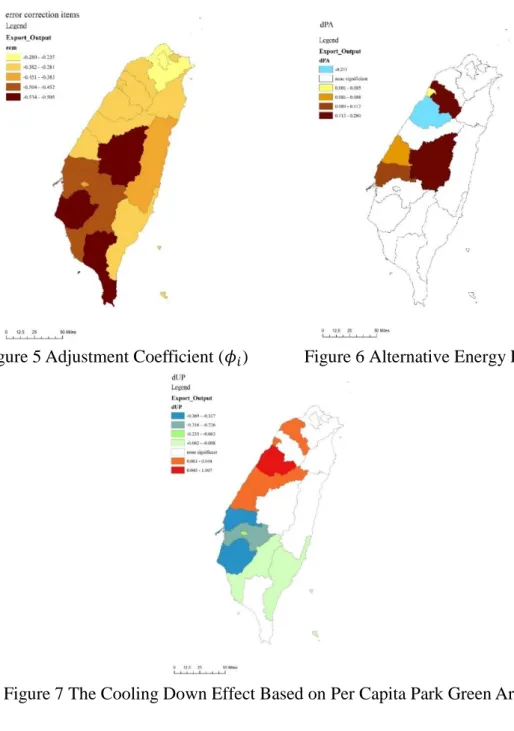
The results of the model are shown in Table 4, and some of the variables are mapped in the Appendix. First, it can be found that the adjustment coefficients (𝜙) in all cities were negative in the short-run, indicating that the long-term consistent effects of residential electricity use in Taiwan's cities are a result of central government policies. The adjustment process from short-run to long-run would take between 2 and 4 years (the darker color implies that adjustment speed of the city is slower in Figure 4). It was found that the constant for each city is a spatial difference for residential electricity activity.
The adjustment coefficients for each city are similar to the constants for each city. This shows that the changes in urban activity in terms of residential electricity consumption affected the different adjusted speed in each city. Also, the changes in structure in summer (SUM) all had positive effects, and the changes in all cities are different among others. These results are consistent with the historical data shown in Figure 1.
In the model, CDD in the model was found to have significantly positive effect in most cities, which is in line with the findings of previous studies. CDD in Nantou County exhibited a significantly negative effect because it is located in the middle of Taiwan, and the average temperature is lower than that in the other cities. This implies that over use of the air-conditioners may lead to cooling more than is needed (Garcia-Cerrutti, 2000).
Table 4 PMG model results
Short-run
results 𝜙 ∆(lnI) ∆(PA) ∆(CDD) ∆(lnHY) ∆(HS) ∆(UP) ∆(US) ∆(US
2
) SUM γ
Yilan County -0.315* 1.158 -0.197 0.002* 0.935 4.623 0.066 -0.587 0.335* 0.159* 2.064*
Hualien County -0.390* -0.581 0.772 0.000* 2.693 3.899 0.406 2.570 0.461* 0.136* 2.617*
Nantou County -0.534* -0.746 0.215* -0.005* -0.112 2.167 -0.100 0.665* 0.055* 0.074* 3.575*
Pingtung County -0.513* 1.055 0.056 0.001* -0.967 2.297 0.011 0.249 0.112* 0.137* 3.313*
Miaoli County -0.285* 3.902 -
0.211* 0.005* -1.194 3.130 1.007* -0.755* 0.056* 0.189* 1.843*
Taoyuan City -0.281* 1.834 0.166 0.004* -0.563 6.819 0.044* -0.091 0.270* 0.135* 1.857*
Kaohsiung City -0.459* 0.734 -0.020 0.002* -2.036* 3.098 -0.021* -0.439 0.104* 0.165* 3.006*
Keelung City -0.294* 0.929 0.011 0.003* 1.246 4.059 -9.170 -1.488 0.502* 0.155* 1.950*
Yunlin County -0.463* 3.802 0.112* 0.003* -1.739 2.872 -0.317* 0.054 -0.106* 0.124* 2.957*
New Taipei City -0.245* 2.278 0.046 0.005* -0.099 6.871 0.193 -0.778 0.247* 0.199* 1.618*
Hsinchu City -0.285* 1.678 0.085* 0.004* -0.303 9.116 0.016* -0.297 0.209* 0.184* 1.855*
Hsinchu County -0.330* -1.419 0.280* 0.002* 0.444 4.239 0.984 0.635 0.415* 0.142* 2.159*
Chiayi City -0.383* 2.298 2.204 0.004* -2.448 -1.558 -0.063* 6.341 0.273* 0.130* 2.537*
Chiayi County -0.452* 3.549 0.280 0.004* -3.909 -0.217 -0.236* 0.900 0.029 0.121* 2.894*
Changhua
County -0.339* -0.090 0.088* 0.001* 0.703 4.449 0.002* 0.760 0.375* 0.118* 2.224*
Taichung City -0.284* 1.928* 0.065 0.004* -1.278 3.644 0.001* -0.164 0.133* 0.151* 1.889*
Taipei City -0.235* 1.578 0.371 0.006* -0.972 4.250 0.189 -0.115 0.313* 0.199* 1.577*
Taitung County -0.310* 1.099 0.053 0.002* 0.760 2.236 -0.008* 0.244 0.157* 0.129* 2.034*
Tainan City -0.505* -0.984 0.507 0.001* -1.839 2.402 -0.369* 1.086 0.342* 0.140* 3.325*
Akaike info criterion -2.588 N 19
Schwarz criterion -1.629 T 60
Hannan-Quinn critter -2.226 n 1121
∗ :𝑝 ≤ 0.01
Alternative forms of energy in Nantou County, Yunlin County, Hsinchu City, Hsinchu County and Changhua County (the brown cities in Figure 5) showed significant substitution effect. As a result, alternative energy policies should still be promoted in these cities. In addition, the complements effect was significant in Miaoli County (the blue city in Figure 5). However, policies aren’t useful in most cities because the residential electricity price has been too cheap until recently. Housing age in Kaohsiung City had a significantly negative effect. This negative effect implied that appliance usage is more frequent and that appliance types are more varied so buildings have more wiring (Leahy & Lyons, 2010). Therefore, Kaohsiung City could enact new regulations for architectural designs to improve the energy consumption in the residential sector.
Per capita park green areas in Kaohsiung City, Yunlin County, Chiayi City, Chiayi County, Taitung County and Tainan City (the blue cities in Figure 6) had a significantly negative effect. This implies that green space areas are adequate to achieve the goal of reducing electricity use. For example, they can decrease temperatures and reduce the use of air conditioners. However, it was found that most of cities were unable to achieve the goal of decreased energy demand through the use of green spaces. There are two possible reasons for this finding. One is that there is too much artificial cover to maintain a cooling function. The other is that in high development urban areas, determining and appropriate number and sizes of parks or green spaces is difficult to adjust the urban heat island effect. This has resulted in the size or design of the green spaces or parks failing to achieve a cooling function.
Urban scale in most of the cities exhibited a nonlinear relation. Thus, urban scale in most of the cities had significantly positive effects, which the exception of Yunlin County and Chiayi County. These results indicate that urban scale exists at an scale of economic. Additionally, when cities are less developed, the urban scale is more
significant. This implies that highly developed cities have difficulty with changing the urban scale because urbanization is so high, so the effect is marginal as compared to what occurs at a low level of development. Also, if the urban scale is too large, this results in using more electricity. On the other hand, compact city in Chiayi County wouldn’t be useful for reducing residential electricity use. In addition, Yunlin County is a low-level city for urban development so a more compact design would increase energy use.
Income and housing scale were found to be insignificant in all of the cities. Appliances are durable goods and the time range of this paper was too short to reflect any impact because during the study period, there was no need to buy appliances (Garcia-Cerrutti, 2000). The data base was short-term panel data, so the housing scale didn’t reveal any significant effects.
6. Conclusion
Taiwan's green energy policy is actively promoted by the government. However, the government is mainly concerned with the supply side of the side. In the case of discussion of the demand side, government policies have been less carefully considered.
Therefore, this article discusses energy policy from the demand side. It was found that changes in residential electricity consumption in each county were different during the study period. This study is based on differences in urban environments, where a review was made of the research on the energy economy and the study of urban spaces, and where the open data platform from Taiwan’s government was collected and organized as the model that formed the basis of this paper.
In this paper, a residential electricity consumption model was constructed for each city in Taiwan. There were some findings that can provide advice related to government energy policies. One is that alternative energy can be promoted
in Nantou County, Yunlin County, Hsinchu City, Hsinchu County and Changhua County. In the other cities under considerations, the residential electricity price is so cheap that the households don’t need to use alternative energy to reduce electricity costs. Hence, it would be useful for the central government and The Taiwan Power Company to deregulate prices or to reflect the actual cost of energy in the price. In addition, the local government can encourage households to use regenerated energy and for the local governments to fund solar equipment.Another issue of concern is the designs of parks and green spaces. In past research, green spaces and parks were believed to mitigate urban heat island effects. However, if there is too much artificial cover or the size allocated for parks and green spaces is too small, their function related to cooling down the temperature in urban areas is decreased.
Hence, it was found that the green spaces and parks do not significantly negative effect in most of the cities under model. Planners must consider better way to plan and design to maximize ecological spaces based on the conditions of each city and attempts should be made to decrease the use of artificial cover.
Limitations
There are some limitations in this paper. One is that the spatial data is at the county level.
Limited by open data, it is difficult to prove that household consumption at the
individual scale reflects reality. Another is that this is a short-term study that was limited
by open data, where this paper main discussed the policy adjustments in the short-term.
Appendix
Figure 5 Adjustment Coefficient (𝜙
𝑖
) Figure 6 Alternative Energy PriceFigure 7 The Cooling Down Effect Based on Per Capita Park Green Areas
References
Bedir, M., Hasselaar, E., & Itard, L. (2013). Determinants of electricity consumption in Dutch dwellings. Energy and buildings, 58, 194-207.
Bernard, J.-T., Bolduc, D., & Yameogo, N.-D. (2011). A pseudo-panel data model of household electricity demand. Resource and Energy Economics, 33(1), 315- 325.
Brounen, D., Kok, N., & Quigley, J. M. (2012). Residential energy use and conservation:
Economics and demographics. European Economic Review, 56(5), 931-945.
Chang, Y.-H. (2013). The Estimation of Residential Electricity Demand in Taiwan:
Seasonality and Dynamic Panel Data Analysis. (Unpublished master’s
thesis). Institute of Industrial Economics, Tam-kang University, New Taipei City, Taiwan. [in Chinese].Chen, Y.-J., Matsuoka, R. H., & Liang, T.-M. (2017). Urban form, building characteristics, and residential electricity consumption: A case study in Tainan City. Environment and Planning B: Urban Analytics and City Science, 1-20.
Cramer, J. C., Miller, N., Craig, P., Hackett, B. M., Dietz, T. M., Vine, E. L., Levine, M. D., Kowalczyk, D. J. (1985). Social and engineering determinants and their equity implications in residential electricity use. Energy, 10(12), 1283- 1291.
Du, Y.-T. (2015). Relationship among urban Density, Open Space, and Residential
Electricity Consumption. (Unpublished master’s thesis). Department of
Urban Planning, Cheng-kung University, Tainan City, Taiwan. [in Chinese].Estoque, R. C., Murayama, Y., & Myint, S. W. (2017). Effects of landscape composition and pattern on land surface temperature: An urban heat island study in the megacities of Southeast Asia. Science of the Total Environment,
577, 349-359.
Ewing, R., & Rong, F. (2008). The impact of urban form on US residential energy use.
Housing policy debate, 19(1), 1-30.
Filippini, M., Hirl, B., & Masiero, G. (2018). Habits and rational behaviour in residential electricity demand. Resource and Energy Economics, 52, 137-152.
Garcia-Cerrutti, L. M. (2000). Estimating elasticities of residential energy demand from panel county data using dynamic random variables models with heteroskedastic and correlated error terms. Resource and Energy Economics,
22(4), 355-366.
Guo, Z., Zhou, K., Zhang, C., Lu, X., Chen, W., & Yang, S. (2018). Residential electricity consumption behavior: Influencing factors, related theories and intervention strategies. Renewable and Sustainable Energy Reviews, 81, 399- 412.
Halvorsen, R. (1975). Residential demand for electric energy. The review of Economics
and Statistics, 12-18.
Hung, M.-F., & Huang, T.-H. (2015). Dynamic demand for residential electricity in Taiwan under seasonality and increasing-block pricing. Energy Economics,
48, 168-177.
IPCC. (2014). The Fifth Assessment Report. Switzerland, Intergovernmental Panel on Climate Change, IPCC.
Jones, R. V., Fuertes, A., & Lomas, K. J. (2015). The socio-economic, dwelling and appliance related factors affecting electricity consumption in domestic buildings. Renewable and Sustainable Energy Reviews, 43, 901-917.
Kavousian, A., Rajagopal, R., & Fischer, M. (2013). Determinants of residential electricity consumption: Using smart meter data to examine the effect of climate, building characteristics, appliance stock, and occupants' behavior.
Energy, 55, 184-194.
Ko, Y. (2013). Urban form and residential energy use: A review of design principles and research findings. Journal of planning literature, 28(4), 327-351.
Lam, J. C. (1998). Climatic and economic influences on residential electricity consumption. Energy Conversion and Management, 39(7), 623-629.
Leahy, E., & Lyons, S. (2010). Energy use and appliance ownership in Ireland. Energy
Policy, 38(8), 4265-4279.
Lee, S., & Lee, B. (2014). The influence of urban form on GHG emissions in the US household sector. Energy Policy, 68, 534-549.
Liang, T.-M. (2014). Study on the Relationship between Land Use and Residential
Energy Consumption: Case Study in Former Provincial Tainan City.
(Unpublished master’s thesis). Department of Urban Planning, Cheng-kung University, Tainan City, Taiwan. [in Chinese].
Liang, Z.-M., (2014), Study on the Relationship between Land Use and Residential
Energy Consumption: Case Study in Former Provincial Tainan City,
(Doctoral master's thesis, department of urban planning, Tainan, Taiwan).Retrieved from: http://etds.lib.ncku.edu.tw/etdservice/view_metadata?etd un=U00262708201406222700
Louw, K., Conradie, B., Howells, M., & Dekenah, M. (2008). Determinants of electricity demand for newly electrified low-income African households.
Energy Policy, 36(8), 2812-2818.
Lu, J.-C. & Zhou, S.-Q., (2017), Taiwan's Urban Climate Change Policy and Action:
Analysis of Taipei and Kaohsiung Metropolitan Areas, In Xiao, X.-H., Zhou, S.-Q., Huang, S.-L. (Eds),Urban Climate Issues and Governance in Taiwan, Taipei, Taiwan: National Taiwan University Press. [in Chinese].
Okajima, S., & Okajima, H. (2013). Estimation of Japanese price elasticities of residential electricity demand, 1990–2007. Energy Economics, 40, 433-440.
Pesaran, M. H., Shin, Y., & Smith, R. P. (1999). Pooled mean group estimation of dynamic heterogeneous panels. Journal of the American Statistical
Association, 94(446), 621-634.
Silva, S., Soares, I., & Pinho, C. (2017). Electricity demand response to price changes:
The Portuguese case taking into account income differences. Energy
Economics, 65, 335-342.
U.S. Department of Energy Office of Energy Efficiency and Renewable Energy, National Renewable Energy Laboratory (2006). Regional differences in the
price-elasticity of demand for energy (NREL Publication No. SR-620-
39512). [Abstract]. Retrieved from https://www.nrel.gov/docs/fy06osti/39512.pdf.
United Nations (UN). 2014. World Urbanization prospects: The 2014 Revision. UN, New York.
Yohanis, Y. G., Mondol, J. D., Wright, A., & Norton, B. (2008). Real-life energy use in the UK: How occupancy and dwelling characteristics affect domestic electricity use. Energy and buildings, 40(6), 1053-1059.
Zhou, S., & Teng, F. (2013). Estimation of urban residential electricity demand in China using household survey data. Energy Policy, 61, 394-402.
Contact email: [email protected]
108年度專題研究計畫成果彙整表
計畫主持人:陳彥仲 計畫編號:108-2410-H-006-091- 計畫名稱:從都市之區域地理條件及家戶活動探討住宅能耗之時空比較分析
成果項目 量化 單位
質化
(說明:各成果項目請附佐證資料或細 項說明,如期刊名稱、年份、卷期、起 訖頁數、證號...等)
國
內 學術性論文
期刊論文 0
研討會論文 0 篇
專書 0 本
專書論文 0 章
技術報告 0 篇
其他 0 篇
國
外 學術性論文
期刊論文 0
研討會論文 1 篇
Lu, Po-Hao, & Chen, Y. J.*
(2019.01). Modeling Residential Electricity Consumption and Energy Policy Analysis. The IAFOR
International Conference on Sustainability, Energy & the Environment, Hawaii, USA.
專書 0 本
專書論文 0 章
技術報告 0 篇
其他 0 篇
參 與 計 畫 人 力
本國籍
大專生 0
人次
碩士生 3 黃守平、黃敏則、管彥婷等三員。
博士生 0
博士級研究人員 0
專任人員 0
非本國籍
大專生 0
碩士生 0
博士生 0
博士級研究人員 0
專任人員 0
其他成果
(無法以量化表達之成果如辦理學術活動
、獲得獎項、重要國際合作、研究成果國 際影響力及其他協助產業技術發展之具體 效益事項等,請以文字敘述填列。)