國立臺灣大學電機資訊學院資訊工程學系 碩士論文
Department of Computer Science and Information Engineering College of Electrical Engineering and Computer Science
National Taiwan University Master Thesis
深度增強人群計數
DECCNet: Depth Enhanced Crowd Counting
楊碩碉
Shuo-Diao Yang
指導教授:徐宏民博士 Advisor: Winston Hsu, Ph.D.
中華民國 108 年 7 月
July, 2019
摘要
人群計數是一項用來計算在圖片中出現總人數的技術,這是一個經典且 相當關鍵的問題,也被廣泛使用在不同的應用當中。目前的方法大多使用圖 片的 RGB 值來預測,同時也達到不錯的效果。然而,當前的方法在預測擁 擠區域時會受到不完整或是模糊的邊界影響。因此在論文中,我們提出了一 個深度增強人群計數網路,這個網路使用了我們所提出的一項新技術,雙向 跨型態專注機制,來融合深度的資訊。使用深度的資訊,可以讓我們的方法 根據深度的值來專注在處理相對擁擠的區域。我們所提出的雙向跨型態專注 機制,會藉由各自學習含有較多資訊量的區域,來交互式的融合不同的輸入 型態。在我們的實驗中,我們的方法在目前最大且最難的資料集中打敗了目 前最佳的模型。視覺化的結果說明了使用深度的資訊可以精準的預測擁擠的 區域。最後,在敏感度分析中也證明了我們提出的每個元件都對最終的結果 有正面的影響。
關鍵字: 人群計數,跨型態融合
Abstract
Crowd counting which aims to calculate the number of total instances on an image is a classic but crucial task that supports many applications. Most of the prior works are based on the RGB channels on the images and achieve satisfied performance. However, previous approaches suffer from counting highly congested region due to the incomplete and blurry shapes. In this pa- per, we present an effective crowd counting method, Depth Enhanced Crowd Counting Network (DECCNet), which leverages the estimated depth infor- mation with our novel Bidirectional Cross-modal Attention (BCA) mecha- nism. Utilizing the depth information enables our model to explicitly learn to pay attention to those congested regions on the basis of the depth informa- tion. Our BCA mechanism interactively fuses two different input modalities by learning to focus on the informative parts according to each other. In our experiments, we demonstrate that DECCNet outperforms the state-of-the-art on the two largest crowd counting datasets available, including UCF-QNRF, which has the highest crowd density. The visualized result shows that our method can accurately regress dense regions through leveraging depth infor- mation. Ablation studies also indicate that each component of our method is beneficial to final prediction.
Keywords: Crowd counting, Cross-modal fusion
Contents
摘要 iii
Abstract iv
1 Introduction 1
2 Related work 4
2.1 Crowd counting . . . 4
2.2 Single image depth estimation . . . 5
3 Method 6 3.1 Motivation . . . 6
3.2 Depth estimation . . . 6
3.3 Network architecture . . . 8
3.3.1 Cross-modal encoder . . . 8
3.3.2 Density map decoder . . . 9
3.4 Loss functions . . . 11
3.4.1 Euclidean loss . . . 11
3.4.2 SSIM loss . . . 12
4 Experiments 13 4.1 Datasets . . . 13
4.2 Implementation details . . . 15
4.3 Results . . . 19
4.4 Ablation studies . . . 19 4.5 Visualization . . . 20
5 Conclusion 21
Bibliography 22
List of Figures
1.1 Design intuition . . . 2
3.1 Overall architecture . . . 7
3.2 Encoder of DECCNet . . . 7
4.1 Visualization . . . 15
4.2 Failure cases . . . 16
4.3 Comparison versus state-of-the-art . . . 17
4.4 Attention map of the proposed novel BCA component . . . 18
List of Tables
3.1 Detailed network architecture . . . 10
4.1 Performance comparison between DECCNet and other methods . . . 14
4.2 Performance comparison (UCF-QNRF) . . . 14
4.3 Ablation studies . . . 14
Chapter 1 Introduction
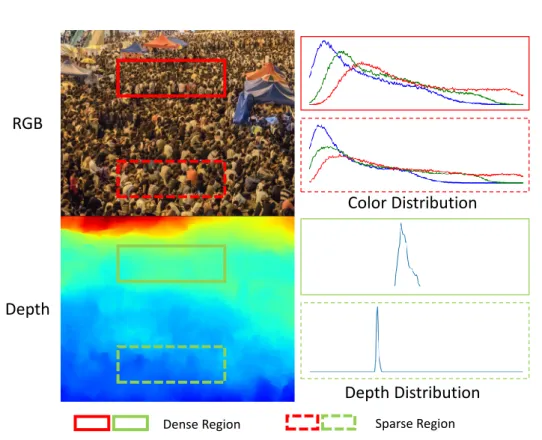
Crowd counting has attracted the researchers, thanks to the massive growth of the var- ious types of unmanned cameras. Many applications such as traffic control, election rally or video surveillance are built upon the accurate crowd counting. Recent methods [2, 4, 8, 19, 23, 28, 31, 34, 36] estimate the count with RGB channels on the image by generating density map without explicitly detect accurate position then taking integration of whole predicted density map and achieve promising results. These methods most lever- age CNN architecture due to its excellent feature representation learning compared with hand-crafted features. However, these approaches suffer from highly congested regions due to severe occlusion, perspective distortion and non-uniform crowd distribution where the RGB channels of pixels are too small to offer the informative representation to the crowd counting networks, demonstrated in figure 1.1. Furthermore, we find that those regions are often deeper among the whole image, resulting in the count of pixels of each head is smaller than other, which is hard to estimate than those close-to-camera heads.
To tackle this, we introduce an effective Depth Enhanced Crowd Counting Network (DECCNet), which leverages the RGB channels with our estimated depth information that has been widely used and improves many tasks such as object detection [33], image segmentation [14] and 3D scene reconstruction [15]. Figure 1.1 explains the intuition of our method. Since an image may contain several crowds that distance of each crowd to camera differs, scale variation of people hurts the performance. Furthermore, information which RGB channel offers has insufficient capability to represent such difference. But
Depth RGB
Color Distribution
Depth Distribution
Dense Region Sparse Region
Figure 1.1: This figure explains the design intuition of our method. The left column is RGB image and its corresponding depth channel. The right column is the distribution of each bounding box. It can be observed that deep regions tend to have denser crowds.
In RGB image, the color distribution of the solid box (dense region) and the dashed box (sparse region) are roughly the same, while in the depth image, their corresponding depth value is quite different, providing extra information compared to RGB and can be lever- aged as prior to the network.
in the depth space, distance of each pixel from the camera can be leveraged to alleviate such problems, as demonstrated in figure 1.1. To fuse two input modalities, we also pro- pose a novel bidirectional cross-modal attention (BCA) which attends the color and depth modalities according to another, on the basis of the observation that despite the depth is additionally informative, the depth and the RGB channels provide the signal to each other to encourage the model to pay attention to the desirable regions (figure 4.4).
The experiments on various benchmarks demonstrate that our DECCNet surpasses the state-of-the-art models. The qualitative results demonstrate that our proposed approach accurately estimates the far and blurry regions where previous state-of-the-art methods suffer from (figure 4.1, 4.2 and 4.3). Our ablation study also shows the significance of BCA by comparing different fusing methods and our method performs better than directly concatenating depth as the fourth channel for input RGB image or without BCA.
To summarize, our main contributions of this paper are as follows:
• In addition to RGB data, we argue the importance of depth information based on the observation in figure 1.1. To the best of our knowledge, we are the first to discover the advantage of incorporating depth channel to crowd counting. Recent works use only RGB as input and tend to fail in highly congested regions due to scale variation.
• We proposed an effective attention mechanism called BCA (bidirectional cross- modal attention) to progressively fuse two different input modalities and shows that BCA can correctly focus on deep/dense regions.
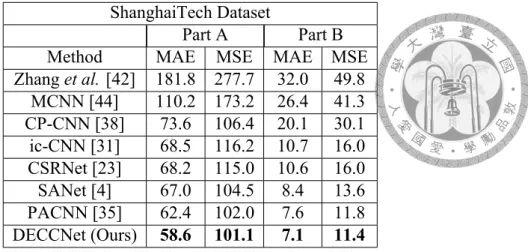
• In ShanghaiTech dataset, we reach MAE of 58.6 in part A and MAE of 7.1 in part B, and MAE of 107.9 in UCF-QNRF dataset which outperforms the state-of-the-art crowd counting methods.
Chapter 2
Related work
There is a large number of methods proposed in recent years aimed at crowd counting and single image depth estimation. In this section, we discuss each task respectively.
2.1 Crowd counting
Crowd counting methods can be mainly divided into three categories: detection-based, regression-based and density estimation-based method. Detection-based methods such as [9, 11, 25] use head or body-part detectors to localize each person’s position. However such methods often fail on dense scenes due to severe occlusion and low resolution of each person. To tackle this problem, regression-based methods such as [5, 6] learn the mapping from image feature to the number of people in a patch-based fashion. This kind of methods consists of two steps, image feature extraction and regression from the ex- tracted features. Although regression-based methods perform better than detection-based methods, outputting only a number of people lacks spatial information.
More recent works such as [4, 19, 23, 35] are density estimation-based methods that leverage the power of CNN, due to its great feature representation learning capability, to generate density map. [44] propose a multi-column CNN with various receptive-field size to aggregate different scale of people/head. [32] proposes a switch CNN that consists of a switcher and many independent regressors, each of them has different receptive fields.
[38] introduces a contextual pyramid CNN which leverages global and local context of
crowd image. [23] use VGG backbone and dilated kernel to enlarge the receptive field of convolution, resulting in performance gain in congested regions. [34] generates den- sity maps by leveraging adversarial training, compared to only using L2 loss, resulting in a sharper prediction. [19] proposed a novel loss of combining count, density map es- timation and localization in addition to only MSE loss. [4] propose a novel SSIM [41]
loss to emphasize local patch consistency, and use an efficient Inception-like [39] net- work that has only about 1M parameters. [35] propose a perspective-aware network that simultaneously estimates density maps and perspective maps resulting in state-of-the-art performance. However, previous methods suffer from estimation for those high-density regions due to scale variation of the crowd, which can be enhanced by leveraging our proposed depth information.
2.2 Single image depth estimation
There are lots of works [10, 22, 26, 27] proposed to predict depth from a single RGB image.
And some datasets such as NYU [30] or KITTI [12] are generated by RGB-D sensor or laser. Furthermore, MegaDepth [24] is a large dataset whose images are collected from the Internet, containing about 130K images. [10] presents a method that first generates a coarse global prediction then refines the predicting locally. [26] formulates single image depth prediction into a conditional random field learning problem, combined with deep CNN. [22] proposes a novel end-to-end method that leverages residual [16] architecture and can run in real time.
For this work, as estimating depth is not our main focus, we do not directly esti- mate depth from the RGB image. Instead, we use a state-of-the-art pretrained model, MegaDepth [24], to extract depth information from the RGB image. Further end-to-end methods can be further investigated.
Chapter 3 Method
In this section, we will discuss our proposed DECCNet (figure 3.2) in detail. Section 3.1 presents the motivation, followed by depth estimation in section 3.2, the network design in section 3.3 and the loss function in section 3.4.
3.1 Motivation
The bottleneck of the crowd counting task where previous methods suffer from is to ac- curately estimate the count on certain regions where the instances are dense, small and overlapping. Moreover, these instances can dominate the count due to the high density.
We observe that the regions where previous approaches can hardly estimate are usually far away from the viewpoint, and argue to fill this gap by encouraging the model to pay attention to the faraway regions. Our framework leverages the encoder-decoder architec- ture with following novelties: 1) combining depth channel along with RGB as the input of the model and 2) bidirectional cross-modal attention mechanism that effectively fuses two input modalities.
3.2 Depth estimation
Since available crowd counting datasets have only RGB images, generating depth infor- mation turns out to be a critical task. We decide to directly use MegaDepth[24] as a depth
RGB Image
Decoder
Σ
Estimated Depth
Density Map Count
Encoder Decoder
BCA
BCA Bidirectional Cross-modal Attention SA Self-Attention DUC Dense Upsampling Convolution
SA DUC
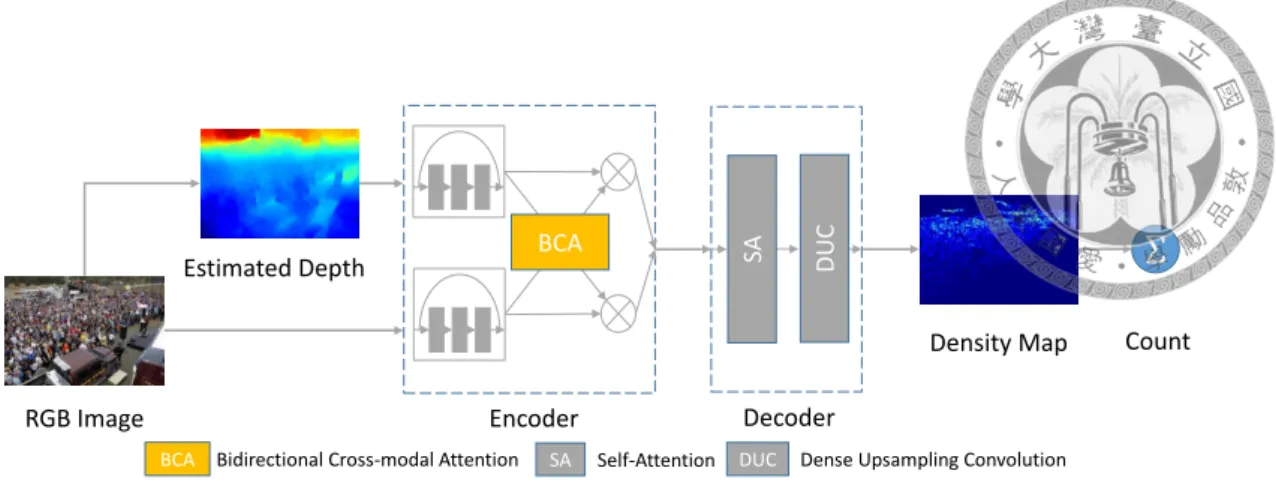
Figure 3.1: Overall architecture of the proposed method. In addition to the RGB image, we also use the estimated depth as an input to our model. Our proposed component, BCA (bidirectional cross-modal attention), which attends the color and depth modalities according to another (details in section 3.3), is applied to two-stream Resnet encoder, while decoder is composed of a self-attention layer followed by DUC layers. The final count is calculated by taking integration of the predicted density map.
Element-wise multiplication
Sigmoid
Figure 3.2: Encoder of DECCNet: Encoder uses the first 3 ResBlocks of ResNet-50 as the main backbone, coupled with proposed bidirectional cross-modal attention mechanism (BCA). Detail of BCA can be found in section 3.3. Two input streams interactively attend to each other after each ResBlock, scaling feature map for each modality. With BCA, two input modalities are progressively fused from the low level feature to high level represen- tations. Overall architecture can be found at table 3.1.
extraction model. MegaDepth is a state-of-the-art single image depth estimation model trained on more than 100K examples, including indoor and outdoor scenes, which show better prediction on crowd counting datasets whose images are usually outdoor scenes, than other models.
3.3 Network architecture
Inspired by [17], convolutional encoder-decoder architecture has shown great success in various works [3, 7]. Our proposed network consists of a front-end cross-modal encoder to encode two different input modalities and a back-end density map decoder to progressively generate estimated density map. Encoder is a two-stream ResNet [16] coupled with a novel attention mechanism, bidirectional cross-modal attention (BCA), to fuse RGB and depth inputs. Decoder uses self-attention mechanism [43] to catch long-range dependency followed by Dense Upsampling Convolution (DUC) [40] to generate the high resolution density map. Each component is discussed in the following section.
3.3.1 Cross-modal encoder
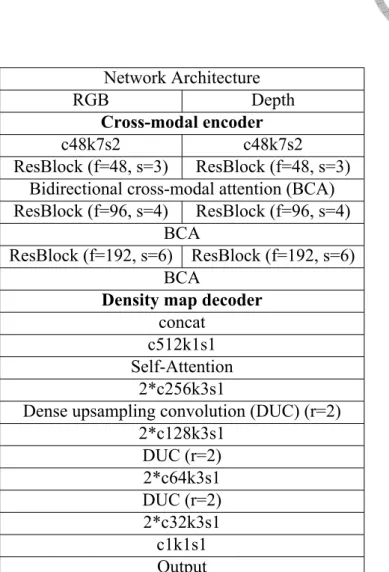
As shown in figure 3.2, we use the first 3 block of Resnet-50 as the main backbone due to Resnet’s powerful feature representation. We remove the fourth block of Resnet and fully connected layer since model should accept arbitrary input size and the fourth block will downsample feature map to 1/16 of the original input size which is too small for later upsampling. Instead of directly concatenating RGB and depth channel as input or lately fusing extracted feature of each input modalities, we introduce a novel Bidirectional Cross- modal Attention (BCA) mechanism to interactively affect one stream by the other.
Suppose there are two stream, RGB stream and depth stream, output of each ResBlock is denoted as:
R{rgb,d}i , i ={1, 2, 3}. (3.1)
Then Bidirectional Cross-modal Attention is defined as:
R′rgbi = Rrgbi ⊗ Sigmoid(Conv(Rdi)), (3.2)
Ri′d= Rdi ⊗ Sigmoid(Conv(Rirgb)). (3.3)
⊗ denotes element-wise multiplication with broadcasting and Conv is 1 × 1 convolution that reduces the number of channels to one to generate an attention map. Then R′rgb,di is used as input to next ResBlock or decoder that extracts higher level representations or generate density map.
There are two attention directions, one is depth to RGB, and the other is RGB to depth.
Depth to RGB, shown in equation 3.2, scales the RGB feature map by depth stream, mak- ing RGB stream focus on deep regions. On the other hand, RGB to depth, shown in equation 3.3, use RGB information to enhance depth stream since depth information our model used is an estimation, not an accurate one.
This BCA mechanism is repeated three times for each output of ResBlock, progres- sively fusing two input modalities from low level feature map to high level representations (see figure 4.4). Final outputs of each stream are concatenated and then send to decoder.
Table 4.3 shows the effectiveness of BCA. Besides its performance, BCA uses only 1× 1 convolution to produce a one-channel attention map for each stream, slightly increasing trainable parameters by about 2.7K of the whole network, but significantly reduces the error (table 4.3), indicating that this attention mechanism is also an efficient one.
3.3.2 Density map decoder
Density map decoder is composed of a standard 1x1 convolution to reduce the channel sent from the encoder and self-attention mechanism [43] followed by Dense Upsampling Convolution [40]. These components are commonly used in other areas but also boost the performance of our work.
Self-attention mechanism is firstly used on Generative Adversarial Network, which
Network Architecture
RGB Depth
Cross-modal encoder
c48k7s2 c48k7s2
ResBlock (f=48, s=3) ResBlock (f=48, s=3) Bidirectional cross-modal attention (BCA) ResBlock (f=96, s=4) ResBlock (f=96, s=4)
BCA
ResBlock (f=192, s=6) ResBlock (f=192, s=6) BCA
Density map decoder concat
c512k1s1 Self-Attention
2*c256k3s1
Dense upsampling convolution (DUC) (r=2) 2*c128k3s1
DUC (r=2) 2*c64k3s1 DUC (r=2) 2*c32k3s1
c1k1s1 Output
Table 3.1: Detailed network architecture of DECCNet. 2*c256k3s1 denotes convolution operation with 256 output channels, kernel size of 3× 3, strides 1, repeated 2 times. Res- Block (f=48, s=3) means a standard ResBlock with 48 initial filter, block size of 3. DUC (r=2) means exchanging feature map of 1× 1 × 4 for 2 × 2 × 1. Details of BCA can be found at figure 3.2 and section 3.3.
fails to capture geometric or structural patterns [43]. Instead of standard convolution op- eration only processing information of local neighborhood, self-attention mechanism at- tends on each pixel guided by global context. By incorporating self-attention mechanism in our crowd counting network, decoder can deal with the long-range dependency which crowd regions on images often present.
Since the size of the feature map sent from the encoder is only 1/8 of the original image, directly upsampling to original size using bilinear method leads to blurry density maps. Hence, choosing an appropriate upsampling method is important, considering the quality of the predicted density map. Dense Upsampling Convolution [40], also known as pixel shuffler or sub-pixel convolution, upsample the feature map by reassigning each 1∗ 1 ∗ r2feature map subregion to r∗ r ∗ 1, without any parameterized operation. Since DUC exchanges channel for space, two convolutional layers are applied after each DUC operation to increase the channel for later DUC layers. Experiments show that DUC can generate high quality density map as shown in figure 4.1.
3.4 Loss functions
Our model leverages two loss functions, euclidean loss and SSIM loss. The former focuses on pixel-wise similarity while the latter emphasizes patch consistency.
3.4.1 Euclidean loss
Instead of estimating a single number of people of the given image, our method regresses each pixel of density map whose size is the same as the input. Thus, Euclidean loss is chosen to force the estimated density map as close as ground truth as possible. Euclidean loss compares the difference between two images, defined as:
LE = 1 N
∑N i=1
∥Pi− GTi∥2, (3.4)
supposed there are N pixels in a given image where Pi is the prediction of our model and GTiis ground truth density map.
3.4.2 SSIM loss
SSIM [41] is firstly used to measure the structural similarity of images. [4] uses SSIM as loss function to train network and achieves promising result. Compared with Euclidean loss, which encourages only the similarity of each, not a group of pixels. SSIM loss con- siders the local patch consistency by applying a sliding window on the given image, com- puting each region’s SSIM respectively. Following [4], we use a 11x11 Gaussian kernel with a standard deviation of 1.5 to compute local statistics. SSIM of a given point is defined as:
SSIM = (2µpµgt+ c1)(2σp,gt+ c2)
(µ2p+ µ2gt+ c1)(σp2+ σ2gt+ c2) (3.5) where µp and µgt are mean and σp and σgt are standard deviation of prediction map and ground truth density map, σp,gtdenotes the covariance, c1 and c2are small value to avoid division by zero.
Aggregating each pixel of prediction, SSIM loss is defined as:
LSSIM = 1− 1 N
∑SSIM (x), (3.6)
where x is the position of the map.
Final loss is calculated by fusing these two loss functions:
L = LE+ λLSSIM, (3.7)
where λ is used to balance two loss functions. In this paper we set λ to 1e− 3.
Chapter 4 Experiments
In this section, we first discuss the datasets used to evaluate our method in section 4.1, implementation details in section 4.2, followed by main result in section 4.3. Ablation studies and visualization are discussed in section 4.4 and section 4.5 respectively.
4.1 Datasets
There are several crowd counting datasets, ranging from sparse to dense crowds. We ex- periment our method on two largest and well-annotated crowd counting datasets: Shang- haiTech and UCF-QNRF.
ShanghaiTech [44]: It contains 1198 images in RGB or greyscale with 330,165 anno- tations on the center of each head, divided into two parts A and B. Part A has 482 images, 300 for training and 182 for testing. Part B has 716 images, 400 for training and 316 for testing. The main differences between part A and B is that part A is collected from Inter- net whose average count of people is 501 while part B is collected from busy streets of metropolitan areas in Shanghai, China, which has an average count of 123.
UCF-QNRF [19]: This is the largest and the newest real-world crowd counting dataset.
Collected from the Internet, this dataset contains highly congested crowd image with higher resolution (2013 × 2092 on average), denser crowds (815 people per image on average) and finer annotations. Training set consists of 1201 images while testing set has 334 images.
ShanghaiTech Dataset
Part A Part B
Method MAE MSE MAE MSE
Zhang et al. [42] 181.8 277.7 32.0 49.8 MCNN [44] 110.2 173.2 26.4 41.3 CP-CNN [38] 73.6 106.4 20.1 30.1 ic-CNN [31] 68.5 116.2 10.7 16.0 CSRNet [23] 68.2 115.0 10.6 16.0 SANet [4] 67.0 104.5 8.4 13.6 PACNN [35] 62.4 102.0 7.6 11.8 DECCNet (Ours) 58.6 101.1 7.1 11.4
Table 4.1: The performance comparison between DECCNet and other methods evaluated on both parts of ShanghaiTech dataset. Average count of people in part A is higher than part B. Lower MAE/MSE represents better performance. Our method outperforms all previous methods by a large margin.
UCF-QNRF Dataset
Method MAE MSE
Idrees [18] 315.0 508.0 MCNN [44] 277.0 426.0 Switch-CNN [32] 228.0 445.0 CMTL [37] 252.0 514.0 CL [19] 132.0 191.0 DECCNet (Ours) 107.9 179.0
Table 4.2: This table shows the performance comparison between our method and the state-of-the-arts evaluated on UCF-QNRF dataset, which is the most challengeable one.
Our DECCNet reaches MAE of 107.9 which is 18% lower than previous methods.
Ablation Studies
Part A Part B
Method MAE MSE MAE MSE
DECCNet 58.6 101.1 7.1 11.4 RGB-D fused 63.9 106.3 8.7 14.8 w/o depth 60.8 102.9 9.3 15.1 w/o BCA 62.4 104.6 9.1 14.1 w/o self-attn 62.0 102.2 8.3 13.9 w/o DUC 58.9 101.9 8.7 14.6
Table 4.3: Ablation studies conducted on ShanghaiTech dataset. RGB-D fused denotes directly using depth information as 4th channel of RGB image, which results in a one stream network. This table shows the significance of each component of our network.
Dropping any of them leads to performance decrease.
GT=1111 Pred=1146
GT=717 Pred=714
GT=153 Pred=153
GT=1171 Pred=1146 RGB
Depth
GT
Pred
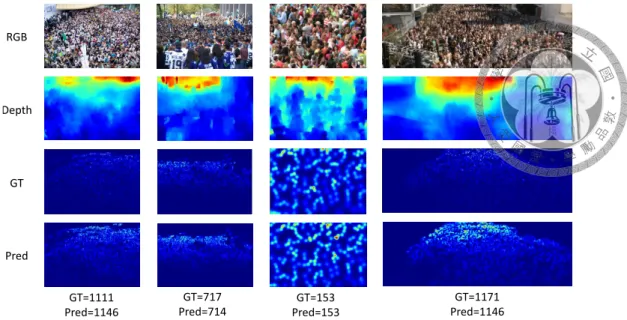
Figure 4.1: Visualization of predicted density map and final count of our method. First row is the original RGB image, second row is depth generated from pretrained model, third row is ground truth density map and fourth row is our model’s prediction. It’s obvious that with the help of depth information, those congested regions can be accurately estimated.
4.2 Implementation details
First, we need to generate ground truth density map as training target. Since annotations in the aforementioned datasets have only coordinate of each person, We can generate a binary map as:
Hi,j =
1 if (i, j) is annotated 0 else
(4.1)
Then convolve H with geometric-adaptive Gaussian kernel [44] or fixed Gaussian kernel.
Part A of ShanghaiTech is generated by applying geometric-adaptive Gaussian kernel and others are generated by a fixed kernel.
Since images’ sizes are different, for those images bigger than 1024× 768, we resize their height to 768, then randomly crop a patch of 256× 256 during training. To prevent overfitting, each example is horizontally flipped with probability 0.5 and converted to grey scale with probability 0.1 if the original image is RGB to simulate the presence of grey scale images. Batch normalization [20] and Relu [29] are applied after each convolution layer. Our network is trained from scratch without any pretrained weight. Weights on ResBlocks are initialized with Xavier [13] initialization and the rest are initialized with
RGB
Depth
GT
Pred
GT=1326 Pred=784
GT=1175 Pred=1610
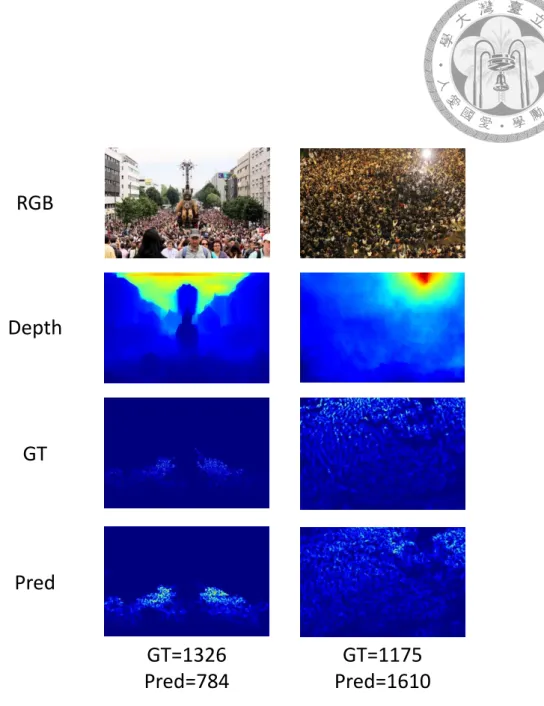
Figure 4.2: Failure cases. First row is the original RGB image, second row is depth gen- erated from pretrained model, third row is ground truth density map and fourth row is our model’s prediction. Depth prediction of these images is noisy and inaccurate. Our method depends on two input, RGB and depth. If one is incomplete or erroneous, performance will degrade.
GT=1111 CSRNet=1232
Ours=1146
GT=1326 CSRNet=743
Ours=784 RGB
GT
CSRNet
Ours
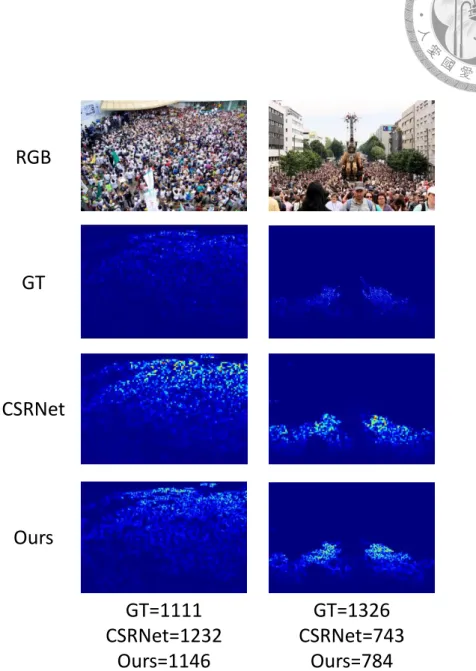
Figure 4.3: Comparison versus state-of-the-art. First row is the original image, second row is ground truth density map, third row is the prediction of CSRNet and fourth row is our prediction. In highly congested regions, our DECCNet generates more accurate crowd distribution and final count.
Image
Depth Attention
Image Attention
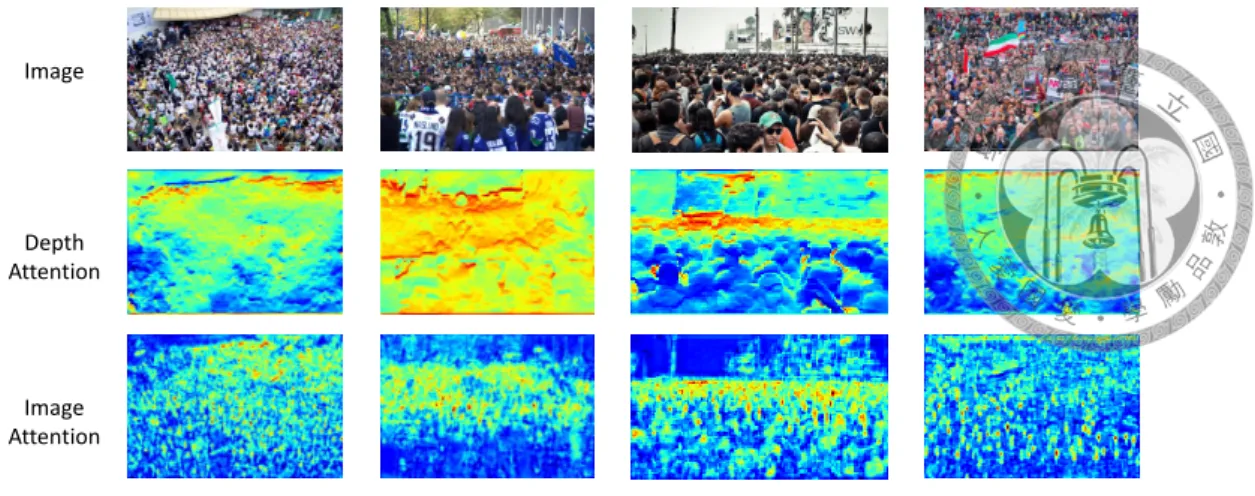
Figure 4.4: Attention map of the proposed novel BCA component. The first row is the original image, the second row is the attention map of depth stream after third ResBlock, and the third row is the attention map of RGB stream after third ResBlock. We can see that in the second row, the proposed BCA component can attend on those deep regions, while the third row demonstrates the information flow from RGB to depth stream, guiding it to attend on high density regions.
Gaussian distribution using zero mean and 0.01 standard deviation. Adam [21] optimizer is used because it shows faster convergence on this task, learning rate is set to 1e− 4 with 1e− 7 weight decay and batch size is set to 16. All of the experiments are implemented by TensorFlow [1] framework.
To evaluate performance, previous works [4, 19, 23, 28] use MAE (Mean Absolute Error) and MSE (Mean Square Error) as evaluation metrics, defined as follows:
M AE = 1 M
∑M i=1
|P redi− Cnti| (4.2)
M SE = vu ut 1
M
∑M i=1
|P redi− Cnti|2 (4.3)
where M is total images, P rediis prediction count integrated from predicted density map and Cntiis ground truth count.
Different from [4, 23, 34], which use the patch-based testing scheme. We empirically find out that directly input the whole image during testing to our network resulting in better performance.
4.3 Results
Table 4.1 shows the result of our method versus the state-of-the-art evaluated on Shang- haiTech dataset. Our DECCNet (last row) achieves the lowest MAE of 58.6 in harder part A with higher density and significantly outperforms the state-of-the-art, with 6% better, indicating our proposed method, as mentioned in section 3.3, can deal with high density regions. In part B with a relatively lower density of crowds, our approach also reaches a new state-of-the-art result, with 7% better. Figure 4.1 and figure 4.2 present the density estimation examples of part A of ShanghaiTech.
Table 4.2 compares the result of DECCNet versus several methods evaluated on UCF- QNRF dataset, which is the largest and the newest dataset available, and the most chal- lengeable one. In this dataset our method achieves the lowest MAE of 107.9, outperform- ing other methods by a large margin.
4.4 Ablation studies
To verify the effectiveness of each component of our architecture, we conduct ablation studies on both part of ShanghaiTech dataset, containing four different setting: 1) remove depth information from input, resulting in a one stream Resnet encoder, where decoder remains the same, 2) remove BCA, so that two streams cannot affect each other in middle layers, 3) remove self-attention, which is used to catch long-range dependency and 4) remove DUC, where bilinear upsampling is used instead.
As shown in table 4.3, dropping each component of our network leads to performance decrease. For example, directly combining depth as the fourth channel leads to a signifi- cant performance drop, possibly due to the distribution difference between two modalities (figure 1.1). And if BCA component is removed from the encoder, MAE/MSE of both part of ShanghaiTech dataset also increases, indicating the importance of designing a proper fusing method.
4.5 Visualization
In addition to quantitative result, we also present qualitative result on figure 4.1, 4.2, 4.3 and 4.4. Figure 4.1 shows the results that are most accurate among ShanghaiTech dataset.
Congested regions on those images are far away from the camera, which are deep as well.
Furthermore, depth prediction of these images are roughly correct, which is beneficial to the model.
Figure 4.2 shows the failure cases of our method. Although the appearances on the predicted density map are roughly the same as ground truth, final counts are still inac- curate. Specifically, extracted depth information of those images is incomplete or noisy, leading to performance degradation. In other words, our method quite depends on the quality of the depth channel.
Figure 4.3 shows the comparison versus state-of-the-art. CSRNet [23] tends to fail on those congested regions while our method produces finer estimation.
Figure 4.4 presents the effectiveness of BCA component. Since BCA is a bidirectional attention mechanism and takes place in each of three ResBlocks, we decide to visualize the attention map of each stream after third ResBlock, where high level feature map contains more semantic and global meaning of input. Designing intention of this component is to interactively enhance RGB stream by depth stream, and vice versa. Depth attention, as shown in the second column of figure 4.4, successfully attends on hard cases, most of which are deep and congested. RGB attention, shown in the third column, guides the other stream to focus on high density region to a certain degree.
Chapter 5 Conclusion
In this paper, we introduce a novel depth enhanced crowd counting network to accurately estimate crowd density of the given image, especially highly congested regions. Lever- aging depth information along with RGB data provides an extra capability for our model to pay attention to deep regions. We demonstrate our method with state-of-the-art and reach the best performance. Experiments show the necessity of BCA and the depth chan- nel. Since depth information we used is an estimation, if accurate depth is available, our performance can be further improved.
Bibliography
[1] M. Abadi, A. Agarwal, P. Barham, E. Brevdo, Z. Chen, C. Citro, G. S. Corrado, A. Davis, J. Dean, M. Devin, S. Ghemawat, I. Goodfellow, A. Harp, G. Irving, M. Is- ard, Y. Jia, R. Jozefowicz, L. Kaiser, M. Kudlur, J. Levenberg, D. Mané, R. Monga, S. Moore, D. Murray, C. Olah, M. Schuster, J. Shlens, B. Steiner, I. Sutskever, K. Talwar, P. Tucker, V. Vanhoucke, V. Vasudevan, F. Viégas, O. Vinyals, P. War- den, M. Wattenberg, M. Wicke, Y. Yu, and X. Zheng. TensorFlow: Large-scale machine learning on heterogeneous systems, 2015. Software available from tensor- flow.org.
[2] D. Babu Sam, N. N. Sajjan, R. Venkatesh Babu, and M. Srinivasan. Divide and grow: capturing huge diversity in crowd images with incrementally growing cnn. In Proceedings of the IEEE Conference on Computer Vision and Pattern Recognition, pages 3618–3626, 2018.
[3] V. Badrinarayanan, A. Kendall, and R. Cipolla. Segnet: A deep convolutional encoder-decoder architecture for image segmentation. IEEE transactions on pattern analysis and machine intelligence, 39(12):2481–2495, 2017.
[4] X. Cao, Z. Wang, Y. Zhao, and F. Su. Scale aggregation network for accurate and efficient crowd counting. In Proceedings of the European Conference on Computer Vision (ECCV), pages 734–750, 2018.
[5] A. B. Chan and N. Vasconcelos. Bayesian poisson regression for crowd counting. In 2009 IEEE 12th international conference on computer vision, pages 545–551. IEEE, 2009.
[6] K. Chen, C. C. Loy, S. Gong, and T. Xiang. Feature mining for localised crowd counting. In BMVC, volume 1, page 3, 2012.
[7] L.-C. Chen, Y. Zhu, G. Papandreou, F. Schroff, and H. Adam. Encoder-decoder with atrous separable convolution for semantic image segmentation. In Proceedings of the European Conference on Computer Vision (ECCV), pages 801–818, 2018.
[8] D. Deb and J. Ventura. An aggregated multicolumn dilated convolution network for perspective-free counting. In Proceedings of the IEEE Conference on Computer Vision and Pattern Recognition Workshops, pages 195–204, 2018.
[9] P. Dollar, C. Wojek, B. Schiele, and P. Perona. Pedestrian detection: An evaluation of the state of the art. IEEE transactions on pattern analysis and machine intelli- gence, 34(4):743–761, 2012.
[10] D. Eigen, C. Puhrsch, and R. Fergus. Depth map prediction from a single image using a multi-scale deep network. In Advances in neural information processing systems, pages 2366–2374, 2014.
[11] W. Ge and R. T. Collins. Marked point processes for crowd counting. In 2009 IEEE Conference on Computer Vision and Pattern Recognition, pages 2913–2920. IEEE, 2009.
[12] A. Geiger, P. Lenz, and R. Urtasun. Are we ready for autonomous driving? the kitti vision benchmark suite. In Conference on Computer Vision and Pattern Recognition (CVPR), 2012.
[13] X. Glorot and Y. Bengio. Understanding the difficulty of training deep feedforward neural networks. In Proceedings of the thirteenth international conference on arti- ficial intelligence and statistics, pages 249–256, 2010.
[14] S. Gupta, R. Girshick, P. Arbeláez, and J. Malik. Learning rich features from rgb-d images for object detection and segmentation. In European Conference on Computer Vision, pages 345–360. Springer, 2014.
[15] A. Handa, T. Whelan, J. McDonald, and A. J. Davison. A benchmark for rgb-d visual odometry, 3d reconstruction and slam. In 2014 IEEE international conference on Robotics and automation (ICRA), pages 1524–1531. IEEE, 2014.
[16] K. He, X. Zhang, S. Ren, and J. Sun. Deep residual learning for image recognition.
In Proceedings of the IEEE conference on computer vision and pattern recognition, pages 770–778, 2016.
[17] G. E. Hinton and R. R. Salakhutdinov. Reducing the dimensionality of data with neural networks. science, 313(5786):504–507, 2006.
[18] H. Idrees, I. Saleemi, C. Seibert, and M. Shah. Multi-source multi-scale counting in extremely dense crowd images. In Proceedings of the IEEE conference on computer vision and pattern recognition, pages 2547–2554, 2013.
[19] H. Idrees, M. Tayyab, K. Athrey, D. Zhang, S. Al-Maadeed, N. Rajpoot, and M. Shah. Composition loss for counting, density map estimation and localization in dense crowds. In Proceedings of the European Conference on Computer Vision (ECCV), pages 532–546, 2018.
[20] S. Ioffe and C. Szegedy. Batch normalization: Accelerating deep network training by reducing internal covariate shift. arXiv preprint arXiv:1502.03167, 2015.
[21] D. P. Kingma and J. Ba. Adam: A method for stochastic optimization. arXiv preprint arXiv:1412.6980, 2014.
[22] I. Laina, C. Rupprecht, V. Belagiannis, F. Tombari, and N. Navab. Deeper depth prediction with fully convolutional residual networks. In 2016 Fourth International Conference on 3D Vision (3DV), pages 239–248. IEEE, 2016.
[23] Y. Li, X. Zhang, and D. Chen. Csrnet: Dilated convolutional neural networks for understanding the highly congested scenes. In Proceedings of the IEEE conference on computer vision and pattern recognition, pages 1091–1100, 2018.
[24] Z. Li and N. Snavely. Megadepth: Learning single-view depth prediction from in- ternet photos. In Computer Vision and Pattern Recognition (CVPR), 2018.
[25] Z. Lin and L. S. Davis. Shape-based human detection and segmentation via hierar- chical part-template matching. IEEE Transactions on Pattern Analysis and Machine Intelligence, 32(4):604–618, 2010.
[26] F. Liu, C. Shen, and G. Lin. Deep convolutional neural fields for depth estimation from a single image. In Proceedings of the IEEE Conference on Computer Vision and Pattern Recognition, pages 5162–5170, 2015.
[27] F. Liu, C. Shen, G. Lin, and I. Reid. Learning depth from single monocular images using deep convolutional neural fields. IEEE transactions on pattern analysis and machine intelligence, 38(10):2024–2039, 2016.
[28] X. Liu, J. van de Weijer, and A. D. Bagdanov. Leveraging unlabeled data for crowd counting by learning to rank. In Proceedings of the IEEE Conference on Computer Vision and Pattern Recognition, pages 7661–7669, 2018.
[29] V. Nair and G. E. Hinton. Rectified linear units improve restricted boltzmann ma- chines. In Proceedings of the 27th international conference on machine learning (ICML-10), pages 807–814, 2010.
[30] P. K. Nathan Silberman, Derek Hoiem and R. Fergus. Indoor segmentation and support inference from rgbd images. In ECCV, 2012.
[31] V. Ranjan, H. Le, and M. Hoai. Iterative crowd counting. In Proceedings of the European Conference on Computer Vision (ECCV), pages 270–285, 2018.
[32] D. B. Sam, S. Surya, and R. V. Babu. Switching convolutional neural network for crowd counting. In 2017 IEEE Conference on Computer Vision and Pattern Recog- nition (CVPR), pages 4031–4039. IEEE, 2017.
[33] M. Schwarz, A. Milan, A. S. Periyasamy, and S. Behnke. Rgb-d object detection and semantic segmentation for autonomous manipulation in clutter. The International Journal of Robotics Research, 37(4-5):437–451, 2018.
[34] Z. Shen, Y. Xu, B. Ni, M. Wang, J. Hu, and X. Yang. Crowd counting via adversarial cross-scale consistency pursuit. In Proceedings of the IEEE conference on computer vision and pattern recognition, pages 5245–5254, 2018.
[35] M. Shi, Z. Yang, C. Xu, and Q. Chen. Revisiting Perspective Information for Effi- cient Crowd Counting. arXiv e-prints, page arXiv:1807.01989, Jul 2018.
[36] Z. Shi, L. Zhang, Y. Liu, X. Cao, Y. Ye, M.-M. Cheng, and G. Zheng. Crowd count- ing with deep negative correlation learning. In Proceedings of the IEEE conference on computer vision and pattern recognition, pages 5382–5390, 2018.
[37] V. A. Sindagi and V. M. Patel. Cnn-based cascaded multi-task learning of high-level prior and density estimation for crowd counting. In 2017 14th IEEE International Conference on Advanced Video and Signal Based Surveillance (AVSS), pages 1–6.
IEEE, 2017.
[38] V. A. Sindagi and V. M. Patel. Generating high-quality crowd density maps using contextual pyramid cnns. In Proceedings of the IEEE International Conference on Computer Vision, pages 1861–1870, 2017.
[39] C. Szegedy, V. Vanhoucke, S. Ioffe, J. Shlens, and Z. Wojna. Rethinking the in- ception architecture for computer vision. In Proceedings of the IEEE conference on computer vision and pattern recognition, pages 2818–2826, 2016.
[40] P. Wang, P. Chen, Y. Yuan, D. Liu, Z. Huang, X. Hou, and G. Cottrell. Under- standing convolution for semantic segmentation. In 2018 IEEE Winter Conference on Applications of Computer Vision (WACV), pages 1451–1460. IEEE, 2018.
[41] Z. Wang, A. C. Bovik, H. R. Sheikh, E. P. Simoncelli, et al. Image quality as- sessment: from error visibility to structural similarity. IEEE transactions on image processing, 13(4):600–612, 2004.
[42] C. Zhang, H. Li, X. Wang, and X. Yang. Cross-scene crowd counting via deep convolutional neural networks. In Proceedings of the IEEE conference on computer vision and pattern recognition, pages 833–841, 2015.
[43] H. Zhang, I. Goodfellow, D. Metaxas, and A. Odena. Self-attention generative ad- versarial networks. arXiv preprint arXiv:1805.08318, 2018.
[44] Y. Zhang, D. Zhou, S. Chen, S. Gao, and Y. Ma. Single-image crowd counting via multi-column convolutional neural network. In Proceedings of the IEEE conference on computer vision and pattern recognition, pages 589–597, 2016.