A Classification Tree Approach for Identifying Potentially Delisting Firms from the Corporate Governance Perspective – Evidence from Taiwan
Yuh-Jiuan Parng Chung-Jen Fu Hsi-Cheng Li*
I. INTRODUCTION
Seeking early warning signs of potentially delisting firms is crucial to financial professionals and public investors. Generally speaking, delisting firms can be categorized into several groups: merger, acquisition, migration to another exchange, bankruptcy, and liquidation (Shumway and Warther, 1999). Among these, the last two categories belong to involuntary delisting and are of the most research and practical interest. In a recent study by Dahiya and Klapper (2007), findings indicate that, between 1994 and 2003, the United States had the highest average annual involuntary delisting rate of 6.78%, followed by 5.65% in the United Kingdom, 4.57% in France, 3.45% in Australia, 3.39% in Canada, 2.85% in Germany, and 1.05% in Japan. Ferris et al. (2007) investigate involuntary delisting firms in the Asia-Pacific region from 1980 through 1999. The involuntary delisting rate is 17.4% in Thailand, 10% in Malaysia, 9.7% in Taiwan, 7.8% in Singapore, 7.3% in Indonesia, 5.5% in South Korea, 5.2% in Hong Kong, and 2.4% in Japan.
Numerous financial scandals over the past ten years, such as the events involving WorldCom, Adelphia, Tyco, and Enron, have caused immeasurable losses to investors. As a result, several important regulatory changes regarding corporate governance, including the Sarbanes-Oxley Act of 2002, NYSE 2003, AMEX 2003, NASDAQ 2003, and NYSE 2004, have come into being. For identifying potentially delisting firms, the competent functioning of outside directors and independent supervisors on a board of directors (BOD) has been considered as a critical indicator of corporate governance practice (Uzun et al., 2004).
* Yuh-Jiuan Parng and Chung-Jen Fu are both at National Yunlin University of Science and Technology.
Hsi-Cheng Li is at Bryant University.
Turning the spot light to the Taiwan Stock Exchange (TSE), where the stock market survived the 1997-98 Asian financial crisis, actions have also been taken to ensure the integrity of the securities market. Agencies involved in these actions include the Financial Supervisory Commission (FSC), the Securities and Futures Institute (SFI), the Gre Tai Securities Market for over-the-counter trading (GTSM-OTC), and the Corporate Governance Association (CGA). Among the corrective actions and regulatory amendments, the installation of outside directors and independent supervisors of BOD have especially been advocated. However, between 2000 and 2008, there were 130 out of a total of 712 firms delisted from the TSE, and 113 out of 546 firms delisted from the GTSM-OTC.
According to the information provided by the Taiwan Market Observation Post System (MOPS) of these delisted firms, 26.1% of them were delinquent in TSE filings, 26.1% were rejected by the Taiwan Clearing House (TCH), 21.7% were caused by negative share value, 16% suffered from severe financial distress, 8.7% were involved in financial fraud, and 1.4% were due to court-rejected reorganizations.
In order to reduce investors’ financial losses, numerous efforts have been made by researchers to identify potentially delisting firms. Charitou et al. (2007) show that, the effectiveness of the corporate governance mechanism, especially issues related to the BOD composition and ownership incentive is highly associated with a firm’s ability to survive.
Similar arguments have also been addressed by Marosi and Massoud (2007); Ning et al.
(2007); Abdullah (2006); Chen et al. (2006); Shen et al. (2006); Agrawal and Chadha (2005);
Igor et al. (2005); Sharma (2004); and Uzun, et al. (2004). In addition, firm performance related factors, such as sales, profitability, leverage, total assets, total equity, cash flows, and interest coverage, have been investigated by Charitou et al. (2007); Dahiya and Klapper (2007); Marosi and Massoud (2007); Ning et al. (2007); Barontini and Caprio (2006);
Ben-Amar and Andre (2006); Bruwer and Hamman (2006); Agrawal and Chadha (2005);
and Beasly (1996).
Among the above researches, logistic regression modeling is a popular analytical technique for identifying problematic firms. In most of the delisting firm models, the dependent variable is set as binary, i.e., the firm’s status is either delisting or listing. The independent variables of a logistic regression model can be real, discrete, and/or categorical variables (Charitou et al. 2007; Dahiya and Klapper 2007; Ferris et al. 2007; Abdullah 2006;
Chen et al. 2006; Sharma 2004; Uzun, et al. 2004; Laitinen 1999; Beasly 1996). Besides, Ning et al. (2007) develop a modified equilibrium model to investigate the determinants of board size. Sun et al. (2002) apply the seemingly unrelated regression technique to cluster stock market events resulting in mass delisting in Singapore and Malaysia between 1989 and 1998. Bruwer and Hamman (2006) apply a recursive regression method, namely the classification and regression tree algorithm (CART), to predict cash flow failures of South African companies.
The objective of this paper is to identify firms with delisting potential, based on recent experience in Taiwan. The data used in this study, both involuntarily delisted firms and those listing firms with similar business profiles between 2000 and 2008, are extracted from the database of TSE and GTSM-OTC. A logistic regression model is then developed to identify the twelve factors which are related to the BOD structure as well as financial competitiveness. Finally, using Clementine 11.1, a classification and regression tree (CART) model is developed to provide a user-friendly view of the decision tree structure. The cutoff values for serial significant factors, organized as a set of decision rules, are adopted to identify potentially delisting firms.
The rest of this paper is organized as follows. Sections II and III provide a detailed literature review of the methodological background. Section IV gives a description of the logistic regression model and the statistical test results. Section V explains the CART model
settings and results. Lastly, conclusions are stated in section VI.
II. RELATIONSHIP AMONG CORPORATE GOVERNANCE, FIRM PERFORMANCE, AND DELISTING FIRMS
Involuntarily delisting firms always experience significant cost increases after delisting (Macey et al., 2004; Panchapagesan and Werner, 2004). Information asymmetry leads unsuspecting minority stockholders to experience market losses and a substantial decrease in liquidity (Shumway and Warther, 1999). Corporate governance covers a wide spectrum of subjects, including the appropriate exercising of rights and responsibilities of shareholders, banking and government regulations, ethical practices, responsibilities of the board of directors, and financial transparency. One of the main themes of corporate governance is to develop a mechanism for avoiding the agency problem (Chuanrommanee and Swierczek, 2007).
Agency theory started with Berle and Means’ (1932) seminal work on the separation of ownership (shareholders) and control (management). Eisenhardt (1989) indicates that there exists a moral hazard, because control is in the hands of managers who act as agents on behalf of shareholders. The board of directors performs both a monitoring role and designs the executive incentives plans, these effective but conflict solutions will be combined to the total agency cost (Jensen and Meckling, 1976). Thus, corporate governance mechanism deals with resolving the conflicts. It was believed that changes made in structure of the BOD, i.e. increased board independence from management would improve board effectiveness in monitoring and incentives (Westphal, 1998).
Charitou et al. (2007) show that the structure of the BOD, e.g., the ratio of outside directors, the total number of directors, the number of board meetings during the monitoring period, and the voting power owned by officers and directors as a group, are related to delisting. Marosi and Massoud (2007) adopt the insider ownership, i.e. the ratio of holdings
of common (voting) shares by all directors and officers to the total outstanding (voting) shares, as one of the evaluation factors. The factors considered by Ning et al. (2007) include the ratio of independent directors, staggered terms of board members, the number of board committees, the percent of directors whose age is greater than sixty-two, CEO’s age, CEO’s duality, CEO as founder, CEO involved in director selection, and new CEO in the US stock market. Abdullah (2006) investigates the impacts of the percentage of independent directors, duality of board chairman and CEO, shares held by executive and non-executive directors, respectively. Agrawal and Chadha (2005) study corporate governance factors which are related to accounting scandals, including board structure, audit committee, CEO’s influence on the board, ownership structure, and outside auditor. They find that only the board and the audit committee with independent directors and financial expertise can significantly reduce the possibility of corporate fraud. Sharma (2004) identifies the percentage of independent directors, duality of board chairman and CEO, independent institutional shareholders as the major factors relevant to potential fraud in the Australian stock market.
Regarding the ownership structure, Jensen and Meckling (1976)’s seminal paper shows that a firm’s ownership structure is the primary determinant of the agency problems between controlling insiders and outside investors. Thus, ownership structure has important implications on the valuation of a firm. Lemmon and Lins (2003) suggest that ownership structure plays an important role in determining whether insiders expropriate minority shareholders. Shen et al. (2006) study the BOD ownership factors, and conclude that a higher institutional shareholder ratio and higher BOD and supervisor ownership tend to increase the firm’s market value and hence reduce the possibility in involuntary delisting in Taiwan. Barontini and Caprio (2006) investigate the relationship between ownership structure and firm performance in Continental Europe. Interestingly, they find that even family-controlled corporations exhibit larger separation between control and cash-flow
rights. In addition, they suggest that there is no significant evidence to support that family control would obstruct firm performance. According to Yeh et al. (2001) and Yeh (2003), Taiwanese listed companies are characterized as mostly family controlled with a high degree of concentrated ownership. Furthermore, Yeh (2003) also points out that the deviation of control from cash flow rights is greater in the family-controlled companies, and, on the average, a family holds more than half board seats to enhance its dominance in such a company.
When investigating the causes of delisting, many prior studies focus on financial performance. Chen and Schoderbek (1999) include one-year returns prior to delisting in a logistic regression model, and suggest that accounting numbers shown on the financial statement played a crucial role in delisting. Sueyoshi (2005) applies financial ratios to predict potentially problematic corporations. Marosi and Massoud (2007) find that firms with fewer valuable growth opportunities, higher leverage, and lower market momentum are more likely to go dark. Ning et al. (2007) identify total assets, return on assets, and total debt to assets as the significant variables resulting in delisting. Charitou et al. (2007) suggest that the likelihood of delisting is related to a firm’s governance characteristics, and the performance of the board of directors is critical to a company’s survival over a period of financial turbulence. Thus, the delisting phenomenon is related to both board features and financial operations. In this research, therefore, we consider both board characteristics and financial performance indices, including earnings per share, debt to assets ratio, return on assets and return on equities, as control variables.
III. CLASSIFICATION AND REGRESSION TREE ANALYSIS
In accounting practice, most corporate governance evaluations reach some descriptive rather than numerical conclusion. A possible conclusion, for example, could be whether a
firm is about to go dark, or distressed. By the same token, the outcomes of annual external auditing are often categorical. For instance, potential auditing outcomes include listing or delisting, pass or fail, unqualified or qualified opinion. To model the process of reaching descriptive and categorical conclusions, traditional regression models, despite their capability to include dummy variables, are limited, because they cannot model the sequential path leading to the final outcome. We therefore choose a technique which allows the use of descriptive and categorical variables and the ability to reveal the sequential path of a decision process.
A classification problem is composed of four components. The first component is the categorical outcome, i.e., the dependent variable. The second component is a set of predictors. That is the independent variables which are the characteristics related to the outcome. The third component is the training data set that includes both the known outcome and the corresponding predictors’ values. The fourth component is the test data set which is used as the targeting data to be predicted (Lewis, 2000). A classification tree is a set of inductive rules for predicting the class (or category) of the targeting object from the value of predictor variables (or characteristics).
The general inductive procedures of the classification tree method include: 1) merging:
relative to the objective variable, non-significant variables/categories being grouped with significant variables/categories; 2) splitting: selection of the significant variable to split the observant data set; 3) stopping: the criteria for stopping the tree to grow; 4) pruning:
removing the non-significant branches that contribute only insignificant tree confidence;
and 5) validation and risk estimation: evaluation and calculation of the risk (error) for the classifier used in the classification tree method (Bevilacqua et al., 2003).
The classification and regression tree (CART) modeling technique is a non-parametric statistical approach which performs binary recursive partitioning of the training data set
based on the goodness-of-splitting criteria. The splitting step exhaustively consumes the computation resource until finding the “best” splitting point for all independent variables which can reduce the “impurity” of the overall classification tree (Li, 2006). For details, see Breiman et al. (1984). The CART technique has been successfully applied in solving a wide range of classification problems. Bruwer and Hamman (2006) apply the CART method to predict company failure status in South Africa. Bevilacqua et al. (2003) construct a CART model to analyze the pump failure problem.
IV. DEVELOPMENT OF THE LOGISTIC REGRESSION MODEL FOR DELISTING FIRMS
Data Exploration
The information on the TSE and GTSM-OTC delisted firms is extracted from the Taiwan Economic Journal (TEJ) database from 2000 to 2008. To ensure the accuracy and completeness of information on all delisted firms included in this study, efforts have been made to search three additional well-known databases, the China Times News Search, the Knowledge Base Joint News Retrieval, and the Public Information Observatory. As a result, only 58 firms are used for this paper (See Table 1, Panel A). The distribution of these firms by four-digit SIC is given in Table 1, Panel B. 22 of the delisted firms, or 37.93% of the total, are in the electronics industry; 8, or 13.79%, in foods; another 8, or 13.79%, in buildings and constructions; 7, or 12.07%, in textile; 4, or 4%, in iron and steel; and the rest are in industries such as electric machinery, plastics, electrical and cable, glass and ceramics, paper and pulp, automobile.
Table 2 provides the delisting reasons of the 58 delisted firms. The delinquencies to TSE or GTSM-OTC filing and the rejections by Taiwan Clearing House (TCH) have covered for more than half of the sample firms. Negative share value and severe financial distress constitute two other important reasons for delisting (See Table 2).
To create a comparison group, it requires building up samples of listed firms that having characteristics similar to those of the delisting firms. Using the Taiwan Economic Journal database, 112 matched listed firms have been identified. Each delisted firm is matched with one to two firms that have a similar company profile in industry type, size, delisting year, and financial status. The matching criteria are below:
1. Stock exchange: securities of both groups traded on the same market.
2. Time period: one year prior to the delisting year.
3. Firm size: similarity in firm size if the total assets of a listed firm are within ± 40 percent of that of a delisted firm in the 3 years prior to the delisting year.
4. Industry: the best matching sample should stay within the most specific four-digit SIC code, known as the TEJ-Industry Level (3); otherwise, expanding the matching scope to three-digit SIC code, the TEJ-Industry Level (2); then the general two-digit SIC code, the TEJ-Industry Level (1).
5. Precautionary measure: exclusion of any listed firms with signals of potential fraud and financial distress to avoid the matching with a potentially problematic firm.
Model Development
The first part of our predictive model is the logistic regression analysis. A binary dependent variable, the delisted or listed status, is used to describe the sampled firms. As indicated in section 2, factors related to the BOD and ownership structure are the foci of this paper, and therefore the following seven related indicators(proxies) are employed in this model: 1) the size of BOD (BODSIZE); 2) the percentage of independent directors in BOD (INDEPENDENT); 3) the CEO who is also the chairman in BOD (DUAL); 4) the ratio of the total pledged shares to the total on-hand shares of the BOD and supervisors (PLEDGE);
5) the family control, if more than 50% of the shares held by board members at the end of the year are controlled by members of a family (FAMILY); 6) the ratio of the right of seating over the right of control (SEATCONTROL); and 7) the ratio of the right of control over the right of cash flow management (CONTROLCASH). In addition to these seven independent variables, this model also includes the following financial and auditing related variables: 1) the external auditing agency belonging to Big 4 CPA firms (BIG4); 2) earnings per share (EPS); 3) ratio of total liabilities to total assets (DEBTRATIO); 4) return on total assets (ROA); and 5) return on equity (ROE).
To study the linkage between delisting and corporate governance, a single-equation, logistic regression model, is as follows:
0 1 2 3 4 5
6 7 8 9 10
11 12
4
i i i i i i
i i i i i
i i
STATUS BODSIZE INDEPENDENT DUAL PLEDGE FAMILY
SEATCONTROL CONTROLCASH BIG EPS DEBTRATIO
ROA ROE
β β β β β β
β β β β β
β β
= + + + + +
+ + + + +
+ +
where,
STATUS = 1, for a firm that is delisting, and 0 otherwise;
BODSIZE = the size of directors on the board;
INDEPENDENT = percentage of independent directors in BOD;
DUAL = 1, if the CEO who is also the chairman of the BOD, and 0 otherwise;
PLEDGE = the ratio of the total pledged shares to the total on-hand shares of the BOD;
FAMILY = 1, if more than 50% of the shares held by board members at year end are controlled by members of a family, 0 otherwise;
SEATCONTROL = ratio of the right of seating over the right of control;
CONTROLCASH = ratio of the right of control over the right for cash flow;
BIG4 = 1, if the external auditing agency belongs to Big 4 CPA firms, and 0 otherwise;
EPS = earnings per share;
DEBTRATIO = ratio of total liabilities to total assets;
ROA = ratio of return on total assets;
ROE = ratio of return on equity.
Empirical Results
A univariate comparisons of corporate governance characteristics between delisted and their matched listed firms are made. The results are summarized in Table 3. For each variable, the mean and median are shown in the second and the third column, respectively. The results of the parametric t-test and the non-parametric Wilcoxon rank-sum test are shown in the fourth and the fifth column, respectively. Most of the variables reveal significant univariate difference across the samples. For the BOD composition, both the size of BOD (BODSIZE) and the percentage of independent directors in the BOD (INDEPENDENT) show significant differences between the listed and delisted groups. Delisted firms have smaller board size (t = -3.080, Wilcoxon z = -3.767) and lower percentage of independent outside directors (t = -2.488, Wilcoxon z = -2.331). Consistent with prior literature (Beasly 1996, Sharma 2004, and Chen et al. 2006), the CEO who is also the chairman in BOD (DUAL) does not show any significant difference between the delisted and listed firms in TSE and GTSM-OTC.
Concerning the BOD-ownership nexus, the univariate tests of the ratio of total pledged shares to the total on-hand shares of the BOD (PLEDGE) (t = 3.266, Wilcoxon z = -1.854) and that of the ratio of the right of seating over the right of control (SEATCONTROL) (t = 4.665, Wilcoxon z = - 4.261) are highly significant. Our PLEDGE test result confirms the general rule of thumb that firms with BOD members pledging a significant percent of their shares tend to go dark (Marosi and Massoud, 2007; Charitou et al, 2007; Dahiya and Klapper, 2007). Our SEATCONTROL test result is also consistent with previous studies that if BOD members’ right of seating is significantly deviated from the right of voting, the firm has a higher likelihood of being delisted. Lastly, regarding FAMILY and CONCASHTROL, our tests show that t = 1.860 and Wilcoxon z = -1.846 for the former, and t = -1.805 and Wilcoxon z = -2.853 for the latter at the confidence level of 0.1. The FAMILY test statistics
do not suggest that family-owned firms in Taiwan have higher likelihood of being delisted, as the majority of listed firms on the TSE and GTSM-OTC are family-owned. The tests on CONTROLCASH also reveal that this variable plays a less significant role in delisting decisions.
Finally, our test results show that all financial performance indicators are significant determinants of delisting status. The delisted firms are more likely not hiring a BIG 4 external auditing agency (BIG4, t = -2.125, Wilcoxon z = -2.103), but producing lower earnings per share (EPS, t = -9.553, Wilcoxon z = -7.831), having a higher ratio of total liabilities to total assets (DEBTRATIO, t = 10.751, Wilcoxon z = -8.390), ending up with a lower return on asset (ROA, t = -6.253, Wilcoxon z = -7.061), and experiencing a lower return on equity (ROE, t = -5.977, Wilcoxon z = -6.482) (See Table 3).
Statistics for the logistic regression of involuntary delisting on variables regarding board characteristics and financial performances are shown in Table 4. The first column lists the independent variables. The second and third columns show the correlation coefficients and standard errors. The ratio of total liabilities to total assets (DEBTRATIO, p = 0. 001) has the highest significance in the delisting model. The ratio of the total pledged shares to the total on-hand shares of the BOD (PLEDGE, p = 0.05) is significant at the confidence level of 0.05.
The size of BOD (BODSIZE, p = 0.082), the percentage of independent directors in BOD (INDEPENDENT, p = 0.082) and return on equity (ROE, p = 0.096) are significant at the confidence level of 0.1. These five are effective predictors of delisted firms. The overall correctness statistics of the regression model shows that the Cox & Snell R square is 0.489 and the Nagelkerke R square is 0.677 (See Table 4).
It is worth mentioning the functional difference between univariate analysis and logistic regression modeling. The former reveals the difference between groups in regard to one independent variable’s impact on the dependent variable, while the latter shows the impact
when all independent variables are simultaneously considered. For this reason, even if a variable, when individually considered, does not show any significance in determining the delisting status of a firm, it still has a role to play in a logistic regression.
V. DECISION TREE DEVELOPMENT FOR IDENTIFYING POTENTIALLY DELISTING FIRMS
Based on the CART methodology shown in section 3, 80% of the sampled data are used as the training set. That is, 136 out of 170 records were randomly extracted to be included in the training set. Among the selected firms, 46 are delisted firms and 90 are the matching listed firms. This leaves 34 samples in the testing set, which consists of 12 delisted firms and 22 matching listed firms. The CART model is developed using Clementine 11.1. Major algorithmic settings include: the maximum surrogate number of 10, the minimum change in impurity of 0.0001, the selection of the GINI method for categorical targets, minimum records of 2% in the parent branch, and minimum records of 1% in the child branch.
For training, CART demonstrates satisfactory results for estimating the risk of delisting. 129 out of the 136 training records are successfully classified. This is equivalent to 5.10% estimation risk or 94.9% confidence level. For the testing set, the total successful classification ratio is 79.41%, or 27 out of 34 testing records are successfully classified (See Table 5).
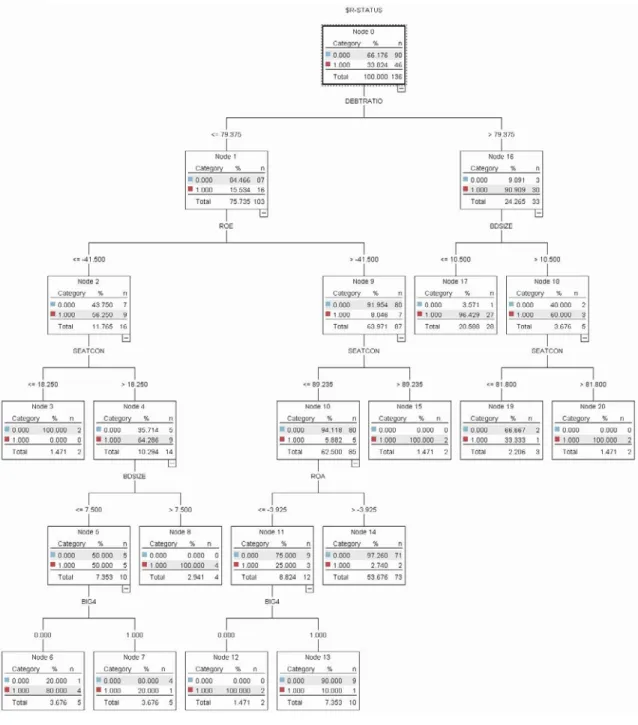
In total, there are 21 nodes, which have been generated for identifying the status of a firm. Table 6 reveals the response rate of each decision node. Column (A) represents the total number of records falling into this node. Column (B) shows the percentage of the records flowing through the current CART tree. Column (C) indicates the number of records that can be successfully classified in the corresponding category. Column (D) represents the percentage of records that can be successfully classified in the corresponding category to the total records. Column (E) shows the response rate which is the percentage of records
successfully classified in the corresponding category to the total records falling into this node. Column (F) is the response rate index which equals to (D)/(B). In terms of successfully classifying the delisting firms (STATUS=1), Nodes. 8, 12, 15, and 20 reach the highest response rate of 100%, and Nodes 17 and 6 show response rate as 96.43% and 80%, respectively. For classifying the listing firms (STATUS=0), Nodes. 3, 14, 13, and 7 also indicate a satisfactory response rate (See Table 6). The complete output decision tree is shown on Figure 1 (See Figure 1).
The CART decision tree can also be converted into a “rule-type” table. Only six out of the twelve dependent variables used in the logistic regression model are needed in the CART decision tree, namely, the ratio of total liabilities to total assets (DEBTRATIO), return on equity (ROE), the ratio of the right of seating over the right of control (SEATCON), the size of BOD (BODSIZE), return on assets (ROA), and the external auditing agency belongs to Big 4 CPA firms (BIG4).
The utility/implication of the resultant CART decision tree reveals, e.g., if the ratio of total liabilities to total assets (DEBTRATIO) of a firm is greater than 79.375% and if it’s BOD size (BODSIZE) is smaller than 10.5 seats, then this firm will go delisted with a chance of 0.964. Otherwise, if it’s BOD size (BODSIZE) is greater than 10.5 seats and it’s ratio of the right of seating over the right of control (SEATCON) is greater than 81.8%, then this firm will go delisted for sure with probability equals to 1.0. To determine the detailed threat of delisting faced by a firm, please follow the nodes and the related cutoff values as demonstrated in Table 7 (See Table 7).
VI. CONCLUSIONS
In the organized market of Taiwan, between 2000 and 2008, there were 130 out of a total of 712 firms delisted from the TSE. Also, in the over-the-counter market, there were
113 out of 546 firms delisted in the GTSM-OTC. The Taiwan Market Observation Post System (MOPS) suggested that the Taiwan’s ratio of involuntary delisting was higher than many other countries. Among the causes of delisting, inappropriate corporate governance has attracted much attention.
This paper uses a sample of 58 delisted firms and 112 listed firms with matching profiles. In addition to the utilization of delisting status as the target variable, the following twelve independent predictors are also used: 1) the size of BOD; 2) the percentage of independent directors in BOD; 3) the duality of the CEO who is also the chairman of BOD;
4) the ratio of the total pledged shares to the total on-hand shares of the BOD; 5) the family control of more than 50% of the shares held by board members at year end; 6) the ratio of the right of seating over the right of control; 7) the ratio of the right of control over the right for cash flow and 8) if the external auditing agency belongs to Big 4 CPA firms. The rest of four factors are related to the firm’s financial performance indices: 9) earning per share; 10) ratio of total liabilities to total assets; 11) return on total assets; and 12) return on equity.
A univariate test is used to examine the significance of these variables. For the BOD composition, the impacts of both the size of BOD and the percentage of independent directors in BOD are significantly different between delisted and listed groups. The duality of the CEO who is also the chairman of the BOD, on the other hand, does not play a significant role. Concerning the BOD ownership structure, the statistics related to the ratio of the total pledged shares to the total on-hand shares of the BOD, as well as the ratio of the right of seating over the right of control are significant.
As for the logistics regression model, there are five independent variables showing statistical significance. They are the ratio of total liabilities to total assets, the ratio of the total pledged shares to the total on-hand shares of the BOD, the return on equity, the size of BOD, and the percentage of independent directors in BOD.
Finally, this paper presents an alternative approach to predict delisting by using the classification and regression tree (CART) approach. This non-parametric statistical technique is especially suitable for predicting the categorical outcomes by performing binary recursive partitioning of the training set based on the goodness-of-splitting criteria.
Our resulting CART decision tree uses only six predictors: the ratio of total liabilities to total assets, return on equity, the ratio of the right of seating over the right of control, the size of BOD, return of asset, and the employment of Big 4 CPA firms as auditors. These variables are used to classify the sampled firms. The CART model presents a satisfactory output with 95% confidence level for the training set and 80% for the testing set.
Delisting may sacrifice not only the firm’s fate but also huge investors’ costs.
Examining the characteristics of the board composition and the ownership structures may avoid the manipulation of the earnings. From the professional practice point of view, this study successfully provides a user-friendly visual decision tree layout with critical indices for internal examination system, the warning signals with threshold values for investors, and the monitoring references for the supervisory commissions.
REFERENCES
Agrawal, A. and S. Chadha. 2005. Corporate governance and Accounting Scandals. Journal of Law and Economics, 48(2): 371-406.
Abdullah, S. N. 2006. Board Structure and Ownership in Malaysia: the Case of Distressed Listed Companies. The International Journal of Effective Board Performance, 6(5):
582-594.
Barontini, R. and L. Caprio. 2006. The Effect of Family Control on Firm Value and Performance: Evidence from Continental Europe. European Financial Management, 12(5): 689-723.
Beasly, M. S. 1996. An Empirical Analysis of the Relation between the Board of Director Composition and Financial Statement Fraud. The Accounting Review, 71(4): 443-465.
Ben-Amar, W. and P. Andre. 2006. Separation of Ownership from Control and Acquiring Firm Performance: The Case of Family Ownership in Canada. Journal of Business Finance & Accounting, 33(3/4): 517-543.
Berle, A. and G. Means. 1932. The Modern Corporation and Private Property. New York, NY: MacMillan.
Bevilacqua, M., M. Braglia, and R. Montanari. 2003. The Classification and Regression Tree Approach to Pump Failure Rate Analysis. Reliability Engineering and System Safety, 79: 59–67.
Breiman, L., J. Friedman, C. J. Stone, and R. A. Olshen. 1984. Classification and Regression Tree. New York City, NY: Chapman & Hall (Wadsworth, Inc.).
Bruwer, B. W. S. and W. D. Hamman. 2006. Company Failure in South Africa:
Classification and Prediction by Means of Recursive Partitioning. South African Journal of Business Management, 37(4): 7-18.
Charitou, A., C. Louca, and N. Vafeas. 2007. Boards, Ownership Structure, and Involuntary Delisting from the New York Stock Exchange. Journal of Accounting and Public Policy, 26: 249-262.
Chen, G., M. Firth, D. N. Gao, and O. M. Rei. 2006. Ownership Structure, Corporate governance, and Fraud, Evidence from China. Journal of Corporate Finance, 12:
424-448.
Chen, K. C. W. and M. P. Schoderbek. 1999. The Role of Accounting Information in Security Exchange Delisting. Journal of Accounting and Public Policy, 18: 31-57.
Chuanrommanee, W. and F. W. Swierczek. 2007. Corporate governance in ASEAN Financial Corporations: Reality or Illusion? Corporate governance: An International Review, 15(2): 272-283.
Dahiya, S. and L. Klapper. 2007. Who Survives? A Cross-Country Comparison. Journal of Financial Stability, 3(3): 261–278.
Eisenhardt, K. M. 1989. Agency Theory: An Assessment and Review. Academy of Management Review, 14(1), 57–74.
Ferris, S. P., N. Jayaraman, and S. Sabherwal. 2007. Characteristics and Behavior of Newly Listed Firms: Evidence from the Asia-Pacific Region. Journal of International Financial Markets, Institutions, and Money, 17(5): 420–436.
Harper, P. R. and D. J. Winslett. 2006. Classification Trees: A Possible Method for Maternity Risk Grouping. European Journal of Operational Research, 169(1):
146-156.
Igor, F., Y. Lien, and J. Piesse. 2005. Corporate governance and Performance in Publicly Listed, Family-Controlled Firms: Evidence from Taiwan. Asia Pacific Journal of Management, 22(3): 257-283.
Jensen, M. and W. Meckling. 1976. Theory of the Firm, Managerial Behavior, Agency Costs
and Ownership Structure. Journal of Financial Economics, 3: 305-360.
Laitinen, E. K. 1999. Predicting a Corporate Credit Analyst’s Risk Estimate by Logistic and Linear Models. International Review of Financial Analysis, 8(2): 97-121.
Lemmon, M. and K. V. Lins. 2003. Ownership Structure, Corporate governance, and Firm Value: Evidence from the East Asian Financial Crisis. Journal of Finance, 58(4):
1445-1468.
Lewis, R. J. 2000. An Introduction to Classification and Regression Tree (CART) Analysis.
Annual Meeting of the Society for Academic Emergency Medicine, San Francisco, California.
Li, Y. 2006. Predicting Materials Properties and Behavior Using Classification and Regression Trees. Materials Science and Engineering, 433: 261-268.
Macey, J., M. O’Hara, and D. Pompillo. 2005. Down and Out in the Stock Market: The Law and Finance of the Delisting Process. Cornell University working Paper.
Marosi, A. and N. Massoud. 2007. Why Do Firms Go Dark? Journal of Financial and Quantitative Analysis, 42(2): 421-442.
Ning, Y., W. N. Davidson III, and K. Zhong. 2007. The Variability of Board Size Determinants: An empirical Analysis. Journal of Applied Finance, 17(2): 48-61.
Panchapagesan, V., and M. Werner. 2004. From Pink Slips to Pink Sheets: Market Quality Around Delisting from NASDAQ. Olin School, Washington University Working Paper.
SFI-Taiwan. 2007. Report on Corporate governance in Taiwan. 2007 Report: 3-9. Taipei:
Securities and Futures Institute.
Sharma, V. D. 2004. Board of Director Characteristics, Institutional Ownership, and Fraud:
Evidence from Australia. Auditing: A Journal of Practice & Theory, 23(2): 105-117.
Shen, M., C. Hsu, and M. Chen. 2006. A Study of Ownership Structures and Firm Values under Corporate governance: The Case of Listed and OTC Companies in Taiwan’s
Finance Industry. The Journal of American Academy of Business, 8(1): 184-191.
Shumway, T. and V. A. Warther. 1999. The Delisting Bias in CRSP’s Nasdaq Data and Its Implications for the Size Effect. The Journal of Finance, 54(6): 2361-2379.
Sueyoshi, T. 2005. Financial Ratio Analysis of the Electric Power Industry. Asia-Pacific Journal of Operational Research, 22(3): 349-376.
Sun, Q., Y. K. Tang, and W. H. S. Tong. 2002. The Impacts of Mass Delisting: Evidence from Singapore and Malaysia. Pacific-Basin Finance Journal, 10(3): 333-351.
Uzun, H., S. H. Szewczyk, and R. Varma. 2004. Board Composition and Corporate Fraud.
Financial Analysts Journal, 60(3): 33-43.
Westphal, J. D. 1998. Board Games: How CEO’s Adapt to Increases in Structural Board Independence from Management. Administrative Science Quarterly, 43(3), 511–537.
Yeh, Y. H, T. S. Lee, and T. Woidtke. 2001. Family Control and Corporate governance:
Evidence for Taiwan. International Review of Finance, 2: 21-48.
_____. 2003. Corporate Ownership and Control: New Evidence from Taiwan. Corporate governance and Control, 1(1): 87-101.
Zahra, S. A. and J. A. Pearce II. 1989. Boards of Directors and Corporate Financial Performance: A Review and Integrative Mode. Journal of Management, 15(2):
291-334.
TABLE 1 Descriptive Information Panel A: Involuntarily Delisted Firms
Total number of delisted firms of TSE or OTC, 2000-2008 123 Less: firms with insufficient information:
Finance Institutes (34)
Firms merged by other firms or groups (16)
Convert to OTC (2)
Missing data (13)
Total number of delisted firms used in this study 58
Panel B: Industry codes and types distribution
Industry Codea Industry Description Delisted Firms Percentage(%)
1200 Foods 8 13.79
1300 Plastics 1 1.72
1400 Textiles 7 12.07
1500 Electric Machinery 2 3.45
1600 Electrical and Cab 1 1.72
1800 Glass and Ceramics 1 1.72
1900 Paper and Pulp 1 1.72
2000 Iron and Steel 4 6.90
2200 Automobile 1 1.72
2300 Electronics 22b 37.93
2500 Building and Cons. 8 13.79
9900 Others 2 3.45
Total 58 100
a TEJ adopts four-digit to distinguish the firms. The first digit indicates the general industry code, and the second and third represent more specific category.
b In 58 delisted firms, 22 belong to Electronic industry. Elecronic industry has been an emerging high-tech industry in Taiwan since 1990s and also made Taiwan a well-known high-tech island. However, owing to the critical R & D techniques, the industry is also considered with high risk.
TABLE 2 Detailed Breakdown of Delisting Reasons
Reasonsa Observations Percentage (%)
Delinquency in the TSE filing 18 26.1
Negative share value 15 21.7
Reorganization not permitted by the court 1 1.4 Rejection by the Taiwan Clearing House (TCH) 18 26.1
Severe financial fraud 6 8.7
Severe financial distress 11 16.0
Total occurrences observed 69 100.0
a Involuntary delisting often results from violating more than one suspension reason; some firms may incur more than one reason.
TABLE 3 Univariate Comparison of Corporate Governance Characteristics between Delisted and Their Matched Listed Firms
Mean Median t-test Wilcoxon Z
BODSIZE -3.080(.002) *** -3.767(.000) ***
Delist 7.9483 3.09738
N-Delist 9.5893 3.38931
INDEPENDENT -2.488(.014) ** -2.331(.020) **
Delist .0369 .09349
N-Delist .0956 .16177
DUAL 1.202(.231) -1.200(.230)
Delist .3276 .47343
N-Delist .2411 .42966
PLEDGE 3.266(.001) *** -1.854(.064) *
Delist .2759 .34665
N-Delist .1342 .21698
BIG4 -2.125(.035) ** -2.103(.035) **
Delist .6034 .49345
N-Delist .7589 .42966
FAMILY 1.860(.065) * -1.846(.065) *
Delist .7414 .44170
N-Delist .5982 .49246
SEATCONTROL 4.665(.000) *** -4.261(.000) ***
Delist .5750 .28781
N-Delist .3766 .24879
CONTROLCASH -1.850(.066) * -2.853(.004) ***
Delist .0366 .08247
N-Delist .0694 .12203
EPS -9.553(.000) *** -7.831(.000) ***
Delist -4.5862 4.11687
N-Delist .5446 2.82488
DEBTRATIO 10.751(.000) *** -8.390(.000) ***
Delist .9167 .37966
N-Delist .4503 .18529
ROA -6.253(.000) *** -7.061(.000) ***
Delist -10.4603 19.34891
N-Delist 2.6053 7.76104
ROE -5.977(.000) *** -6.482(.000) ***
Delist -43.9828 39.03687
N-Delist 9.4286 61.93541
Total sample of 170 with delisted firms of 58, and matched listed firms of 112. BODSIZE = the size of directors on the board; INDEPENDENT = percentage of independent directors in BOD; DUAL = 1, if the CEO who is also the chairman of the BOD, and 0 otherwise; PLEDGE = the ratio of the total pledged shares to the total on-hand shares of the BOD; FAMILY = 1, if more than 50% of the shares held by board members at year end are controlled by members of a family, 0 otherwise; SEATCONTROL = ratio of the right of seating over the right of control; CONTROLCASH = ratio of the right of control over the right for cash flow; BIG4 = 1, if the external auditing agency belongs to Big 4 CPA firms, and 0 otherwise; EPS = earnings per share; DEBTRATIO = ratio of total liabilities to total assets; ROA = return on total assets; ROE = return on equity. The t-test and the Wilcoxon rank-sum test are used to test for the significance of the result. Significance (two-tailed) is denoted by
***, **, * for p < 0.01, p < 0.05, P < 0.10, respectively.
TABLE 4 Logistic Regression Statistics
Independent Variables β S.E. Wald df p-value Exp(β)
DEBTRATIO 0.05 0.015 11.534 1 0.001*** 1.051
β0 -4.364 1.359 10.308 1 0.001*** 0.013
PLEDGE 0.019 0.01 3.842 1 0.050** 1.019
BODSIZE -0.153 0.088 3.026 1 0.082* 0.858
INDEPENDENT 0.046 0.027 3.015 1 0.082* 1.047
ROE -0.011 0.007 2.775 1 0.096* 0.989
BIG4 -0.782 0.563 1.93 1 0.165 0.458
SEATCONTROL 0.014 0.012 1.359 1 0.244 1.014
ROA -0.039 0.04 0.97 1 0.325 0.962
DUAL 0.569 0.595 0.914 1 0.339 1.766
EPS -0.113 0.12 0.88 1 0.348 0.893
CONTROLCASH 0.019 0.031 0.379 1 0.538 1.019
FAMILY 0.285 0.663 0.185 1 0.667 1.33
DEBTRATIO = ratio of total liabilities to total assets; PLEDGE = the ratio of the total pledged shares to the total on-hand shares of the BOD; BODSIZE = the size of directors on the board; INDEPENDENT = percentage of independent directors in BOD; ROE = return on equity; BIG4 = 1, if the external auditing agency belongs to Big 4 CPA firms, and 0 otherwise; SEATCONTROL = ratio of the right of seating over the right of control; ROA = return on total assets; DUAL = 1, if the CEO who is also the chairman of the BOD, and 0 otherwise; EPS = earnings per share; CONTROLCASH = ratio of the right of control over the right for cash flow; FAMILY = 1, if more than 50% of the shares held by board members at year end are controlled by members of a family, 0 otherwise.
Cox & Snell R square: 0.489, Nagelkerke R square: 0.677
Significance (two-tailed) is denoted by ***, **, * for p < 0.01, p < 0.05, P < 0.10, respectively.
TABLE 5 Performance of the CART Model Risk Estimation from the Training Dataset
Predicted
0 (Listing) 1 (Delisting) Total
0 (Listing) 88 2 90
Actual
1 (Delsiting) 5 41 46
Total 93 43 136
Risk estimated = 0.051 Standard error = 0.019 Confidence level = 0.949 Successful Estimation Performance of the Testing Dataset
Predicted
0 (Listing) 1 (Delisting) Total
0 (Listing) 20 2 22
Actual
1 (Delsiting) 5 7 12
Total 25 9 34
Successful classification ratio = 0.7941
TABLE 6 Node Response Rate Performance Output
Interactive Tree of CART for Estimating Delisted Firms in TSE and OTC, STATUS=1
A B C D E F
Node number Node: n Node (%) Gain: n Gain (%) Response (%) Index (%)
8 4 2.94 4 8.70 100.00 295.65
12 2 1.47 2 4.35 100.00 295.65
15 2 1.47 2 4.35 100.00 295.65
20 2 1.47 2 4.35 100.00 295.65
17 28 20.59 27 58.70 96.43 285.09
6 5 3.68 4 8.70 80.00 236.52
19 3 2.21 1 2.17 33.33 98.55
7 5 3.68 1 2.17 20.00 59.13
13 10 7.35 1 2.17 10.00 29.57
14 73 53.68 2 4.35 2.74 8.10
3 2 1.47 0 0.00 0.00 0.00
Interactive Tree of CART for Estimating Listed Firms in TSE and OTC, STATUS=0 Node number Node: n Node (%) Gain: n Gain (%) Response (%) Index (%)
3 2 1.47 2 2.22 100.00 151.11
14 73 53.68 71 78.89 97.26 146.97
13 10 7.35 9 10.00 90.00 136.00
7 5 3.68 4 4.44 80.00 120.89
19 3 2.21 2 2.22 66.67 100.74
6 5 3.68 1 1.11 20.00 30.22
17 28 20.59 1 1.11 3.57 5.40
8 4 2.94 0 0.00 0.00 0.00
12 2 1.47 0 0.00 0.00 0.00
15 2 1.47 0 0.00 0.00 0.00
20 2 1.47 0 0.00 0.00 0.00
TABLE 7 Decision Rules Set Converted from the CART Tree to Identify Delisted Firms Ratio of total liabilities to total assets (DEBTRATIO) > 79.375% [Mode: 1] (33)
Size of directors on the board (BODSIZE) <= 10.5seats [Mode: 1] => 1.0 (28; 0.964) (Delisted)
Size of directors on the board (BODSIZE) > 10.5 seats [Mode: 0] (5)
Ratio of the right of seating over the right of control (SEATCONTROL) <= 81.8%
[Mode: 0] => 0.0 (3; 0.667)
Ratio of the right of seating over the right of control (SEATCONTROL) > 81.8%
[Mode: 1] => 1.0 (2; 1.0) (Delisted)
Ratio of total liabilities to total assets (DEBTRATIO) <= 79.375% [Mode: 0] (103) Ratio of return on equity (ROE) <= -41.5% [Mode: 1] (16)
Ratio of the right of seating over the right of control (SEATCONTROL) <= 18.25%
[Mode: 0] => 0.0 (2; 1.0)
Ratio of the right of seating over the right of control (SEATCONTROL) > 18.25%
[Mode: 1] (14)
Size of directors on the board (BODSIZE) <= 7.5 seats [Mode: 1] (10) External auditing agency does not belong to Big 4 CPA firms, BIG4 = 0
[Mode: 1] => 1.0 (5; 0.8) (Delisted)
External auditing agency belongs to Big 4 CPA firms, BIG4 = 1 [Mode: 0] => 0.0 (5; 0.8)
Size of directors on the board (BODSIZE) > 7.5 seats [Mode: 1] => 1.0 (4; 1.0) (Delisted)
Ratio of return on equity (ROE) > -41.5% [Mode: 0] (87)
Ratio of the right of seating over the right of control (SEATCONTROL)<= 89.235%
[Mode: 0] (85)
Ratio of return on total assets (ROA) <= -3.925% [Mode: 0] (12)
External auditing agency does not belong to Big 4 CPA firms, BIG4 = 0 [Mode: 1] => 1.0 (2; 1.0) (Delisted)
External auditing agency belongs to Big 4 CPA firms, BIG4 = 1 [Mode: 0] => 0.0 (10; 0.9)
Ratio of return on total assets (ROA) > -3.925% [Mode: 0] => 0.0 (73; 0.973) Ratio of the right of seating over the right of control (SEATCONTROL) > 89.235%
[Mode: 1] => 1.0 (2; 1.0) (Delisted)
FIGURE 1 The Classification and Regression Tree for Identifying the Delisting Firms in TSE and GTSM-OTC