Sodium/Glucose Co-transporter 1 Expression Increases in human diseased prostate
Alicia Blessing,1* Lei Xu,1* Guang Gao,1* Lakshmi Reddy Bollu,1 Hangwen Li,2 Xuefeng Wu,1 Jiangong Ren,1 Fei Su,1 Wei-Chien Huang,3 Mien-Chie Hung,4 Lei Huo,5 Ganesh S. Palapattu,2 and Zhang Weihua1†
1, Department of Biology and Biochemistry, University of Houston, Houston, TX, 77204, USA.
2, Department of Urology, Methodist Hospital Research Institute, Houston, TX, 77030, USA.
3, Center for Molecular Medicine, China Medical University Hospital, Taichung 404, Taiwan.
4, Department of Molecular and Cellular Oncology, The University of Texas MD Anderson Cancer Center, Houston, TX 77030, USA.
5, Department of Pathology, The University of Texas MD Anderson Cancer Center, Houston, TX 77030, USA.
*, Authors contributed equally
Pages: 18; Figures: 7; Tables: 1.
Support: This study is supported in part by grants from American Cancer Society and Department of Defense Prostate Cancer Research Program to Z. W.
†, Correspondence to:
Zhang Weihua, PhD
Assistant Professor
Department of Biology and Biochemistry
College of Natural Sciences and Mathematics
University of Houston
Houston, TX 77204-5001
Office: HSC358
Work: 713-743-8382
Email: [email protected]
Running title: SGLT1 in human prostate
ABSTRACT
Sodium/glucose co-transporter 1 (SGLT1) is an active glucose transporter that takes up glucose into cells independent of the extracellular concentration of glucose. This transporter plays a critical role in maintaining glucose homeostasis at both physiological and pathological levels. The expression level of SGLT1 in normal and diseased human prostatic tissue has not been determined. We produced two rabbit polyclonal antibodies against human SGLT1, one each for immunohistochemical and Western blot analyses, and characterized the expression of SGLT1 in human prostate tissues: normal prostate (n=3), benign prostatic hyperplasia (BPH) (n=53), prostatic intraepithelial neoplasia (PIN) (n=9), and prostate cancer (PCa) (n=44). In normal prostate tissue, SGLT1 was weakly expressed exclusively in the epithelium. The transporter was significantly increased in the basal cells and stromal cells of BPH, increased in the epithelial cells of PIN, and frequently overexpressed in stromal cells and universally overexpressed in the tumor cells of PCa. The pattern of expression was shown as
membranous/cytoplasmic staining in low-grade cancer cells and nuclear envelope staining in high- grade cancer cells. The SGLT1-positive stromal cells of BPH and PCa tissues were negative for tenascin, a marker of reactive stromal cells. We concluded that SGLT1 is up-regulated in BPH and PCa. SGLT1 may serve as a potential therapeutic target for treating these prostate disorders.
INTRODUCTION
Influx of glucose into cells is carried out by two main classes of glucose transporters, the facilitative glucose transporters (GLUTs) and the active sodium/glucose co-transporters (SGLTs).1 GLUTs mediate a concentration-dependent and energy-independent bidirectional process of glucose
transport. In contrast, SGLTs mediate an active Na+ gradient–dependent glucose uptake regardless of the extracellular glucose concentration.2, 3 The SGLT family consists of 3 members, SGLT1, SGLT2, and SGLT31; the last may function as a glucose sensor rather than a transporter.4
Increased glucose uptake and GLUT expression are associated with pathological conditions, such as hypoxia, inflammation, and neoplasia. Hypoxia induces GLUT1 expression in neurons5, 6 and
chondrocytes,6 and inflammation up-regulates GLUT1 in macrophages7 and vascular endothelial cells.8 GLUT1 is often induced in many cancers, including those of the breast, cervix, esophagus, lung, and liver.9
Normal prostatic epithelium is not active in glucose metabolism.10 However, glucose uptake has often been observed for high-grade prostate cancer (PCa),11 hinting at an association between altered glucose metabolism and the pathogenesis of PCa. Yet several studies have found significantly decreased levels of GLUT expression in PCa.12, 13 The glucose transporter or transporters that are involved in the increased glucose uptake observed in PCa remain to be investigated.
To explore the possibility of a role for SGLT in pathogenesis of prostate diseases, we produced and characterized two rabbit polyclonal antibodies against human SGLT1 to examine its expression levels in human prostate tissues including normal, benign prostate hyperplasia (BPH), prostatic
intraepithelial neoplasia (PIN), and PCa.
MATERIALS AND METHODS
Antibody Production and Purification
Two peptides, CIETQVPEKKKGIFRR and CLRNSKEERIDLDAE, corresponding to amino acids 588- 604 and 563-576 of human SGLT1 were used to raise rabbit polyclonal antibodies suitable for
immunohistochemical analysis (SGLT1-IHC) and Western blotting (SGLT1-WB). Both antibodies were produced by GenScript (Piscataway, NJ).
HiTrap affinity columns (General Electric, Uppsala, Sweden) were used to purify the SGLT1 antibodies from SGLT1 antiserum. To purify the antibody, the columns were coupled with the antigenic peptide at a concentration of 1 mg/mL in coupling buffer (0.2 M NaHCO3, 0.5 M NaCl, pH=8.3) for 30 minutes at room temperature. The column was then exposed to buffer A (0.5 M ethanolamine, 0.5 M NaCl, pH=8.3) and buffer B (0.1 M acetate, 0.5 M NaCl, pH=4) 3 times. Five hundred microliters of the pre-immune serum and 500 L of the antiserum were diluted in binding buffer (0.2 M NaH2PO4,pH=7.0) and passed through the column. The bound antibodies were eluted with 3 mL of elution buffer (1 M glycine-HCl, pH=2.7). The elutant was immediately neutralized with neutralizing buffer (1 M Tris-HCl, pH=9.0), and 0.02% Na3N was added to the purified antibody for long-term storage.
Cell Culture
PC3, DU145, LNCap, HCT116, and HEK293T cells were cultured in Dulbecco’s modified Eagle’s medium) (Invitrogen, Carlsbad, CA) and supplemented with 5.5 mM glucose, 10% fetal bovine serum, and 1% penicillin/streptomycin. Cells were cultured at 37°C with 5% CO2.
Plasmid Construction
Human SGLT1 cDNA was amplified from a cDNA library using a pair of primers,
GCTGCCACCATGGACAGTAG and CAGCAAAAGGTAGGACTCAGG, corresponding to the 5’ and 3’UTR of SGLT1. A second round of polymerase chain reaction was performed using a pair of nested
primers, TGAGTCGACGGCAAAATATGCATGGCAAAAGACAGCCACGGTCACC and
ATAGAATTCATGGA-CAGTAGCACCTGGAGCCCCAAGACCA. The polymerase chain reaction product of SGLT1 was cloned into a PXF2F expression vector between the SalI and EcoRI sites, which produced a SGLT1 cDNA with a FLAG tag at both the N-terminus and the C-terminus. The construct was confirmed by sequencing. The tagging at both ends allows the protein to be expressed at a stable level in the absence of epidermal growth factor receptor (EGFR) and was used as a positive control for antibody characterization.
The U6 promoter-driven small interfering (siRNA) vector with green fluorescent protein (GFP) expression (pRNAT-U6.1/Neo; GenScript) was used to express siRNA against SGLT1. The target sequence for SGLT1 siRNA was TCTTCCGCATCCAGGTCAAT. The negative control siRNA sequence was GAACAATGTTGACCA GGTGA.
siRNA Knockdown and Western Blotting
Whole-cell lysates of intact cells (PC3, DU145, LNCaP and HCT116 HEK293T) cells were transfected with vectors expressing FLAG-tagged SGLT1 in combination with vectors expressing SGLT siRNA or its corresponding scrambled control. At the time of transfection, cells were cultured in their respective media without the supplemented 1% penicillin/streptomycin. Six hours post-transfection, the media were replaced with normally formulated media. At 48 hours after transfection, the cells were lysed for 30 minutes on ice in RIPA buffer (Sigma Aldrich, St. Louis, MO) supplemented with protease and phosphatase inhibitors. The concentrations of the protein samples were measured using a Qubit flourometer (Invitrogen), and equal amounts of protein samples were loaded onto a 10% SDS-PAGE gel and transferred to a polyvinylidine fluoride membrane. Membranes were incubated in 5% milk to block the non-specific binding sites for 30 minutes and then in optimized concentrations of SGLT1- WB or primary anti-FLAG antibody (Santa Cruz Biotechnology, Santa Cruz, California) at 4°C
overnight. After being washed with 3x phosphate-buffered saline (PBS), membranes were incubated
with horseradish peroxidase–conjugated secondary antibodies (Santa Cruz Biotechnology) at 1:3000 dilution for 1 hour at room temperature. Luminescent signals were detected using an enhanced luminescence kit (Pierce ThermoScientific, Rockford, IL) and exposure to X-ray film (VWR, Bridgeport, NJ).
siRNA Knockdown and Immunocytochemical Analysis
Vectors expressing SGLT siRNA or its corresponding scrambled control were transiently transfected into HCT116 cells cultured on collagen-coated glass coverslips using Lipofectamine 2000 (Invitrogen) in Opti-MEM (Invitrogen). At the time of transfection, cells were cultured in their respective media without the supplemented 1% penicillin/streptomycin. Six hours post-transfection, the media were replaced with normally formulated media. At 30 hours post-transfection, cells were fixed with 4%
paraformaldehyde and permeabilized with 0.5% Triton X-100 (Sigma-Aldrich) in PBS.
Slides were blocked by incubating cells in normal goat serum for 1 hour followed by primary antibody against SGLT1 (1:200 in PBS) overnight at 4°C. After being washed, cells were exposed to Alexa Fluor 594 secondary antibody (1:200; Invitrogen) for 1 hour at room temperature. After three washes with PBS, coverslips were mounted on microscopic slides using 10 L of VECTASHIELD mounting medium with 4',6-diamidino-2-phenylindole (DAPI) (Vector Laboratories, Burlingame, CA).
Fluorescence images were captured and analyzed with a fluorescent Olympus microscope.
Tissue Preparation
Paraffin-embedded tissue microarrays containing normal human tissues and human prostate tissues, BPH tissues, PIN tissues, and PCa tissues were purchased from Lifespan Biosciences (Seattle, WA).
An additional five BPH tissue samples were obtained from the Methodist Hospital Research Institute’s Department of Urology (Houston, TX) tissue bank under the approval of its institutional review board.
IHC Analysis
Immunoperoxidase Staining
For immunoperoxidase staining with diaminobenzidine labeling, tissue sections were deparaffinized in xylene and rehydrated in a graded series of alcohol and PBS. Antigen retrieval was performed using heated citrate buffer. Endogenous peroxidase activity was blocked with 3% hydrogen peroxide in methanol. Samples were incubated in a blocking solution (5% donkey serum in PBS) for 1 hour at room temperature and then overnight at 4°C with the primary antibody against SGLT1 diluted in the blocking solution (1:200). After three washes in PBS, samples were incubated with a biotinylated goat anti-rabbit secondary antibody (1:500) for 1 hour at room temperature and then washed thoroughly.
An ABC staining kit was used for chromogenesis. Slides were then briefly counterstained with hematoxylin and mounted.
Immunofluorescent Co-staining
For immunofluorescent co-staining of SGLT1 and tenascin, tissue slides were co-incubated with the rabbit polyclonal antibody against SGLT1 (1:200 dilution, or with 1 mg/mL blocking peptides for the control) and a monoclonal anti-tenascin antibody (1:200) in PBS containing 10% donkey serum. After being washed three times with PBS, tissues were incubated with Alexa Fluor 488–conjugated donkey anti-rabbit immunoglobulin G, Alexa Flour 594–conjugated donkey anti-mouse immunoglobulin G, or both (Invitrogen) in PBS containing 10% donkey serum for 30 minutes at room temperature. The stained samples were then washed three times (5 minutes per wash) with PBS, also at room temperature. Fluorescence images were captured and analyzed with a confocal microscope (Olympus).
RESULTS
Characterization of Rabbit Antibodies Against Human SGLT1 SGLT1-WB
The specificity of SGLT1-WB was characterized by the following experiments. First, we transiently transfected FLAG-tagged SGLT1 plasmids with either SGLT1 siRNA or control siRNA into HEK293T cells and determined the levels of FLAG-tagged SGLT1 of these cells by Western blotting using a primary antibody against FLAG. The flagged SGLT1 produced four major bands of >250, 150, 80, and 55 kDa, which were all substantially reduced only by the SGLT1 siRNA in a dose-dependent manner (Figure 1A). The >250-kDa and 150-kDa bands might be aggregates of overexpressed SGLT1. Because the exogenous SGLT1 was flagged at both the N- and C-termini, the expected molecular weight was 80 kDa. The 55-kDa band is likely degraded SGLT1. Using the same set of cell lysates, we detected the expression of SGLT1 in these cells using the SGLT1-WB primary antibody.
The results were similar, will all four bands detected by SGLT1-WB reduced by SGLT1 siRNA in a dose-dependent manner (Figure 1B).
We then determined the expression of endogenous SGLT1 in a panel of cell lines PC3, PC3-MM2, DU145, and LNCaP. SGLT1-WB detected a single band at the expected 70 kDa (endogenous
SGLT1) in the PC3, PC3-MM2, and LNCaP lines; only the DU145 line did not express SGLT1 (Figure 1C). To determine the specificity of the endogenous SGLT1 signal, we transiently transfected SGLT1 siRNA and its control siRNA into PC3 cells and determined the expression levels of the endogenous SGLT1 using SGLT1-WB. The SGLT1 signal at about 70 kDa was reduced by the addition of SGLT1 siRNA (Figure 1D).
Taken together, these data suggest that SGLT1-WB is suitable for Western blot analysis.
SGLT1-IHC
To characterize the SGLT1-IHC antibody, we conducted two types of control experiments. First, we tested the specificity of this antibody by using immunocytochemical analysis on cells treated with control siRNA or SGLT1 siRNA. Because colon cancers express SGLT1,14 we used colon cancer HCT116 cells as a positive control. The expression of SGLT1 in HCT116 cells treated with control siRNA or SGLT1 siRNA was first confirmed by Western blotting using the SGLT1-WB antibody (Figure 2A).
Then we performed immunocytochemical staining using SGLT1-IHC with HCT116 cells. The siRNA expression vector expresses green fluorescent protein (GFP) under an autonomous CMV promoter—
that is, cells that have taken up the siRNA vector are GFP-positive, which allows us to differentiate siRNA-transfected cells from non-transfected cells. We used Alexa Fluor 594–conjugated secondary antibody to label the SGLT1-IHC signal. The control siRNA transfected and non-transfected cells presented equal levels of SGLT1; however, the SGLT1 signal was significantly reduced in the SGLT1 siRNA–transfected cells compared with the control siRNA–transfected and non-transfected cells (Figure 2B).
To further characterize SGLT1-IHC, we compared the immunohistochemical signals produced by SGLT1-IHC in the absence or presence of its blocking peptides in normal human intestine tissue, which is known to express SGLT1.15 SGLT1-IHC gave rise to clear positive signals in the epithelial cells of the small intestine, which were significantly reduced by its blocking peptides (Figure 2C).
Together, these results show that SGLT1-IHC is specific for endogenous SGLT1.
SGLT1 Up-regulation in Diseased Human Prostatic Tissue
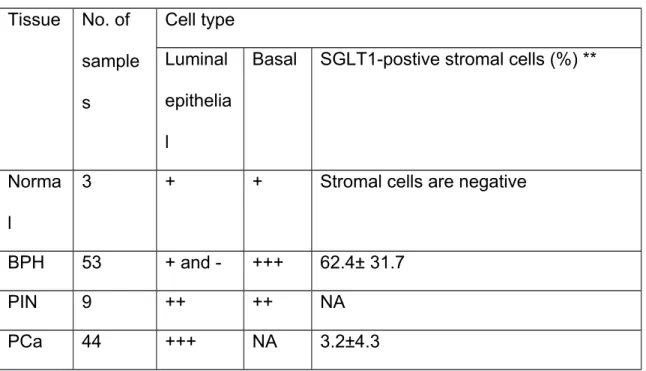
Using SGLT1-IHC, we profiled the expression of SGLT1 in samples of normal prostate (n=3), BPH (n=53), PIN (n=9), and PCa (n=44). SGLT1 was weakly expressed in the luminal epithelial cells of normal tissue (Figure 3). BPH tissues had a discontinuous layer of basal cells with high levels of
SGLT1 expression as well as SGLT1-positive stromal cells (Figure 4). Even greater SGLT1 expression was consistently observed in the epithelial cells of PIN samples (Figure 5). Cancer cells of all the prostate cancer samples were strongly positive for SGLT1 (Figure 6). Overall, the examples exhibited a pattern of membranous or cytoplasmic staining in cells of lower grade cancers and nuclear envelope staining in cells of high-grade cancers. SGLT1-positive stromal cells were also observed in PIN and PCa tissues but to a lesser extent than in the BPH samples. A semiquantitative summary of SGLT1 expression in these prostatic tissues is presented in Table 1.
SGLT1-Positive, Tenascin-Negative Stromal Cells in Diseased Human Prostatic Tissue
Tissue stromal cells can be activated by pathological insults, which is often the case for diseased prostates.16, 17 Because we observed that stromal cells of BPH tissues and some PCa tissues were positive for SGLT1, we performed immunofluorescent co-staining of SGLT1 with a reactive stromal cell marker, tenascin,17 to determine whether the SGLT1-positive stromal cells were reactive stromal cells. To our surprise, the SGLT1-positive stromal cells were tenascin negative (Figure 7), suggesting they are not reactive stromal cells in BPH or PCa tissue.
DISCUSSION
The normal human prostate gland produces, accumulates, and secrets high levels of citrate, which is predominantly derived from the oxidation of fatty acids.10,18 Because the normal prostate is not active in glucose metabolism but relies on fatty acid metabolism, the role of glucose and its transporters in prostate biology has not been adequately investigated. However, emerging data suggest that both BPH and PCa are associated with altered glucose metabolism. Blood glucose levels positively correlate with prostate size in BPH,19 and the incidence of both BPH and PCa correlates with metabolic syndrome,20 of which glucose intolerance is one of the major abnormalities. In addition, high-grade PCa and PCa metastases exhibit increased glucose uptake.11, 21 Moreover, PCa cells are sensitive to glucose starvation–induced autophagy.22 The cumulative evidence strongly suggests that
glucose metabolism is critically involved in the pathogenesis of prostate diseases, such as BPH and PCa.
Our study showed that the expression of SGLT1 is significantly increased in basal cells and stromal cells of BPH tissue compared with normal prostate tissue. The heterogeneous expression of SGLT1 in the basal cells and stromal cells of BPH is intriguing, which suggests that neither cell type is metabolically homogenous. These results strongly suggest a one-way glucose flux from the basal cells to the luminal epithelial cells in the normal prostate. The biological roles of SGLT1-positive basal cells and stromal cells in the pathogenesis of BPH demand further study.
The highly increased expression of SGLT1 in the epithelial cells of PIN and PCa cells relative to the cells of normal prostate and BPH tissues suggests that a high level of glucose is required during the pathogenesis of PCa. GLUT1 has been found to be expressed exclusively in luminal epithelial cells and in borders between the basal and luminal epithelial cells,13 and GLUT1 expression is decreased in PCa cells compared with non-cancer cells.12, 13 This shift from GLUT1 to SGLT1 in epithelial cells indicates a higher demand for glucose during the pathogenesis of PCa.
The stroma of PCa tissues also contains regions with a variable amount of SGLT1-positive stromal cells; these cells are not tenascin-positive reactive stromal cells.23Reactive stromal cells have been show to play critical roles in the pathogenesis of BPH and PCa.16, 24 These data added another layer of complexity to our increasing understanding of the role of stromal cells in the development of PCa and BPH. The variability of SGLT1-positive stroma in PCa might contribute to the lack of consistency between 18F-fluoro-2-deoxy-2-D-glucose (FDG) positron emission tomography results of early-stage PCa,25 when tumor foci are small and scattered, because the FDG uptake by SGLT1-positive stromal cells may overshadow the uptake by cancer foci. The translocation of SGLT1 into the nuclear
envelope of high-grade PCa that we observed is also intriguing and is reminiscent of proteins such as pyruvate kinase M2,26 protein kinase C η,27 CXCR4,28 annexin A1,29 and EGFR30 that reside in the
non-nuclear compartments of normal cells and translocate to the nucleus of cancer cells, where they are involved in nuclear events critical for cancer cell proliferation and survival.
The overall expression pattern of SGLT1 in normal prostate, BPH, and PCa tissues is very similar to the expression pattern of EGFR, which is weakly expressed in the epithelial cells of normal prostate tissue, moderately expressed in the stromal cells in BPH, and significantly increased in cancer cells.31-
34 These findings suggest that SGLT1 and EGFR expression might be regulated under a common mechanism, and they support our previous finding that EGFR interacts with or stabilizes SGLT1 in PCa cells.35 Further investigation is needed to understand the association between EGFR and SGLT1 during the development of PCa.
References
1. Zhao FQ, Keating AF: Functional properties and genomics of glucose transporters, Curr Genomics 2007, 8:113- 128
2. Wright EM, Loo DD, Hirayama BA: Biology of human sodium glucose transporters, Physiol Rev 91:733-794 3. Castaneda-Sceppa C, Castaneda F: Sodium-dependent glucose transporter protein as a potential therapeutic
target for improving glycemic control in diabetes, Nutr Rev 69:720-729
4. Diez-Sampedro A, Hirayama BA, Osswald C, Gorboulev V, Baumgarten K, Volk C, Wright EM, Koepsell H: A glucose sensor hiding in a family of transporters, Proc Natl Acad Sci U S A 2003, 100:11753-11758
5. Vannucci SJ, Seaman LB, Vannucci RC: Effects of hypoxia-ischemia on GLUT1 and GLUT3 glucose transporters in immature rat brain, J Cereb Blood Flow Metab 1996, 16:77-81
6. Peansukmanee S, Vaughan-Thomas A, Carter SD, Clegg PD, Taylor S, Redmond C, Mobasheri A: Effects of hypoxia on glucose transport in primary equine chondrocytes in vitro and evidence of reduced GLUT1 gene expression in pathologic cartilage in vivo, J Orthop Res 2009, 27:529-535
7. Gamelli RL, Liu H, He LK, Hofmann CA: Augmentations of glucose uptake and glucose transporter-1 in macrophages following thermal injury and sepsis in mice, J Leukoc Biol 1996, 59:639-647
8. Mann GE, Yudilevich DL, Sobrevia L: Regulation of amino acid and glucose transporters in endothelial and smooth muscle cells, Physiol Rev 2003, 83:183-252
9. Macheda ML, Rogers S, Best JD: Molecular and cellular regulation of glucose transporter (GLUT) proteins in cancer, J Cell Physiol 2005, 202:654-662
10. Costello LC, Franklin RB: The intermediary metabolism of the prostate: a key to understanding the pathogenesis and progression of prostate malignancy, Oncology 2000, 59:269-282
11. Shiiba M, Ishihara K, Kimura G, Kuwako T, Yoshihara N, Sato H, Kondo Y, Tsuchiya SI, Kumita SI: Evaluation of primary prostate cancer using (11)C-methionine-PET/CT and, Ann Nucl Med
12. Godoy A, Ulloa V, Rodriguez F, Reinicke K, Yanez AJ, Garcia Mde L, Medina RA, Carrasco M, Barberis S, Castro T, Martinez F, Koch X, Vera JC, Poblete MT, Figueroa CD, Peruzzo B, Perez F, Nualart F: Differential subcellular distribution of glucose transporters GLUT1-6 and GLUT9 in human cancer: ultrastructural localization of GLUT1 and GLUT5 in breast tumor tissues, J Cell Physiol 2006, 207:614-627
13. Reinicke K, Sotomayor P, Cisterna P, Delgado C, Nualart F, Godoy A: Cellular distribution of Glut-1 and Glut-5 in benign and malignant human prostate tissue, J Cell Biochem 2011, 113:553-562
14. Guo GF, Cai YC, Zhang B, Xu RH, Qiu HJ, Xia LP, Jiang WQ, Hu PL, Chen XX, Zhou FF, Wang F: Overexpression of SGLT1 and EGFR in colorectal cancer showing a correlation with the prognosis, Medical oncology 2011, 28 Suppl 1:S197-203
15. Gorboulev V, Schurmann A, Vallon V, Kipp H, Jaschke A, Klessen D, Friedrich A, Scherneck S, Rieg T, Cunard R, Veyhl-Wichmann M, Srinivasan A, Balen D, Breljak D, Rexhepaj R, Parker HE, Gribble FM, Reimann F, Lang F, Wiese S, Sabolic I, Sendtner M, Koepsell H: Na(+)-D-glucose cotransporter SGLT1 is pivotal for intestinal glucose absorption and glucose-dependent incretin secretion, Diabetes 2012, 61:187-196
16. Schauer IG, Rowley DR: The functional role of reactive stroma in benign prostatic hyperplasia, Differentiation;
research in biological diversity 2011, 82:200-210
17. Tuxhorn JA, Ayala GE, Rowley DR: Reactive stroma in prostate cancer progression, J Urol 2001, 166:2472-2483 18. Liu Y: Fatty acid oxidation is a dominant bioenergetic pathway in prostate cancer, Prostate Cancer Prostatic Dis
2006, 9:230-234
19. Kim WT, Yun SJ, Choi YD, Kim GY, Moon SK, Choi YH, Kim IY, Kim WJ: Prostate size correlates with fasting blood glucose in non-diabetic benign prostatic hyperplasia patients with normal testosterone levels, J Korean Med Sci 26:1214-1218
20. Kasturi S, Russell S, McVary KT: Metabolic syndrome and lower urinary tract symptoms secondary to benign prostatic hyperplasia, Curr Urol Rep 2006, 7:288-292
21. Schoder H, Larson SM: Positron emission tomography for prostate, bladder, and renal cancer, Semin Nucl Med 2004, 34:274-292
22. DiPaola RS, Dvorzhinski D, Thalasila A, Garikapaty V, Doram D, May M, Bray K, Mathew R, Beaudoin B, Karp C, Stein M, Foran DJ, White E: Therapeutic starvation and autophagy in prostate cancer: a new paradigm for targeting metabolism in cancer therapy, Prostate 2008, 68:1743-1752
23. Ayala G, Tuxhorn JA, Wheeler TM, Frolov A, Scardino PT, Ohori M, Wheeler M, Spitler J, Rowley DR: Reactive stroma as a predictor of biochemical-free recurrence in prostate cancer, Clin Cancer Res 2003, 9:4792-4801 24. Tuxhorn JA, Ayala GE, Smith MJ, Smith VC, Dang TD, Rowley DR: Reactive stroma in human prostate cancer:
induction of myofibroblast phenotype and extracellular matrix remodeling, Clin Cancer Res 2002, 8:2912-2923 25. Avril N, Dambha F, Murray I, Shamash J, Powles T, Sahdev A: The clinical advances of fluorine-2-D-deoxyglucose--
positron emission tomography/computed tomography in urological cancers, Int J Urol 17:501-511
26. Yang W, Xia Y, Ji H, Zheng Y, Liang J, Huang W, Gao X, Aldape K, Lu Z: Nuclear PKM2 regulates beta-catenin transactivation upon EGFR activation, Nature 2011, 480:118-122
27. Maissel A, Marom M, Shtutman M, Shahaf G, Livneh E: PKCeta is localized in the Golgi, ER and nuclear envelope and translocates to the nuclear envelope upon PMA activation and serum-starvation: C1b domain and the pseudosubstrate containing fragment target PKCeta to the Golgi and the nuclear envelope, Cellular signalling 2006, 18:1127-1139
28. Wang SC, Lin JK, Wang HS, Yang SH, Li AF, Chang SC: Nuclear expression of CXCR4 is associated with advanced colorectal cancer, International journal of colorectal disease 2010, 25:1185-1191
29. Lin CY, Jeng YM, Chou HY, Hsu HC, Yuan RH, Chiang CP, Kuo MY: Nuclear localization of annexin A1 is a prognostic factor in oral squamous cell carcinoma, Journal of surgical oncology 2008, 97:544-550
30. Li C, Iida M, Dunn EF, Ghia AJ, Wheeler DL: Nuclear EGFR contributes to acquired resistance to cetuximab, Oncogene 2009, 28:3801-3813
31. Ibrahim GK, Kerns BJ, MacDonald JA, Ibrahim SN, Kinney RB, Humphrey PA, Robertson CN: Differential immunoreactivity of epidermal growth factor receptor in benign, dysplastic and malignant prostatic tissues, J Urol 1993, 149:170-173
32. De Miguel P, Royuela, Bethencourt R, Ruiz A, Fraile B, Paniagua R: Immunohistochemical comparative analysis of transforming growth factor alpha, epidermal growth factor, and epidermal growth factor receptor in normal, hyperplastic and neoplastic human prostates, Cytokine 1999, 11:722-727
33. Leav I, McNeal JE, Ziar J, Alroy J: The localization of transforming growth factor alpha and epidermal growth factor receptor in stromal and epithelial compartments of developing human prostate and hyperplastic, dysplastic, and carcinomatous lesions, Hum Pathol 1998, 29:668-675
34. Sherwood ER, Lee C: Epidermal growth factor-related peptides and the epidermal growth factor receptor in normal and malignant prostate, World J Urol 1995, 13:290-296
35. Weihua Z, Tsan R, Huang WC, Wu Q, Chiu CH, Fidler IJ, Hung MC: Survival of cancer cells is maintained by EGFR independent of its kinase activity, Cancer Cell 2008, 13:385-393
Figure legends
Figure 1. Characterization of the SGLT1-WB antibody by Western blot analysis. Detection of FLAG-
tagged SGTL1 transiently transfected into HEK293T cells in combination with control siRNA or SGLT1 siRNA, using (A) an anti-FLAG primary antibody or (B) SGLT1-WB. C, SGLT1 expression in PC3, PC3-MM2, DU145, and LNCaP cells. D, Detection of endogenous SGLT1 of PC3 cells transfected with control siRNA or SGLT1 siRNA, using SGLT1-WB. Actin was used as the loading control.
Figure 2. Characterization of the SGLT1-IHC antibody using HCT116 human colon cancer cells. A,
Western blot analysis of endogenous SGLT1 in cells transfected with control siRNA or SGLT1 siRNA using the SGLT1-WB antibody. Actin was used as the loading control. B, Immunocytochemical analysis of cells transfected with control siRNA or SGLT1 siRNA using SGLT1-IHC. Cells containing siRNA appear green (arrows) and the SGLT1 signal is red. Nuclei are stained blue with DAPI. C, Immunohistochemical analysis of a human normal intestine sample using SGLT1-IHC with or without blocking peptides (1 mg/mL).
Figure 3. Expression of SGLT1 in normal prostate tissue. Immunohistochemical stained SGLT1- positive cells appear brown. Right panel is magnification of boxed area in left panel. Bar=50µm.
Figure 4. Expression of SGLT1 in BPH tissue. (A-D). SGLT1-positive cells are indicated by arrows
(basal cells) and arrowheads (stromal cells). Right panels are magnification of boxed areas in left panels. Bar=50µm.
Figure 5. Expression of SGLT1 in PIN tissue. (A-D). SGLT1-positive cells appear brown. Right panels are magnification of boxed areas in left panels. Bar=50µm.Figure 6. Expression of SGLT1 in PCa tissue representing different grades (Gleason scores). (A-I), SGLT1-positive cells appear brown.
Arrows in G indicate SGLT1-positive nuclear envelopes. Right panels are magnification of boxed areas in left panels. Bar=50µm.
Figure 7. SGLT1-positive stromal cells are negative for tenascin. Immunofluorescent co-staining of
SGLT1 (green) and tenascin (red) on tissue samples of BPH (left) and PCa (right). Nuclei were stained by DAPI (blue). Co-expression of SGLT1 and tenascin would have appeared yellow.
Bar=50µm.
Table 1. Expression level of SGLT1 in prostate tissue by cell type*
Tissue No. of sample s
Cell type Luminal epithelia l
Basal SGLT1-postive stromal cells (%) **
Norma l
3 + + Stromal cells are negative
BPH 53 + and - +++ 62.4± 31.7
PIN 9 ++ ++ NA
PCa 44 +++ NA 3.2±4.3
*, The semi-quantification was carried out by two individuals in a blinded manner using the same normal prostate tissue as a standard reference. The signal density of normal prostate epithelial cells is considered as “+”, and the signal density of the basal cells of BPH is considered as “+++”.
**, SGLT1-positive cells and total stromal cells were counted from 3 random selected areas under 200x magnification, and the percentage of SGLT1-positive cells is calculated by the number of SGLT1-positive cells / total stromal cells. The values are presented as mean±SD.
NA: not applicable