Chung-Ray Chu Ching-Jer Huang Tsung-Mo Tien
Department of Hydraulic and Ocean Engineering National Cheng Kung University
Taiwan.
January 14, 2022
A novel fiber optic sensing system for monitoring debris flows
The Second World Landslide Forum
Rome, Italy
The Second World Landslide Forum The Second World Landslide Forum Rome, ItalyRome, Italy
• Introduction
• Fiber-optic sensor
• Fiber-optic sensing system for debris flow
• Calibration experiment
• Conclusion
Outline
The Second World Landslide Forum The Second World Landslide Forum Rome, ItalyRome, Italy
Introduction
• Debris flow is one of the most hazardous nature process in Taiwan.
• Debris flow has the following characteristics (Takahashi, 1991):
– The forefront looks like a bore and accumulates the largest rocks.
– The flow following the forefront appears as a mudflow with a gradually decreasing discharge.
– The flow is accompanied by loud noise and ground vibration.
• The debris flow warning systems can be divided into two categories (Arattano and Marchi 2008):
– Advance warning system (e.g. rainfall).
– Event warning system (e.g. ground vibration sensing), with short evacuating time but precise alarm.
• Conventionally, geophones or seismometers are often utilized to detect the ground vibrations produced by debris flows. However, the electrical power supply and signal attenuation are the challenges in remote mountainous region.
• The technique of fiber optic sensing is appropriate for remote sensing purpose, because of its very low optical loss, high sensitivity, and immunity to electromagnetic interference.
3
The Second World Landslide Forum The Second World Landslide Forum Rome, ItalyRome, Italy
Fiber-optic sensor
• The advantages of fiber-optic sensor
– Low optical loss – Multiplexibility – High sensitivity
– Immunity to electromagnetic interference
• Sense various physical signals
– Strain
– Temperature – Pressure
– Acceleration
The Second World Landslide Forum The Second World Landslide Forum Rome, ItalyRome, Italy
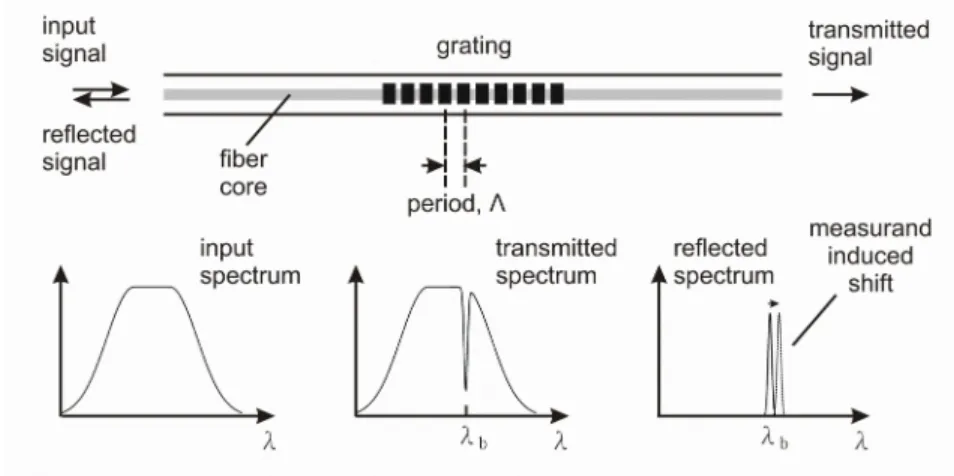
• The shift of Bragg wavelength due to strain and temperature changes is given by (Kersey et al. 1977)
• In respect to measurand of ground vibrations, thermal effects are relative to very-low frequency component and could be igmored.
Fiber-optic sensor
• Fiber Bragg Grating (FBG) sensor
• Photosensitive effect (Hill et al. 1978):
intense UV light can cause permanent change in refractive index of optic fiber.
• Broadband light incident in the grating, and a narrowband component reflected back. (Kersey 1977)
5
B 2n
2
12 11 12
2 1
2
dTdn B
n n P P P T
n
B e B
P
Figure 1 Basic Bragg grating-sensing mechanism Figure 1 Basic Bragg grating-sensing mechanism
The Second World Landslide Forum The Second World Landslide Forum Rome, ItalyRome, Italy
Fiber-optic sensor
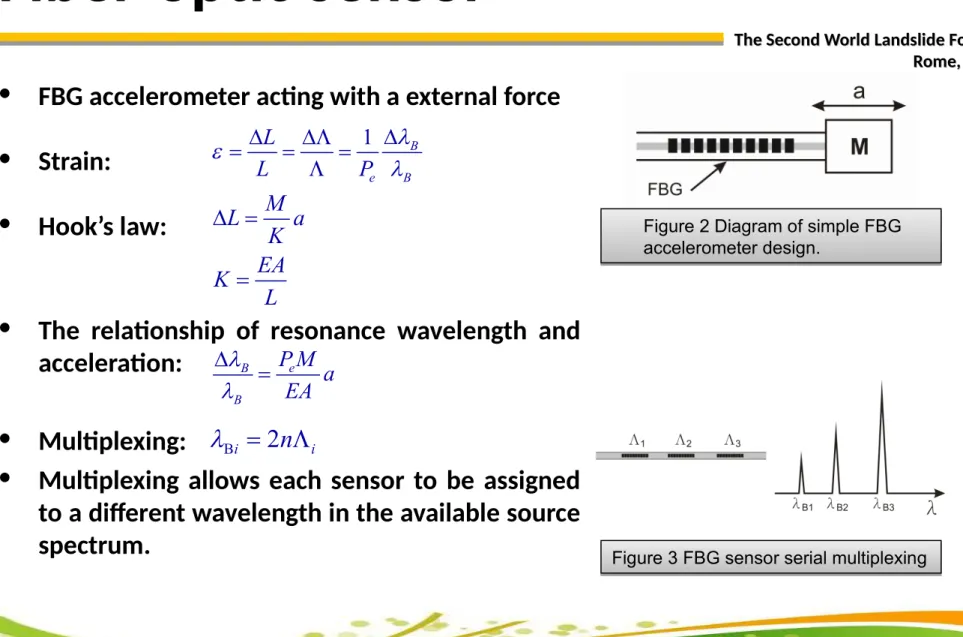
• FBG accelerometer acting with a external force
• Strain:
• Hook’s law:
• The relationship of resonance wavelength and acceleration:
• Multiplexing:
• Multiplexing allows each sensor to be assigned to a different wavelength in the available source
spectrum. Figure 3 FBG sensor serial multiplexingFigure 3 FBG sensor serial multiplexing Figure 2 Diagram of simple FBG accelerometer design.
Figure 2 Diagram of simple FBG accelerometer design.
1 B
e B
L
L P
L M a
K K EA
L
e B B
P M a EA
Bi 2n i
The Second World Landslide Forum The Second World Landslide Forum Rome, ItalyRome, Italy
Fiber-optic sensing system for debris flow
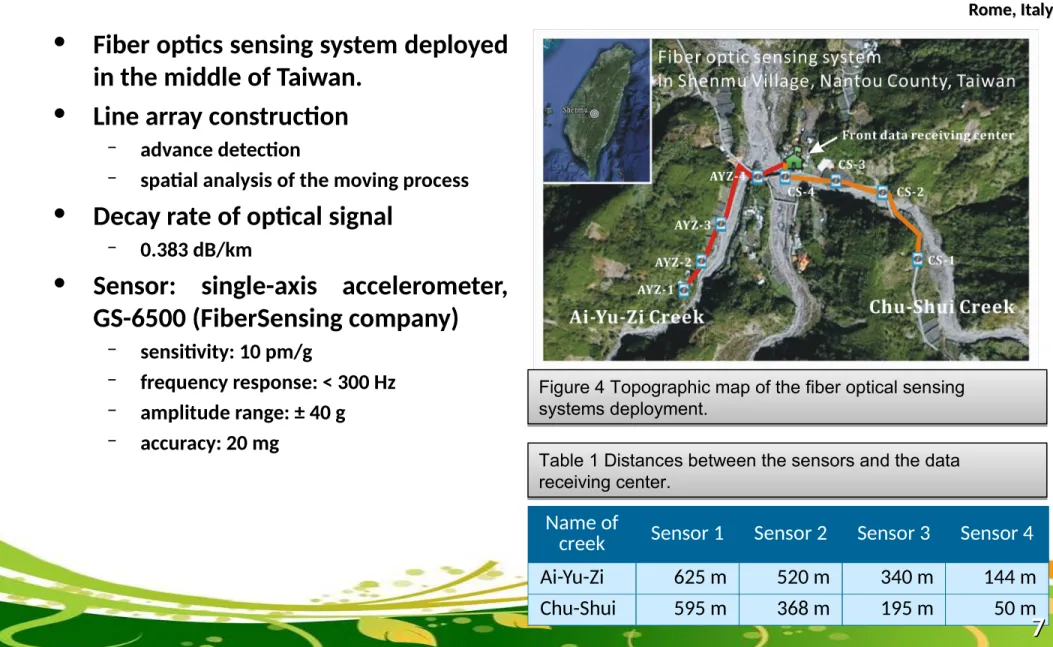
Name of
creek Sensor 1 Sensor 2 Sensor 3 Sensor 4
Ai-Yu-Zi 625 m 520 m 340 m 144 m
Chu-Shui 595 m 368 m 195 m 50 m
7
Figure 4 Topographic map of the fiber optical sensing systems deployment.
Figure 4 Topographic map of the fiber optical sensing systems deployment.
Table 1 Distances between the sensors and the data receiving center.
Table 1 Distances between the sensors and the data receiving center.
• Fiber optics sensing system deployed in the middle of Taiwan.
• Line array construction
– advance detection
– spatial analysis of the moving process
• Decay rate of optical signal
– 0.383 dB/km
• Sensor: single-axis accelerometer, GS-6500 (FiberSensing company)
– sensitivity: 10 pm/g
– frequency response: < 300 Hz – amplitude range: ± 40 g – accuracy: 20 mg
The Second World Landslide Forum The Second World Landslide Forum Rome, ItalyRome, Italy
Calibration experiment
(a)
0 1 2 3 4 5 6 7 8
x 104 -0.4
-0.2 0 0.2 0.4
Time (ms) acceleration (m/s2 )
CH1 27-Aug-2010 09:53:24
0 50 100 150 200 250
0 0.0005 0.001 0.0015 0.002
Frequency (Hz)
Spectrum
CH1 27-Aug-2010 09:53:24
(c)
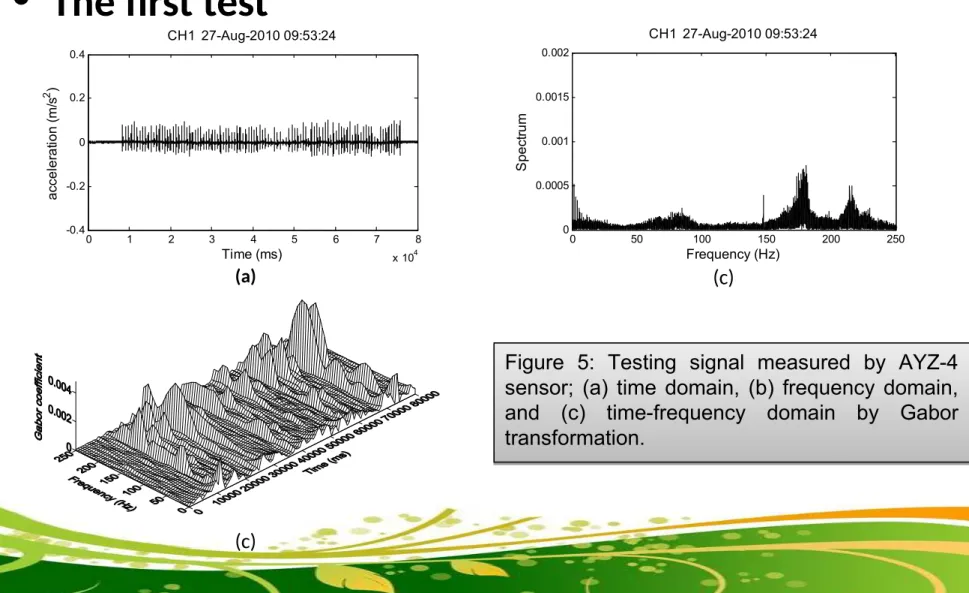
Figure 5: Testing signal measured by AYZ-4 sensor; (a) time domain, (b) frequency domain, and (c) time-frequency domain by Gabor transformation.
Figure 5: Testing signal measured by AYZ-4 sensor; (a) time domain, (b) frequency domain, and (c) time-frequency domain by Gabor transformation.
• The first test
The Second World Landslide Forum The Second World Landslide Forum Rome, ItalyRome, Italy
Calibration experiment
(a)
9
(b)
(c)
Figure 8 Vertical ground vibration measured by the Z- axis component of geophone versus vertical acceleration of ground vibration measured by the FBG accelerometer. The signals were recorded for 30 s, and well aligned to the first impact pulse. (a) Vertical velocity of ground vibration in time domain, and (b) in frequency domain. (c) Vertical acceleration of ground vibration in time domain, and (d) in frequency domain.
Figure 8 Vertical ground vibration measured by the Z- axis component of geophone versus vertical acceleration of ground vibration measured by the FBG accelerometer. The signals were recorded for 30 s, and well aligned to the first impact pulse. (a) Vertical velocity of ground vibration in time domain, and (b) in frequency domain. (c) Vertical acceleration of ground vibration in time domain, and (d) in frequency domain.
0 5000 10000 15000 20000 25000 30000
-8 -6 -4 -2 0 2 4 6 8
Time (ms)
Velocity (cm/s)
0 50 100 150 200 250
0 0.0005 0.001 0.0015
Frequency (Hz) PSD ((cm/s)2/Hz)
0 5000 10000 15000 20000 25000 30000
-4 -3 -2 -1 0 1 2 3 4
Time (ms) Acceleration (m/s2)
0 50 100 150 200 250
0 0.0001 0.0002 0.0003 0.0004 0.0005
Frequency (Hz) PSD ((m/s2)2/Hz)
(d) Figure 6 Sketch of calibration experiment
setup.
Figure 6 Sketch of calibration experiment setup.
Figure 7 Picture of experimental site.
Figure 7 Picture of experimental site.
The Second World Landslide Forum The Second World Landslide Forum Rome, ItalyRome, Italy
Calibration experiment
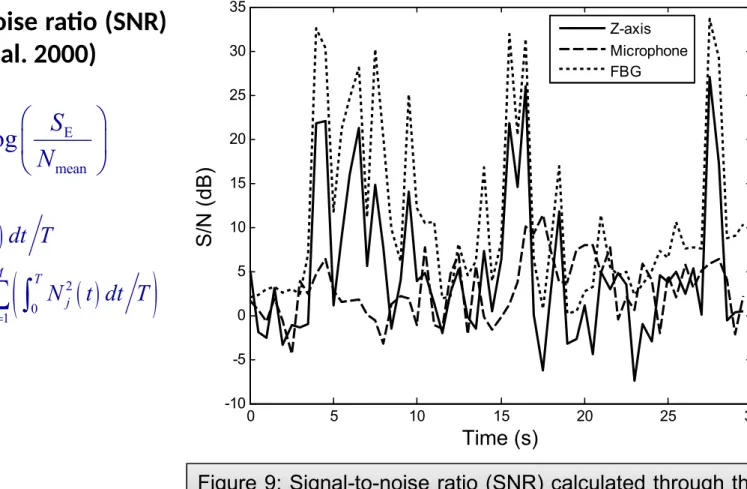
Figure 9: Signal-to-noise ratio (SNR) calculated through the Figure 9: Signal-to-noise ratio (SNR) calculated through the
0 5 10 15 20 25 30
-10 -5 0 5 10 15 20 25 30 35
Time (s)
S/N (dB)
Z-axis Microphone FBG
• Signal-to-noise ratio (SNR) (Itakura et. al. 2000)
E mean
SNR 10log S N
2
E 0
2
mean 0
1
1
T
M T
j j
S S t dt T
N N t dt T
M
The Second World Landslide Forum The Second World Landslide Forum Rome, ItalyRome, Italy
Conclusion
• This study presents a novel fiber optic sensing system for monitoring debris flows. Two sensing systems were deployed along the Ai-Yu-Zi Creek and the Chu- Shui Creek in Nantou County, Taiwan with Fiber Bragg Grating (FBG) accelerometers for monitoring debris flows. In each system four accelerometers were installed in the bank of the creek as line arrays.
• A calibration experiment was carried out to compare the performance of FBG accelerometer with other sensors, such as geophone and microphone. The result showed that the SNR of FBG accelerometer was higher than geophone;
moreover, was much higher than microphone. The different performance was born of the sensitivities of the used sensors, and the material where the signals propagated.
• Even though the sensing capability of FBG accelerometer seems better than geophone, the temperature effect and other ambient noise should be considered. Low frequency contribution would be involved from the temperature changes. Ambient noises would be sensed from traffic, water flow, or other tremors. These effects will cause the false alarm of detecting and warning system.
11
The Second World Landslide Forum The Second World Landslide Forum Rome, ItalyRome, Italy
Reference
• Arattano M, (2003) Monitoring the presence of the debris-flow front and its velocity through ground vibration detectors.
In: Debris-Flow Hazards Mitigation: Mechanics, Prediction, and Assessment, Proceedings of the Third International Conference on Debris-Flow Hazards Mitigation, Davos, Switzerland, Rotterdam, Netherlands, September 10–12 2003.
Millpress, pp 719-730
• Arattano M, Marchi L, (2008) Systems and sensors for debris-flow monitoring and warning. Sensors 8 (4):2436-2452
• Berti M, Genevois R, LaHusen R, Simoni A, Tecca PR, (2000) Debris flow monitoring in the Acquabona watershed on the Dolomites (Italian Alps). Physics and Chemistry of the Earth Part B-Hydrology Oceans and Atmosphere 25 (9):707-715
• Burtin A, Bollinger L, Cattin R, Vergne J, Nabelek JL, (2009) Spatiotemporal sequence of Himalayan debris flow from analysis of high-frequency seismic noise. Journal of Geophysical Research-Earth Surface 114. doi:F04009 10.1029/2008jf001198
• Hill KO, Fujii Y, Johnson DC, Kawasaki BS, (1978) Photosensitivity in Optical Fiber Waveguides - Application to Reflection Filter Fabrication. Appl Phys Lett 32 (10):647-649
• Huang C-J, Yin H-Y, Chen C-Y, Yeh C-H, Wang C-L, (2007) Ground vibrations produced by rock motions and debris flows. J Geophys Res 112:F02014
• Itakura Y, Fujii N, Sawada T, (2000) Basic characteristics of ground vibration sensors for the detection of debris flow. Phys Chem Earth (B) 25 (9):717-720
• Itakura Y, Inaba H, Sawada T, (2005) A debris-flow monitoring devices and methods bibliography. Natural Hazards and Earth System Sciences 5 (6):971-977
• Itakura Y, Koga Y, Takahama JI, Nowa Y, (1997) Acoustic detection sensor for debris flow, in Debris-Flow Hazards Mitigation: Mechanics, Prediction, and Assessment. In: Proceedings of the First International Conference, N. Y., 1997. Am.
Soc. of Civ. Eng., pp 747-756
•
The Second World Landslide Forum The Second World Landslide Forum Rome, ItalyRome, Italy
Reference
• Johnson AM, Rodine JR, (1984) Debris flows. In: Brunsden D, Prior DB (eds) Slope Instability. John Wiley & Sons. Ltd., pp 257-361
• Kersey AD, (1997) Multiplexing Techniques for Fiber-Optic Sensors. In: Dakin J, Culshaw B (eds) Optical Fiber Sensors:
Applications, Analysis, and Future Trends, vol IV. pp 369-407
• Kersey AD, Davis MA, Patrick HJ, LeBlanc M, Koo KP, Askins CG, Putnam MA, Friebele EJ, (1997) Fiber grating sensors. J Lightwave Technol 15 (8):1442-1463
• Lavigne F, Thouret JC, Voight B, Young K, LaHusen R, Marso J, Suwa H, Sumaryono A, Sayudi DS, Dejean M, (2000) Instrumental lahar monitoring at Merapi Volcano, Central Java, Indonesia. Journal of Volcanology and Geothermal Research 100 (1-4):457-478
• Lin CH, Kumagai H, Ando M, Shin TC, (2010) Detection of landslides and submarine slumps using broadband seismic networks. Geophysical Research Letters 37. doi:10.1029/2010GL044685
• Massimo A, (2000) On debris flow front evolution along a rorrent. Phys Chem Earth (B) 25 (9):733-740
• Okuda S, Okunishi K, Suwa H, (1980) Observation of debris flow at Kamikamihori Valley of Mt. Yakedade. In: the 3rd meeting of IGU commission on field experiment in geomorphology, Disaster Prev. Res. Inst. Kyoto Univ., Japan, 1980. pp 127-130
• Takahashi T, (1991) Debris Flow. A A Balkema,
13
The Second World Landslide Forum The Second World Landslide Forum Rome, ItalyRome, Italy