doi:10.6342/NTU201700804
國立台灣大學電機資訊學院生醫電子與資訊學研究所 博士論文
Graduate Institute of Bio-informatics and Bioelectronics, College of Electrical Engineering and Computer Science
National Taiwan University Doctoral dissertation
智慧電漿子實驗室晶片系統之核酸感測研發
Smart Plasmonic Lab-on-a-Chip System for DNA based Biosensing
吳子珩 Tzu-Heng WU
指導教授:林啟萬 博士/林致廷 博士/歐赫里昂 布雍 博士 Advisor: Chii-Wann LIN ,PhD/ Chih-Ting LIN ,PhD /Aurélien
BRUYANT ,PhD
中華民國 106 年 3 月 March 2017
doi:10.6342/NTU201700804
i
Acknowledgement
Well, can’t believe that this is the moment. After all the excitement, frustration and hard works, here we are, a guy tapping along in front of his computer, thinking back about this bitter sweet journey, like countless of other traveler before him.
My shear gratefulness is not only upon the completion of the thesis, that is just the final product of the work. I am glad for all those amazing explorations that we have made during the process. To begin with, I thank prof. Chii-Wann LIN and prof. Aurelien BRUYANT for support me in every single aspect to pursuit for a joint PhD. Until today, I still feel excited about this precious chance to learn how to foster international collaboration, to travel between two great institutes where different idea meets and to listen to amazing perspectives. None of this would have come true, if it were not you, my two mentors, who have the experience and wisdom to build up the first NTU-UTT joint PhD case. I am glad that we have published enough of works that draw more chance of funding and resources, that , I sincerely hope, will open up more channel for other PhD students to have the same opportunity to start their adventures. Again, I attribute the glory to my wonderful advisers.
I thank all my lab mates and “helpers”, in France and in Taiwan, 陳盈秀、
王姿懿、陳一銘、王超、范樂陶、許偉恩、楊景旭、林威佐、任恩、呂 彗歆博士、魏世忠博士、張家禎博士、莊崇亮博士、尤濬博士、Yi Haung、
julien Vaillant、彭瑛、Mme. Pascal Denis、Dr. Abeer Mohtar、李后珊、
沈庭瑤、Mandy Lee、prof. Gilles Lerondel, you made my PhD student life a wonder and enjoyable one. Thanks for your help in solving administrative work, for providing insightful discussions, for helping me on connection, for sample preparation, for helping of opto-electronics and DNA sequence design and for all your supports.
I thanks my family and my wife for their understanding and encourage.
There are just too many people that I owe you my sincere thanks and
gratitude, but don’t worry finding your name here, you have my thank deep
in my hearts.
doi:10.6342/NTU201700804
ii
摘要
近年來,人口快速增長伴隨著社會老齡化,為醫療照護系統帶來日漸沉重之負擔。
因應此社會現象,居家定點照護成為許多學術研究以及新創產業的熱門方向。透過 適當的設計,結合消費性電子元件強大的軟硬體,以往僅能在實驗室運作的生物感 測器將可以被引入居家生活中提供即時而精確的醫療診斷。
本論文旨在探索如何運用智慧型手機作為整合之核心平台,建構可攜式表面電 漿共振生物感測器實驗室晶片系統。於論文第一部分,利用單股核糖核相對於雙股 核糖核酸更能夠有效地避免鹽類誘發之金奈米粒子聚集特性,我們於智慧型手機 上建構了一個核糖核酸檢測裝置。在此一平台,智慧型手機扮演了幾個重要的角色。
首先,透過 3.5 釐米音訊孔與自製電路之整合,智慧型手機可以驅動 650 奈米之射 源,並透過輸入電極接收雷射光訊號,來進行金奈米粒子吸收度量測。透過軟體鎖 相放大器來解調射源之震盪訊號,百分之八十以上的環境雜訊可以被排除,使該平 台成為一個具有-63 dB 優良訊躁比的顯色儀。最後,所有資訊可以直接在自製之應 用程式上被顯示、分析,不需要任何額外裝置。透過我們提出的平台,我們能夠在 智慧型手機上,於十五分鐘內解析最低 0.77 nM 的核糖核酸樣品,甚至優於某些商 用桌面型可見光-紫外光光譜儀在單一波長的解析極限。
接續第一部分的實驗,我們提出了一種全新的相位式表面電漿共振生物感測器。
許多文獻指出,相位式表面電漿感測器比強度式更加的靈敏(約 100 倍)。然而,因 為需要相位震盪器、易受到同徑雜訊影響以及需要過多光學組件等諸多議題的限 制,相位式表面電漿感測器之商業化應用至今仍未成功,遑論手持式應用。然而,
相位式表面電漿感測器的額外靈敏度,在定點照護中具有相當重要的價值。為此,
本論文提出了剪干涉式表面電漿共振生物感測器。剪干涉式表面電漿共振生物感 測器,具最小化同徑干擾效應、減少光學零組件需求、以及透過電流調變作為相位 調等優點。為了處理強度與相位同頻率震盪的干涉訊號,本論文提出一種新的相位
擷取方式。此方法,改良自泛用式鎖向放大器,可以在相位震盪深度
(Δϕ
a)
為 3.83且已知雷射波長-電流調變係數(S)等特殊條件下,解調出相位資訊。在電漿層膜厚
為 47 奈米的情況下,剪干涉式表面電漿共振生物感測器可以達到 1.26x10⁻⁶ RIU 之
最低解析度,約比強度式靈敏 20 倍。透過適體修飾以及心肌蛋白之檢測,本論文 也初步展示剪干涉式表面電漿共振生物感測器之應用潛力,並提出一套結合嵌入 式系統以及消費性電子元件之應用架構。
關鍵字:表面電漿共振生物感測器、消費型電子元件、鎖相放大、相位檢測、實驗 室晶片系統、核糖核酸
doi:10.6342/NTU201700804
iii
Abstract
This thesis is dedicated to integrate consumer electronics devices (CED) with advanced plasmonic sensors into Lab-On-a-Chip system for point-of- care application, with a main focus on design of compact plasmonic sensor.
In the first part of the thesis, a short strand DNA biosensor combining single-wavelength colorimetry and digital Lock-in Amplifier within a smartphone is proposed. The principle of the detection is that single strand DNA tends to protect gold nano-particle from salt induced aggregation, as compare to double strand DNA. The salt induced aggregation is then detected from absorbance at 650 nm wavelength. Using 3.5 mm audio channel to integrate laser driver and photo-detector, together with a tailor- made software lock-in amplifier (sLIA), we have achieved a 15 mer DNA detection down to 0.77 nM within 15 minutes on smartphone. Due to sLIA, the measurement noise-to-signal ratio is greatly reduce to -63 dB, which lead to four times smaller limit-of-detection as compared to a desktop UV-Vis spectrometer.
Encouraged by the results of the first part, we proceed to explore the possibility of smartphone based interferometric plasmonic sensor.
Conventionally, phase sensitive Surface Plasmon Resonance (SPR) biosensor is not viable outside laboratory setting due to cost and performance consideration. Therefore, to pursue portable SPR application with high sensitivity, in the second part of the thesis, a Shearing Interferometer based Surface Plasmon Resonance (SiSPR) biosensor, which has not been reported elsewhere, is proposed. The SiSPR chip uses shearing interferometer without the need of extra optical parts. This design together with differential interferometry greatly reduce noises. To avoid the use of costly phase modulator, a current induced sinusoidal wavelength modulation is applied with a novel phase extraction method. We demonstrate that the detection limit of the SiSPR, at 47 nm of plasmonic layer thickness is down to 1.26x10
-6
RIU, about 20 times better than amplitude sensing. From our data, we estimate that SiSPR can be more sensitive if film thickness is near 49 nm.
We have also demonstrated preliminary results on protein sensing using aptameric probe. The further integration of SiSPR with CED and future perspectives are incorporated in the end of the thesis.
Key words: Lab-On-a-Chip, DNA aptamer, Consumer Electronic Device,
Surface Plasmon Resonance, Lock-In, Phase detection
doi:10.6342/NTU201700804
Table of Content
Acknowledgement ...i
摘要 ... ii
Abstract ... iii
Chapter 1. General introduction ... 1
Part 1. DNA biosensor combining single-wavelength colorimetry and digital Lock-in Amplifier within a Smartphone ... 8
Chapter 2. Introduction to smartphone based colorimetry ... 9
Chapter 3. Literature review on smartphone based diagnostic tool ... 12
Chapter 4. Material and methods ... 18
Section 4-1. Theoretical background of Lock-in Amplifier ... 18
Section 4-2. Digital LIA algorithm ... 19
Section 4-3. SBLIA-AuNP colorimetry system ... 20
Section 4-4. AuNP preparation ... 22
Section 4-5. Sample preparation for target DNA detection ... 23
Section 4-6. Converting SBLIA-AuNP colorimetry measurement data into absorbance unit (AU) for comparison ... 24
Chapter 5. Results and Discussion ... 26
Section 5-1. Characterizing audio channel ... 26
Section 5-2. SBLIA performance and working parameters ... 28
Section 5-3. Comparison between SBLIA approach and SCB ... 30
Section 5-4. DNA sensing by SBLIA-AuNP colorimetry ... 31
Section 5-5. Conclusion ... 36
Part 2. “Shearing Interferometer based ... 38
Surface Plasmon Resonance Biosensor (SiSPR)” ... 38
Chapter 6. Introduction on SiSPR ... 39
Chapter 7. Literature Review on phase interrogated SPR ... 46
Chapter 8. Methodology ... 57
Section 8-1. Working principle of SiSPR ... 57
Section 8-2. Wavefront analysis on SiSPR ... 59
Section 8-3. SiSPR interferogram and phase retrieval method ... 64
Section 8-3-1. SPM interferogram without AM ... 66
Section 8-3-2. Phase extraction in SPM interferogram with AM ... 70
Section 8-4. SiSPR Laboratory prototype ... 75
Section 8-5. Fabrication of SiSPR chip ... 77
Chapter 9. Results and discussion ... 83
Section 9-1. Numerical Simulation ... 83
Section 9-2. Determining “S” of VSCEL and “∆𝝓𝒂” of the SPM ... 85
doi:10.6342/NTU201700804
Section 9-3. Imaging of beam profile of SiSPR ... 89
Section 9-4. SiSPR sensing performance: ... 92
Section 9-5. Preliminary bio-sensing Data ... 102
Section 9-6. Summary and conclusion on SiSPR ... 108
Chapter 10 General conclusion and future perspectives ... 111
Appendix ... 116
Section A1. List of mathematical relations ... 117
Section A2. Detail in phase extraction... 118
Section A3. Matlab code for simulation of SPR performances ... 121
Section A4. Design of the SiSPR portable prototype ... 126
Section A4. GLIA algorithm on Arduino ... 127
Section A5. Android algorithm ... 129
Appendix A6.Scientific production on the project ... 133
Appendix A7.Extended French Abstract ... 135
References ... 164
Table of Content of Figures
Fig. 1 Overview of smartphone I/O capacity ... 2Fig. 2 Samsung Note 2 front LED panel emission spectrum ... 3
Fig. 3 Power hijacking from audio jack. ... 12
Fig. 4 Audio jack based ECG measurement device from Ann Harbor University1 . ... 13
Fig. 5 Smartphone based Karposi’s Sarcoma herpesvirus detection4. ... 14
Fig. 6 Smartphone based AuNp colorimetry biosensor for monitoring water pollution3 ... 14
Fig. 7 fiber based SPR biosensor coupled to smartphone. ... 16
Fig. 8 Probing IgG on smartphone based fiber SPR. ... 16
Fig. 9 Portable LSPR sensor integrated system2. ... 17
Fig. 10 Digital Lock-In Amplifier Algorithm. ... 20
Fig. 11 SBLIA-AuNP colorimetry system overview. ... 22
Fig. 12 typical DNA sensorgram of sLIA “smart” biosensor. ... 25
Fig. 13 Evaluating the audio output channel as SBLIA function generator... 27
Fig. 14 Noise level and effect of working parameters on the developed SBLIA system. ... 30
Fig. 15 SBLIA-AuNP colorimetry DNA sensing... 34
Fig. 16 phase signal extracted with SBLIA. ... 35
Fig. 17 SPR optical set-up based on Kretschmann Configuration. ... 40
Fig. 18 An overview of SiSPR optical set-up. ... 42
doi:10.6342/NTU201700804
Fig. 19 Homodyne interferometers: (a) Mach Zehnder and (b) Michelson. .. 47
Fig. 20. Differential spectral phase sensitive SPR from Siu-Pang Ng et. al. . 48
Fig. 21. Phase interrogation result on sodium chloride solution from Siu-Pang Ng et. al. ... 48
Fig. 22 SPR resonance dip and corresponding phase jump. ... 51
Fig. 23 Heterodyne detector (a) optical set-up (b) corresponding interferogram. ... 53
Fig. 24 Polarimetry interferometer. ... 54
Fig. 25 Monolithic phase sensitive sensor chip from US. Pat. No. 0218738A1. ... 56
Fig. 26 Major optical component and beam 1 of SiSPR comprising a bi- reflective layer (metal coating on each side). ... 58
Fig. 27 Different beam portions within the SiSPR. ... 58
Fig. 28 Wave-front division and OPD calculation in SiSPR. ... 59
Fig. 29 Angle dependence of OPD in SiSPR. ... 61
Fig. 30 Glass slide based shearing interferometer ... 62
Fig. 31 Angle dependence of OPD in glass slide based shearing interferometer. ... 64
Fig. 32 The SPM interferogram for several phase modulation depths (a)𝛥𝜙𝑎=2 rad, (b)𝛥𝜙𝑎=4 rad, (c) 𝛥𝜙𝑎=6 rad. ... 70
Fig. 33 SiSPR laboratory prototype. ... 76
Fig. 34 SiSPR chip with microfluidic system ... 77
Fig. 35 SiSPR substrate glass selection system. ... 79
Fig. 36 The simulation of SPR reflective dip with different film thickness. . 81
Fig. 37 The simulation of SiSPR phase response with different film thickness. ... 81
Fig. 38 Simulation signal of SPM intergerogram with AM. ... 84
Fig. 39 Simulation of ϕSPR retrieval. ... 85
Fig. 40. Laser intensity normalized LPM interferogram. ... 87
Fig. 41 Fitted 𝛥𝜙/𝛥𝑖 for evaluation of S value... 88
Fig. 42 optical set-up for imaging of the SiSPR beam cross section profile . 89 Fig. 43 image of SiSPR fringe and beam cross sectional profile. ... 90
Fig. 44 SiSPR signal when device is under pure water. ... 91
Fig. 45 Image of SiSPR signal with different thickenss of reflective layer. .. 91
Fig. 46 Interferogram from p-polarization and s-polarization of SiSPR signal. ... 93
Fig. 47 Phase and Amplitude response of SiSPR chip with 44 nm of plasmonic layer ... 94 Fig. 48 Phase and Amplitude response of SiSPR chip with 47 nm of
doi:10.6342/NTU201700804
plasmonic layer ... 94
Fig. 49 P-S phase response vs refractive index ... 96
Fig. 50 Simulation on SiSPR phase response upon different refractive index. ... 98
Fig. 51 SiSPR P/S amplitude response vs refractive index. ... 99
Fig. 52 P-S phasogram and P polarized phasogram in detection of different glucose solution. ... 101
Fig. 53 Tro4 Aptamer surface modification ... 104
Fig. 54 SiSPR cTnI detection ... 108
Fig. 55 (a) CVD system for deposition of polymer (b) DMD pattern control (c) preliminary exposure system. ... 114
Fig. 56 SiSPR portable prototype and system structure ... 126
Fig. 57 Android-arduino encoding of data ... 130
Fig. 58 SiSPR interferogram from portable prototypes. ... 132
doi:10.6342/NTU201700804
1
Chapter 1. General introduction
The past ten years have seen two major socio-economic factors affecting the research field of handheld sensors, notably for health-related applications. The first factor is related to the continuous increase of the world population, which is reaching 7.5 billion this year.
If we look at the population structure across the developed countries, we find that around 12~20% of the population is over 65 years. The ageing and the growth of such a large population has fundamental consequences on the entire society, especially on medical care delivery system. According to statistical data from Organization for Economic Co- Operation and Development (OECD)5, in France, the maintenance of socio-health care system takes up nearly 11% of the annual Growth Domestic Product (GDP), which corresponds to about 230 billion of euros per yeara. In Taiwan, also the health sector takes up around 6.6 % of the GDP annually. In other words, a tremendous burden is now placed on our health care delivery systems due to the ever-growing population as well as longer life expectancy.
The second major and obvious trend is the booming of consumer electronic device market such as smart phones, feature phones and tablets. Around 70% of the world population owns at least one mobile devices. These devices are undoubtedly the most
a Considering that France has a GDP of 2133 billion in 2016.
doi:10.6342/NTU201700804
2
ubiquitous and powerful devices ever for integrating Point-Of-Care (POC) sensors.
Smartphones are already equipped with a number of integrated sensors and now offer a large processing power, but they also possess sufficient inputs and outputs for a wired or
wireless control of external sensors and data acquisition. For example, the smartphone audio jack (cf. Fig. 1), with proper electronic integration, serves as a 16 bits analog/digital converter (1 input, 2 outputs) - which is comparable to a number of performant acquisition cards – to extract and process data from sensors. In addition, the audio jack has synchronized data capture time resolution down to 26 µs per point, which is sufficient, in principle, to perform higher end fluorescence time measurements (such as FLINb), or to
b FLIN : Fluorescence-lifetime imaging microscopy Audio phone jack
Add-on Camera Wifi/internet:
Universal Serial Bus
Embedded system(s) Screen and Back LED
power Data
Fig. 1 Overview of smartphone I/O capacity
doi:10.6342/NTU201700804
3
extract amplitude and phase of signals modulated at relatively high frequency. To date, the audio jack channel has notably been used in Electrocardiogram (ECG) and pulse oximetry type of measurement6. For optical detection systems, we should also mention that smart devices often come with optical sources in the back of the phone (white LED for photo), as well as the front LED screen. Interestingly, the front LED may serve as light source having three emission wavelengths as shown in Fig. 2.
In some works, the light emitted from smart devices was used to carry our Surface Plasmon Resonance (SPR) detection7, which is one of the preferred method for bio- sensing. As for the optical detection side, the built-in smartphone CMOSc camera can also
c CMOS : Complementary metal–oxide–semiconductor. The CMOS sensor is now more common than the CCD camera in consumer electronic devices.
Fig. 2 Samsung Note 2 front LED panel emission spectrum
The spectrum is measured via a commercial UV-Vis spectrometer in National Taiwan University. The Samsung Galaxy note 2 is arbitrarily choose for demonstration.
doi:10.6342/NTU201700804
4
be used as a point detector for optical powermeter measurement4, 8, 9.
Finally, regarding connectivity, we should note that smartphones provide seamless connection to other embedded system through USB-OTGd or wireless access. Except for high power devices, the connection can also provide a stable power supply to small diagnostic devices.
Therefore, with a more and more equipped population facing health issues, the concept of m-healthe is emerging as a disrupting health care approach. The generalized use of smartphone as a smart platform for Point-Of-Care (POC) technology could certainly alleviate part of the healthcare costs and increase global disease prevention.
With POC diagnostic tools integrated in smartphone, a large portion of the population across the world and developing countries could benefit of a new, decentralized, medical access, in contrast with conventional health care delivery model. As a result, the cost of transporting medical resource to hospital and number of medical personnel can be reduced. This scenario is supported by reports from public sector. For example, the US Food and Drug administration recently mentioned in Mobile Medical Applications (2015):
~“The Food and Drug Administration (FDA) recognizes the extensive variety of actual and potential functions of mobile apps, the rapid pace of innovation in mobile apps,
d USB-OTG : USB On-The-Go. This common term specifies that the USB device performs both master or slave roles in establishing a communication link with another USB device via specific protocols.
e m-health stands for “mobile health” and typically refers to diagnostics or intervention done through smartphones or equivalent devices. The term e-health (electronic-health) is more generic.
doi:10.6342/NTU201700804
5
and the potential benefits and risks to public health represented by these apps.”
We have also seen World Health Organization stating that 10:
~“Mobile technologies have the potential to bridge systemic gaps needed to improve access to and use of health service, particularly among underserved populations.”
Beyond public sector, we have also been observing a fast growth in the m-health market11 with the emergence of new products.
To sum up, diagnostic tools traditionally centralized in laboratories and hospitals have the opportunity to be integrated onto mobile Consumer Electronic Devices (CEDs) to provide timely diagnostic assistance without geographic and temporal hindrance.
However, such goal cannot be simply realized without gathering cross-disciplinary skills and efforts to produce the required integrated technologic platforms. The sensor optical designs, the electronic readout, the software integration have to be considered carefully, and most importantly, relevant diagnostic scenario with identified end-users have to be proposed to promote the m-health approach.
In this thesis, we want to tackle part of these objectives by proposing smart integrated optical devices for mobile-based POC diagnostic. To achieve this goal, we combine the know-hows of the Micro-Sensor and System Laboratory of the biomedical department of National Taiwan University (NTU) and the Laboratory of Nano-optics and Optical Instrumentation (LNIO) of the Université de Technologie de Troyes (UTT). In the context of m-health, the constraints we set on ourselves it that the system should sensitive, very affordable, and versatile in term biologic targets. To achieve this goal, we focus on
doi:10.6342/NTU201700804
6
biosensors based on well-established Surface Plasmon Resonances and work on the system integration and performance improvement strategies beyond the state-of the-art for handheld devices.
In the first part of the thesis, we focus on building a DNA biosensor combining single wavelength colorimetry and digital Lock-In Amplifier (LIA) within a smartphone. In this section, we explore the possibility of utilizing audio jack in building a LIA-based optical biosensor. First, we give an introduction on the background of conventional method for integrating gold nano-particle colorimetry (AuNP) colorimetry with smartphone. A detailed literature review on smartphone based diagnostic tool is then given, which should serve to provide a general background for the thesis. The working principle of classical Lock-In Amplifier (LIA), the synthesis of AuNP, and the hardware /software integration are provided. We discuss the relevance of the smartphone audio-jack channel for conducting such measurement by evaluating its performances. Finally, at the end of this first part of the thesis, we demonstrate a 15-mer DNA detection within 15 minutes of diagnostic time down to 0.77 nM, using a software-based LIA.
In the second part, we take advantage of the developed LIA approach to explore phase-sensitive measurement of Surface Plasmon Resonance (SPR) biosensor for future portable application. As will be discussed, compared to traditional SPR, phase sensitive based SPR usually excels in terms of sensitivity. Such superior sensitivity can be highly
doi:10.6342/NTU201700804
7
desirable when the sensor is challenged with complex bio-sample (i.e., urine, saliva or serum). In this part, we present a novel phase sensitive detection design, named “Shearing Interferometry based Surface Plasmon Resonance” (SiSPR). SiSPR, together with a novel
phase extraction method, will be demonstrated. To show the feasibility of SiSPR in diagnostic application, we have targeted am atherosclerosis relevant protein—cardiac Troponin I (cTnI)—as potential biomarker. Performance of SiSPR, surface modification of the chip as well as a scheme for constructing laboratory prototype will be detailed.
doi:10.6342/NTU201700804
8
Part 1. DNA biosensor combining single-wavelength colorimetry and digital Lock-in Amplifier within a
Smartphone
doi:10.6342/NTU201700804
9
Chapter 2. Introduction to smartphone based colorimetry
With the possibility of increasing the accessibility of medical resources and reducing health expenditure, smartphone based diagnostic tool has been a focus of research recently4, 7, 9, 12. This trend stands on several important facts. First, a smartphone contains numerous powerful devices that can transform it into a laboratory level sensing device.
In contrast to the relatively bulky and expensive gold standard diagnostic tools, such as UV-Visible spectrometer, a smartphone based diagnostic tool offers an alternative diagnostic solution that can be applied in point-of-care setting. With about 4.75 billion mobile users around the world11, smartphone based diagnostic tools may become the most efficient approach to deliver medical assistance across geographical boundaries13, as outlined in the general introduction.
Among a range of possible diagnostic tools, smartphone camera based gold nano- particle colorimetry (SCB-AuNP colorimetry) has shown great potentials3, 14-16. The use of add-on camera replaces the need of a spectrometer to quantify the colorimetry results, thereby making on-site AuNP colorimetry feasible, such as on-site DNA sensing. In SCB- AuNP colorimetry DNA detection, a single strand DNA (ssDNA) used as probe is added to the solution to protect AuNP from aggregation under salt solution. When a target complementary ssDNA presents in the solution, hybridization between probe and target occurs. The resulting double strand DNA (dsDNA) is much more rigid in its molecular
doi:10.6342/NTU201700804
10
structure and therefore cannot protect AuNP from aggregation as effectively as ssDNA.
The aggregation leads to an apparent color change of the AuNP solution, which can be detected via smartphone camera. The color change of the particle corresponds to a spectral shift in the plasmonic resonance of the gold nanoparticles, which is directly related to the effective particle size. The captured image is then analyzed and processed via a specific application. Taking advantage of the User Interface (UI) offered by smartphone, the user can then obtain a well-processed diagnostic report in real-time.
Although SCB-AuNP colorimetry shows good potential for POCT application, the use of camera as optical detector also sets up certain important limitations. First, the add- on camera generally provides a low bit depth (typically 8-bit), limiting the ultimate sensitivity of the SCB-AuNP. This is especially true if we compare this to the 16-bits available via the audio phone jack, where an optical detector can be plugged. Secondly, smartphone camera is very slow in data acquisition (~100 Hz maximum) while the audio jack-reading channel can reach 44.1 kSample/s. The low time resolution prevents SCB- AuNP colorimetry to bridge with more sophisticated tool such as lock-in amplifier (LIA) detection, where high working frequency is preferably used to reach higher signal to noise ratio. In other words, in order to further improve the sensitivity and detection mechanism of smartphone based colorimetry, a new way of implementing colorimetry on smartphone is desirable. To achieve such goal, we propose a new metrologic approach for
doi:10.6342/NTU201700804
11
implementing colorimetry on smartphone. In our method, the audio jack is used in replacement of the camera to build a low cost yet powerful AuNP colorimetry featuring Smartphone-Based digital LIA (SBLIA). The approach is referred to as SBLIA-AuNP colorimetry in the following.
Herein, SBLIA-AuNP colorimetry sensor is presented and analyzed in detail. Through a tailor-made circuit board, the smartphone audio output channel sinusoidally drives the injection current of a 650 nm laser in the kHz range. As the beam travels through the AuNP solution, the modulation amplitude of the output beam decreases with increasing concentration of the dsDNA in the sample. The audio input channel then reads the beam intensity from a photo-diode and the smartphone process the data with an implemented software LIA. The implemented software LIA picks up our source signal components at the designated frequencies and filters out the noises. Finally, based on the modulation intensity obtained, the user can readily monitor the absorbance of the sample through the UI. Since audio jack plays a vital role as a function generator in our measurement, an examination of the audio jack performances including working frequency limit, intrinsic noise type is first provided. Then, the noise spectrum of the system and corresponding optimized measurement conditions are discussed. Finally, a DNA detection is carried out as an example to demonstrate the efficacy of our system.
doi:10.6342/NTU201700804
12
Chapter 3. Literature review on smartphone based diagnostic tool
In recent year, smartphone has been widely applied in physical sensors for diagnostic purposes. Due to the ubiquitous existence of audio jack, the audio jack has been considered not only as a source of sensor integration but also for energy harvesting. For example, through a diode bridge, audio jack AC output voltage can be transformed into DC power supply17 (cf. Fig. 3). The power hijacking can be used to power up certain diagnostic devices with low power consumption. For example, Verma et. al. have applied the audio jack as a source for electro-cardiogram measurement (ECG)1. In more advanced model, smartphone also comes with USB 3.0 protocol where a 5V output with 400 mA upper current limitation is provided.
Fig. 3 Power hijacking from audio jack.
Beyond conventional physical sensor like ECG or pulse oximeter6, complex bio- chemical sensors have also been proposed (cf. Fig. 4). In 2014, Jiang et al. from Cornell university
doi:10.6342/NTU201700804
13
have notably reported4 “Solar thermal polymerase chain reaction for smartphone-assisted molecular diagnostics” (cf. Fig. 5). The authors showed that, using a micro-controller unit
(MCU), smartphone can readily monitor the temperature conveyed by sun light to heat a micro-flow through polymerase chain reaction (PCR) disk. In this way, energy
consumption of the PCR is kept at minimum and thus rendering both durability and portability of the device. Through the use of a primer sequence, viral DNA of Kaposi’s
Sarcoma herpesvirus is amplified by PCR reaction for detection of the virus. The product of PCR is then monitored by an add-on camera to feedback the detection results.
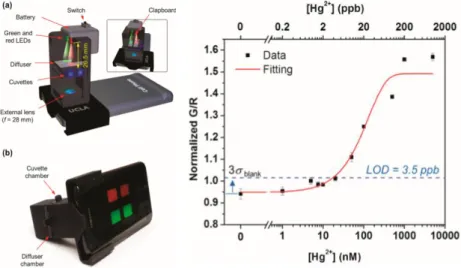
Besides PCR, colorimetry is yet another diagnostic tool where smartphone add-on camera find new application18 (cf. Fig. 6). For example, also in 2014, Wei. et. al. from University of Los Angeles, California, have demonstrated a smartphone-based water mercury pollution sensor using gold nano-particle colorimetry (AuNp colorimetry)3.
In the mentioned work, 10-mer DNA is added to the gold nano-particles as a probe Fig. 4 Audio jack based ECG measurement device from Ann Harbor University1 .
doi:10.6342/NTU201700804
14
sequence (5’-TTT TTT TTT T-3’). When Hg2+ is present in the solution, the probe DNA
is forced to leave the AuNps, forming a Hg2+ complexed double helix, resulting in
Fig. 5 Smartphone based Karposi’s Sarcoma herpesvirus detection4.
(a) an overview of sensor device (b) micro-controller and temperature sensor unit. (c) user-interface of the application (d) heating unit of micro-flow through PCR disk. (e) structure of the proposed micro-flow through PCR disk (d) electrophoresis result of the PCR (for verification purposes).
Fig. 6 Smartphone based AuNp colorimetry biosensor for monitoring water pollution3 (a) an overview of sensor device (b) calibration curve of the sensor
doi:10.6342/NTU201700804
15
salt induced aggregation of the AuNp solution. The color shift is then detected via a
smartphone with its rear add-on camera. The device helps to quantify the level of absorption (using the ratio between the absorption at a wavelength λ=532 nm and λ=625
nm) of the AuNp solution, and consequently to determine the level of Hg2+ in water. The tailor-made sensor is reported to have a limit of detection down to 3.5 ppb which reaches the gold standard of the public health sector.
Beside Localized Surface Plasmon Resonance (LSPR) biosensor, such as AuNP colorimetry, we can also find fiber based SPR integration on smartphone platform. A group of researcher from Purdue University in US has demonstrated the possibility to combine fiber based SPR within the smartphone19 In this work, the smartphone back LED is filtered and coupled to an optical fiber where part of the fiber is peeled and coated with a gold film (cf. Fig. 7). The fiber output light intensity is measured with the smartphone rear camera. The measured sensitivity in terms of Refractive Index Unit (RIU) is around 7x10⁻⁵ RIU, which is a bit less sensitive as compared to commercial products (2.5x10⁻⁵ RIU for BIOSUPLARTM, a commercial SPR from HANDTAKETM GmbH). To demonstrate the bio-sensing efficiency, the fiber based SPR smartphone sensor is tested with Immunoglobin G (IgG), as shown in Fig. 8.
Beside smartphone approach, other systems use tailor-made circuit that contain micro- controller and processor to perform LSPR measurements 2. As shown in the
doi:10.6342/NTU201700804
16
Fig. 9, integrated LSPR system contains motors, imaging system, thermal controller unit, a display as well as a LIA system. It allows multiplexing detection of nine region of interest. Other interesting examples including fluorimeter and other SPR based sensor9,
14, 20 could also be mentioned. Not all these recent results are reported here for the sake of
conciseness, the important point here being to provide a view on how smartphone can be Fig. 7 fiber based SPR biosensor coupled to smartphone.
Fig. 8 Probing IgG on smartphone based fiber SPR.
doi:10.6342/NTU201700804
17
transformed into optical sensor platform and to outline its capabilities.
Fig. 9 Portable LSPR sensor integrated system2.
doi:10.6342/NTU201700804
18
Chapter 4. Material and methods
Section 4-1. Theoretical background of Lock-in Amplifier
While LIA operation is a very well-documented electronic technique which is used for long, its implementation as a software in smartphone has not been reported yet and we can briefly remind its working principle as we intend to use it for AuNP colorimetry.
In a typical LIA detection, the source signal is modulated at a specific frequency:
𝑓(𝑡) = 𝑉 𝑠𝑖𝑛(2𝜋𝑓𝑠𝑡 + 𝜑) Eq. 1
where φ is phase of the signal, V is the amplitude of the modulation and fs is the
frequency of the modulation. The essence of the LIA is to mix the signal with two reference functions, i.e. a sine and a cosine, and to generate the corresponding “X” and
“Y” output:
𝑋 =2
𝜏∫ 𝑉 𝑠𝑖𝑛 (2𝜋𝑓0𝜏 𝑠𝑡 + 𝜑)𝑠𝑖𝑛(2𝜋𝑓𝑅𝑡)𝑑𝑡 Eq. 2 𝑌 =2
𝜏∫ 𝑉 𝑠𝑖𝑛 (2𝜋𝑓0𝜏 𝑠𝑡 + 𝜑)𝑐𝑜𝑠(2𝜋𝑓𝑅𝑡)𝑑𝑡 Eq. 3
As it is well known, due to the orthogonality property of the sinusoidal function, only when frequency of the signal (f𝑠) equals to the frequency of the reference signal (f𝑅), will
X and Y have non-zero output, which means that we have, for a sufficient integration time τ :
𝑖𝑓 𝑓𝑠 = 𝑓𝑅, {𝑋 = 𝑉𝑐𝑜𝑠(𝜑)
𝑌 = 𝑉𝑠𝑖𝑛(𝜑) 𝑖𝑓 𝑓𝑠 ≠ 𝑓𝑅, {𝑋 = 0
𝑌 = 0 Eq. 4
doi:10.6342/NTU201700804
19
and using these X and Y outputs, we can find amplitude (V) and phase (φ) of the source signal. The amplitude and phase are then given by:
𝑉 = √𝑋2+ 𝑌2 Eq. 5 and 𝜑 = 𝑎𝑟𝑐𝑡𝑎𝑛2(𝑋, 𝑌) Eq. 6
We note that the integration time τ determines the number of periods summed in order to determine the amplitude V. Thus, increasing τ provides an averaging effect to suppress noise, as we will see in later section.
In our case, the signal is the modulated laser intensity, and its amplitude of modulation is monitored via the LIA output (V). Some other important properties of LIA should also be noted here. First, the LIA outputs exclude all the signal frequencies from DC to the highest frequency possible, except the signal at the reference frequency. In other words, the LIA can be simply regarded as a powerful, narrow, bandpass filter that helps to greatly exclude out-of-band signal. This is a very favorable characteristic in point-of-care application, where ambient light variation and noises are expected. In other words, the proposed SBLIA- AuNP colorimetry is not vulnerable to ambient light change nor do we need a nicely sealed measurement environment to provide accurate results.
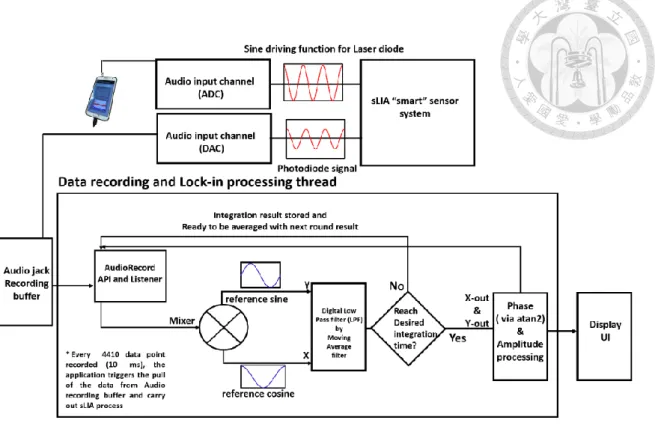
Section 4-2. Digital LIA algorithm
The algorithm of digital LIA can be found in Fig. 10. In SBLIA, the raw waveform, received by the audio jack, is first digitally mixed with the reference signal. Then, it is
doi:10.6342/NTU201700804
20
passed through a digital low pass filter (LPF) which is realized by an averaging filter. The low pass filter controls the integration time (τ) of the LIA. The value of τ can be adjusted during the experiment through the UI. Increasing τ will increase the number of data point being averaged. This action narrows LIA pass band and consequently reduces the noises.
Section 4-3. SBLIA-AuNP colorimetry system
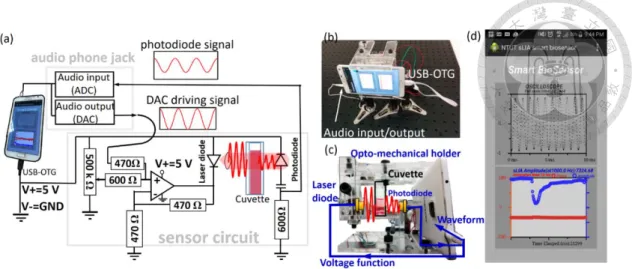
The SBLIA system design can be seen in Fig. 11 (a), while the top view and side view of the system can be seen in Fig. 11 (b) and (c). During SBLIA-AuNP colorimetry DNA sensing measurement, AuNP sample with different levels of target DNA is placed in the cuvette for measurement. The intensity of the laser diode (ADL65052TL from Roithner LaserTechnik) is sinusoidally modulated. The modulation waveform is provided by the
Fig. 10 Digital Lock-In Amplifier Algorithm.
doi:10.6342/NTU201700804
21
audio output channel. A voltage offset to the laser is needed to drive the laser in a linear working range. In this work, the smartphone USB-OTG is used to provide an offset to the laser. During detection, the laser beam travels through the AuNP sample. The modulated output intensity is collected by a FDS-100 Si photodiode from Thorlabs Inc. and read by the audio input channel. The implemented digital LIA then extract amplitude information, using the recorded signal waveform data (upper window in “Oscilloscope” in Fig. 11 (d)).
The amplitude sensogram is presented to the user as shown in the lower window in Fig.
11 (d). When the sample’s absorption increases/decreases, the amplitude of the laser modulation decrease/increase correspondingly. The absorbance of the sample can then be inferred from the data. The opto-mechanical holder made in PMMA helps either to fix the system on a table for laboratory application or to work as a portable detection unit.
The smartphone arbitrarily used in this work is a Galaxy Note 2 from Samsung. We note that audio channel does not follows a universal industrial protocol, and is therefore subject to minor changes in reading and output capacity. However, the audio cards of the mainstream mobile phones have comparable performances, and the following investigation serves to provide the important essence of implementing SBLIA for biosensing application that remains universal between different smart device models.
doi:10.6342/NTU201700804
22
Section 4-4. AuNP preparation
The oligonucleotides used for DNA detection experiment were synthesized by PurigoTM Biotech, Taipei, Taiwan and were further purified by high performance liquid chromatography (HPLC). The probe DNA strand used in the sensing experiment is a 15- mer DNA with a sequence of CTA ACA CCC CAC TCA, and the target strand is the complementary strand of the probe. This sequence is designed so that no self- hybridization can occur. The gold nanoparticle is prepared using citrate mediate reduction.
A 100 mL aqueous solution of HAuCl4 (41 mg, 1.0 mM) was heated to reflux and stirred vigorously. Later on, a 10 mL of tri-sodium citrate (114 mg, 38.8 mM) solution was quickly added to this solution. The solution was then heated for 10 min and was allowed
Fig. 11 SBLIA-AuNP colorimetry system overview.
(a) The electrical circuit and the system diagram of SBLIA system (b) reveals system front view, and (c) is the system side view. (d) User-Interface (UI) of the android application. The upper plot shown in the UI is the normalized raw waveform data from audio input channel. The lower plot is the phase/amplitude sensogram data.
doi:10.6342/NTU201700804
23
to cool to room temperature while being vigorously stirred. Before AuNP solution is finally stored at 4 degree, some filtering is necessary. The average diameter of AuNPs was found to be around 13 nm, as determined with a particle size analyzer.
Section 4-5. Sample preparation for target DNA detection
The procedure for target DNA detection is comprised of three steps: DNA hybridization, AuNP-DNA incubation and then the colorimetry measurement.
Step1. (DNA hybridization)
6.4 L of 10 M probe ssDNA is incubated with a designated amount of 10 M target
DNA in a 1 ml vial. These 6.4 µ L of probe ssDNA correspond to 200 nM in the final detection process. Meanwhile, 0, 0.8, 1.6, 3.2, 4.8 µ L of 10 M target DNA will
correspond to 0, 20, 40, 80, 120 nM of target DNA in the final detection. To facilitate optimized hybridization conditions, we add 3 L of 2 M NaCl and fill the solution with TBE buffer to 27 L. Finally, we incubate for 5 minutes.
Step2. (AuNP-DNA incubation)
We add 250 L of AuNP and 150 L of de-ionized water to the sample solution prepared
in step 1, then we incubate 10 minutes before colorimetry measurement (Step 3).
At this point we can point out a possible troubleshooting:
The color change may not be very prominent. In such case, we need to adjust the salt concentration in step1 to optimize the colorimetry result. This will greatly enhance the color contrast between samples with different target DNA.
doi:10.6342/NTU201700804
24
Section 4-6. Converting SBLIA-AuNP colorimetry measurement data into absorbance unit (AU) for comparison
Fig. 12 shows a typical result of SBLIA-AuNP colorimetry sensogram. In order to compare important system properties, e.g Noise-to-Signal Ratio (NSR) and Limit of Detection (LOD), between SBLIA and UV-Visible spectrometer, the sensing result must be weighted to obtain the same measurement units. In contrast to a UV-Visible spectrum, the SBLIA will provide a digital value corresponding to an optical intensity that require a conversion. In the present context, absorbance reference level is defined by the AuNP
solution that contains only 200 nM probe DNA and zero target DNA (This will be defined as “blank sample” hereafter). Therefore, the data from the SBLIA-AuNP measurement
can be converted to AU by definition of absorbance:
𝐴𝑐 = −𝑙𝑜𝑔 ( 𝐼𝑐
𝐼𝑐=0) Eq. 7
Where Ic is the SBLIA intensity as a function of target DNA concentration C in AuNP.
Ic=0 is the SBLIA intensity when blank sample is placed in the cuvette.
In case of UV-Visible spectrometer, our UV-Visible absorbance data uses air transmission as the reference level (i.e, 100% transmission). In such case, when AuNP solution contains target DNA with a concentration C, the UV-Visible absorbance data can be defined as:
𝐴𝑐𝑈𝑉−𝑉𝑖𝑠 = − 𝑙𝑜𝑔 ( 𝐼𝑐
𝐼𝑎𝑖𝑟) Eq. 8
doi:10.6342/NTU201700804
25
And for the blank sample, we have:
𝐴𝑐=0𝑈𝑉−𝑉𝑖𝑠 = − 𝑙𝑜𝑔 (𝐼𝑐 = 0
𝐼𝑎𝑖𝑟 ) Eq. 9
We can obtain absorbance, considering the blank sample as reference, simply by subtracting Eq. 8 withEq. 9 Eq. 9. In this way, we have:
𝐴𝑐 = − 𝑙𝑜𝑔 ( 𝐼𝑐
𝐼𝑐=0) = 𝐴𝑐𝑈𝑉−𝑉𝑖𝑠− 𝐴𝑐=0𝑈𝑉−𝑉𝑖𝑠 Eq. 10
Using Eq. 7 and Eq. 10, results from both systems can be evaluated on the same basis.
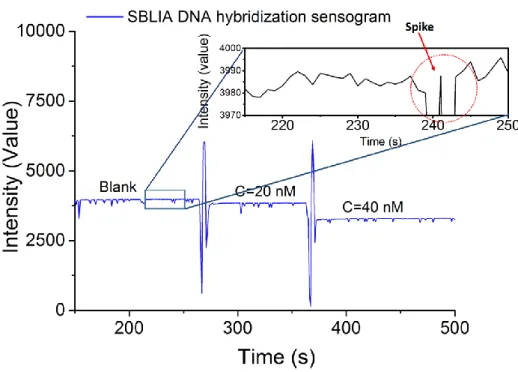
Fig. 12 typical DNA sensorgram of sLIA “smart” biosensor.
doi:10.6342/NTU201700804
26
Chapter 5. Results and Discussion
Section 5-1. Characterizing audio channel
In the proposed SBLIA system, the audio output channel generates the modulation function to drive the laser as our source signal. Therefore, the quality of the audio output will largely determine the final performance of SBLIA. Meanwhile, the frequency working range of the audio channel also determines the upper frequency limit for our SBLIA. Therefore, audio channel has to be examined in some details. The Fig. 13 (a) and (c) shows typical audio jack output waveforms which are acquired via a data acquisition card from National Instrument (DAQ-USB X series). Fig. 13 (b) is recorded by directly connecting the audio phone output channel to the reading channel. In present context, the audio output is set to provide a sine voltage function to drive the laser diode, i.e.:
𝑉𝑎𝑢𝑑𝑖𝑜 𝑜𝑢𝑡(𝑡) = 𝑉𝑎𝑢𝑑𝑖𝑜𝑠𝑖𝑛 (2𝜋𝑓𝑡) Eq. 11
where f is the designated digital LIA working frequency. As shown in Fig. 13 (a), the audio phone jack can generate a Vaudio between 2 to 240 mV, which is sufficient to modulate typical visible/NIR laser diodes. As can be expected, audio phone jack output exhibits noticeable random noises which spans a wide range of frequency (inset of Fig.
13 (a)). In addition to this white noise, we observe that a random fluctuation of the amplitude Vaudio (Fig. 13 (b)) exists. This “amplitude jittering” noises, is especially visible when Vaudio is low. The noise is presumably coming from the audio output channel.
doi:10.6342/NTU201700804
27
Judging on the acquired waveforms, a 19% discrepancy in amplitude (from trace 1 to trace 3) is found in extreme cases corresponding to the smallest Vaudio. However, both noises mentioned above are much less prominent when the audio output level is higher.
In brief, instead of assuming an ideal and noise-free driving function from audio output channel, we have a driving function in form of:
𝑉𝑎𝑢𝑑𝑖𝑜 𝑜𝑢𝑡𝑝𝑢𝑡(𝑡) = (𝑉𝑎𝑢𝑑𝑖𝑜± ∆𝑉𝑗𝑖𝑡𝑡𝑒𝑟𝑖𝑛𝑔)𝑠𝑖𝑛 (2𝜋𝑓𝑡) + 𝑉𝑟𝑎𝑛𝑑𝑜𝑚 𝑛𝑜𝑖𝑠𝑒 Eq. 12
Fig. 13 Evaluating the audio output channel as SBLIA function generator (a) Vaudio out(t) signal from the audio output channel for different Vaudio. The inset is a magnified view of the Vaudio out(t) waveforms under low Vaudio. Based on the figure, it is clear that the audio channel noises are more prominent when Vaudio is relatively small. (b) Vaudio out(t) recorded under the same Vaudio at different time. (c) Vaudio out(t) with increasing working frequency (from top to bottom: 1 kHz, 4 kHz and 9 kHz respectively).
doi:10.6342/NTU201700804
28
where size of 𝑉𝑎𝑢𝑑𝑖𝑜 and noises in the audio output channel need to be addressed carefully to provide optimized digital LIA performance.
Fig. 13 (c) shows the sinusoidal functions from audio output channel for an increasing modulation frequency. As can be seen, a slight waveform distortion commences near 4 kHz (cf. second trace) and keep increasing with frequency. The distortion in waveform is also accompanied by a gradual decay of the output amplitude (cf. trace at 9 kHz).To sum up, the audio output channel provides sinusoidal signals that are able to drive a laser diode up to about 4 kHz without severe distortion or power decay, and there exist certain noises that need to be addressed by proper filtering.
Section 5-2. SBLIA performance and working parameters
In biosensing, finding optimized working conditions to reduce noise level is of vital importance, as the noise determines the Limit of Detection (LOD), i.e. the minimum detectable amount of analyte with a statistical significance. Therefore, the effect of three SBLIA working parameters, the operation frequency (f), audio channel output voltage (Vaudio) and integration time (τ) are thoroughly investigated in this section.
The inset of Fig. 14 (a) demonstrates how the noise level can be accessed from a typical SBLIA amplitude sensogram. In present context, the noise level is defined as the standard deviation of amplitude signal during a sufficient long period (>100 𝜏). Here, 𝜏 ranges from 0.4 ms to 200 ms depending on the given condition. To compare the noise under
doi:10.6342/NTU201700804
29
different working parameters, NSR is used instead of absolute noise level. The NSR is obtained by dividing the noise with the mean signal level and it is expressed in decibel.
To investigate the noise distribution in frequency space, a noise spectrum is shown in in Fig. 14 (a). The spectrum is made by measuring NSR of SBLIA under different working frequencies.
As in most optoelectronic system, when working frequency increases, the noise intensity decreases rapidly following a power law. It is found that the noise is proportional to frequency in powers of -1.66. These data indicate that, by working above 1 kHz, the SBLIA reduces 85% of the 1/f flicker noise (from ~8.8x10⁻³ to 1.32x10⁻² NSR). As discussed in previous section, there exists noises in 𝑉audio and the noise has a dependence on 𝑉𝑎𝑢𝑑𝑖𝑜. Therefore, the effect of 𝑉𝑎𝑢𝑑𝑖𝑜 on SBLIA noise level is investigated here (Fig. 14 (b)). The result indicates as expected that the noise is reduced when 𝑉𝑎𝑢𝑑𝑖𝑜 increases. When 𝑉𝑎𝑢𝑑𝑖𝑜>40 mV, the NSR reaches a plateau around -49 dB, indicating it is optimized. Based on the results from Fig. 13 (a) inset and Fig. 14 (b), we can infer that the noise in audio channel is more or less fixed in size as compared to 𝑉audio. Therefore, a large 𝑉audio should be used to obtain a better NSR. Hence, 𝑉𝑎𝑢𝑑𝑖𝑜>
40 mV is suggested for a proper operation. The effect of τ is shown in Fig. 14 (c). We can see that, when τ increases from 0.4 ms to 200 ms, the NSR gradually reduces to a minimum around -63 dB. Based on the obtained results, τ> 60 ms is also suggested for
doi:10.6342/NTU201700804
30
a proper operation. Also, since this test is held under the lowest 1/f noise (at 2.5 kHz) and 𝑉𝑎𝑢𝑑𝑖𝑜 noise (Vaudio=40 mV) possible, we consider -63 dB to be the optimum NSR achievable with our SBLIA at the moment.
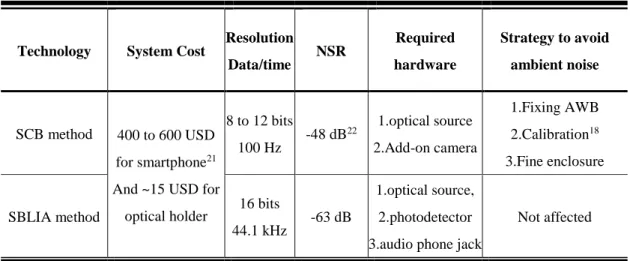
Section 5-3. Comparison between SBLIA approach and SCB
Based on all the quantitative results and discussion above, Table 1 provides a detailed comparison between the SBLIA and the conventional SCB. To begin with, both systems cost between 400~600 USD21. Almost all of the cost is attributed to the smartphone itself, since the system integration is relatively cheap (~15 USD). In terms of detection, SBLIA uses the 16 bits audio input jack to read the optical signal from a photodiode. This offers much higher data resolution. As already mentioned, the audio Fig. 14 Noise level and effect of working parameters on the developed SBLIA system.
The evaluation of SBLIA performance and working parameter are carried out with the cuvette left empty without AuNP. (a) 1/f flicker noise spectrum. The evaluation is carried out under f=2.5 kHz and τ=200 ms. The inset presents a typical SBLIA sensogram that is used for statistical analysis of NSR. (b) noise measured under different level of output Vaudio. The evaluation is carried out under f=2.5 kHz and τ=0.4 ms. (c) demonstrates the NSR under different level of τ. The measurement is made under f =2.5 kHz with 40 mV of output V0 . The standard deviation of estimated noises are made from three independent tests.
doi:10.6342/NTU201700804
31
input channel can also capture data at 44.1 kSample/s, which make SBLIA a viable option on smartphone. Taking the advantage of high operation frequency, the SBLIA greatly reduces 1/f noise, audio channel intrinsic noise and environment noise.
Compared to the latest report on SCB based method22, SBLIA offers a 15 dB lower noise level ( -63 dB vs -48 dB). Finally, in settings of POCT where ambient lighting condition changes, SCB based method would need to fix auto-white balance (AWB)8, carry out further calibration and add a fine enclosure to the system. However, these strategies often come with a price of lower resolution. On the contrary, SBLIA is not affected by normal ambient lighting condition and can largely filter out the lower frequency noises, making SBLIA a much better candidate in POCT setting
Section 5-4. DNA sensing by SBLIA-AuNP colorimetry
In this part, to demonstrate the SBLIA and its efficacy on AuNP colorimetry, our system is applied to short strand DNA detection with a target DNA concentration of 0,
Table 1. Comparison of the proposed SBLIA method and the SCB method
Technology System Cost Resolution Data/time
NSR Required
hardware
Strategy to avoid ambient noise
SCB method 400 to 600 USD for smartphone21 And ~15 USD for
optical holder
8 to 12 bits 100 Hz
-48 dB22 1.optical source 2.Add-on camera
1.Fixing AWB 2.Calibration18 3.Fine enclosure
SBLIA method 16 bits
44.1 kHz
-63 dB
1.optical source, 2.photodetector 3.audio phone jack
Not affected
doi:10.6342/NTU201700804
32
20, 40, 80 and 120 nM. The target DNA is 15-mer in length and is complementary to a 15-mer probe strand.
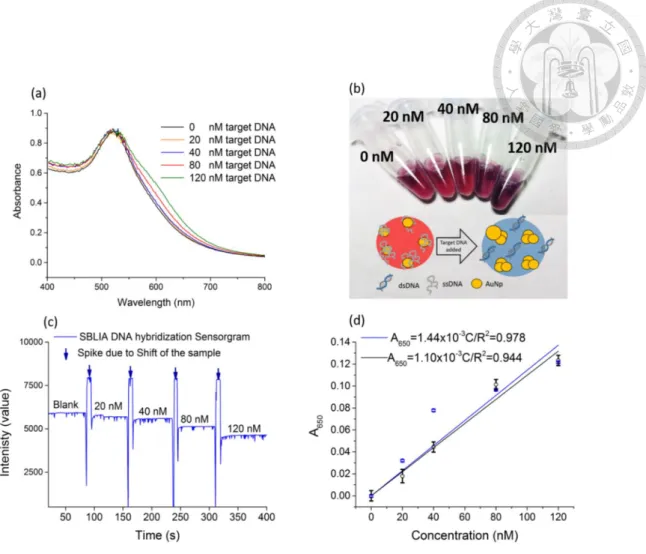
The probe ssDNA is always 200 nM for all samples regardless of the target complementary DNA concentration In this experiment, the SBLIA works under the optimized parameter, i.e. f=2.5 kHz, τ = 60 ms and Vaudio=40 mV. Finally, the SBLIA- AuNP colorimetry results are compared with a commercial UV-Visible spectrometer.
UV-Visible spectrometer being generally considered as gold standard tool for colorimetry detection. The spectrometer was set to have an averaging time around 60 ms in order to compare both system on a fair basis. A typical UV-Visible spectrum for AuNP samples with different concentrations of target DNA is shown in Fig. 15 (a). As revealed by the spectrum, the absorbance between 550 nm to 700 nm increases as target DNA concentration increases. This corresponds to a AuNP sample color change as shown in Fig. 15 (b) from red to dark purple, when target DNA concentration increases. As explained earlier, this is due to the fact that AuNP tends to aggregate in salt environment when dsDNA presents. This aggregation leads to change in the AuNP sizes which alters the localized surface plasmon resonance spectrum.
Fig. 15 (c) demonstrates a typical DNA SBLIA-AuNP colorimetry sensogram. Judging on the sensogram, SBLIA system shows the similar monotonic change as in UV-Visible spectrometer, the modulation amplitude of the beam drop by 33% from 0 nM to 120 nM
doi:10.6342/NTU201700804
33
of target DNA. This is again due to the increasing absorbance of the AuNP sample along with increasing dsDNA concentration. In order to further compare the results from SBLIA-AuNP sensogram and UV-Visible spectrometer, the above mentioned detection is repeated four times for both systems and calibration curves are then established. The data from our SBLIA system is converted into the absorption unit (AU) for constructing the calibration curve. The noise is measured in each set of test and presented as averaged results. The calibration curve can be found in Fig. 15 (d). For both systems, the absorbance at 650 nm (A650) has a very similar linear dependence to the concentration (C,
in unit of nano-molar) of target DNA. As indicated from the curve, the calibration curve is A650=1.44x10⁻³C for the SBLIA and A650=1.1x10⁻³C for the UV-Visible system. Since both systems use a cuvette with the same optical path length, this result is reasonable judging from the Beer-Lambert’s law. Further investigation of the systematic noise indicates that the noise form the SBLIA system is 4.3 times smaller than the UV-Visible spectrometer, i.e. 3.7 × 10⁻⁴ AU compared to 1.6 × 10⁻³ AU.
Finally, based on the obtained noise and the calibration curves, the LOD is then calculated to be 0.77 nM for our system which is 5.7 times lower than 4.36 nM achieved by the UV-Visible system.
The importance of the obtained results, beyond the figure of improvement, lies in the insights that they provide into the context and future development of smartphone based
doi:10.6342/NTU201700804
34
diagnostic. Firstly and most importantly, the SBLIA proposed herein has high potential for development of further optical based sensor technologies. Although not explicitly used herein, the phase detection noise of our SBLIA system is down to 0.2 degree which could lead to high quality smartphone based phase sensitive detection (Fig. 16). For
Fig. 15 SBLIA-AuNP colorimetry DNA sensing
(a) UV-Visible spectrum of the AuNP sample solution. The sample solution contains 200 nM of ssDNA with different concentration of target DNA. (b) An image of the sample solutions and a scheme of the AuNP DNA sensing mechanism. (c) SBLIA- AuNP colorimetry DNA sensing amplitude sensogram. The concentration of target DNA is marked and the blue spike in the figure indicate the spike due to change of sample. (d) Calibration curve for the SBLIA-AuNP colorimetry system (blue trace) and UV-Visible spectrometer (black trace).
doi:10.6342/NTU201700804
35
example, through proper optical design, SBLIA could be applied to build smartphone based LIA enhanced fluorescence tag bio-sensor23, phase sensitive detection of plasmonic sensor 24 and even holographic measurement (multi-channel phase detection). Hence,
while smart AuNP colorimetry is undoubtedly an interesting approach to pursue, we believe that the SBLIA itself should spur a wide range of distinct applications in sensing.
Secondly, we note that the ratiometric measurement using a 650 nm/520 nm absorbance ratio is not used here as in our previous report since audio channel provide only one input25. As is well known, using 520 nm absorbance to normalized 650 nm absorbance may further enhance the batch-to-batch reproducibility of AuNP colorimetry.
In the future, this may be addressed by incorporating new electronic design6 or by extending SBLIA onto an external embedded system where multiple analog receivers are available. The latter design could add flexibility to SBLIA data resolution, by adding a
Fig. 16 phase signal extracted with SBLIA.
doi:10.6342/NTU201700804
36
number of detection channels. Such approach would also be well adapted to smartphone models where audio jack is absent.
Finally, the ultimate performances of smartphone based diagnostic is still an on-going debate8 and important design factors need to be considered for applying SBLIA-AuNP system in on-site disease screening. These factors include complex background of physiological sample26 and the consequent pre-processing issue27. Still, some research results report smart diagnostic devices have already reached world health organization (WHO) gold standards3 or other gold standards9, and have been applied to on-site application or disease screening4. As exemplified by this work, we are expecting more and more smartphone based diagnostic tools with equal or even better performances as compared to some of their laboratory relatives.
Section 5-5. Conclusion
In summary, a SBLIA-AuNP colorimetry sensor is proposed. The SBLIA system employs audio output channel as function generator while audio input channel is employed as photo-detector reader. It is found that SBLIA system can largely reduce the audio output channel intrinsic noise as well as the environmental noises to reach a minimum NSR of -63 dB. This NSR was obtained after optimization of the working parameters of the system (f=2.5 kHz, Vaudio=40 mV and τ =60 ms). Judging on the results, SBLIA offers better NSR compared to SCB method (-63 dB vs -49 dB). At the
doi:10.6342/NTU201700804
37
same time, SBLIA provides better data bit resolution while being insensitive to changes in the ambient lighting condition. Finally, SBLIA-AuNP colorimetry was applied to a DNA detection experiment for sensitivity evaluation of the efficacy. Compared to the UV-Visible spectrometer, SBLIA has a LOD around 0.77 nM which is 5.7 times lower than the result form a desktop UV-Visible spectrometer. The main reason behind the improvement is attributed to the excellent NSR offered by SBLIA system. Finally, SBLIA may very likely foster further diagnostic tool, e.g. fluorescence and interferometry, leading to more sensitive “smart” diagnostic for POC applications.
doi:10.6342/NTU201700804
38