行政院國家科學委員會專題研究計畫 成果報告
自我運動追蹤術:應用於磁振造影血流速測定及高解析度 心臟造影術(III)
研究成果報告(精簡版)
計 畫 類 別 : 個別型
計 畫 編 號 : NSC 97-2320-B-011-002-
執 行 期 間 : 97 年 08 月 01 日至 98 年 10 月 31 日 執 行 單 位 : 國立臺灣科技大學電機工程系
計 畫 主 持 人 : 黃騰毅
共 同 主 持 人 : 劉益瑞、王福年
計畫參與人員: 碩士班研究生-兼任助理人員:楊曜豪 碩士班研究生-兼任助理人員:朱珣穎 碩士班研究生-兼任助理人員:林恩立 碩士班研究生-兼任助理人員:蔡宜錄
報 告 附 件 : 國外研究心得報告
出席國際會議研究心得報告及發表論文
處 理 方 式 : 本計畫涉及專利或其他智慧財產權,2 年後可公開查詢
中 華 民 國 99 年 01 月 12 日
行政院國家科學委員會專題研究計畫成果報告
自我運動追蹤術:應用於磁振造影血流速測定及高解析度心臟造影術(III) 計畫編號: 97-2320-B-011-002
執行期限:97 年 8 月 1 日至 98 年 10 月 31 日 主持人:黃騰毅 台灣科技大學 電機工程系
一、中文摘要
血管的流速量測在磁振造影的技術中,通常都需要心電圖信號來幫忙進行同步的動作,以 觀測律動的動脈血流。而我們的計畫中則研發出利用自我運動追蹤技術來對磁振信號做分 析,在信號本身中去取取心臟跳動的資訊,也因此不在需要心電圖的幫忙。我們將此技術 應用在血流速相對緩慢的頸動脈上,去探討此技術的可行性。經過計畫的執行,我們利用 了放射狀 K 空間軌跡以及相關分析以及區域複數差別影像法完成了上述技術。而經過了與 傳統方法的定量比較,我們發現我們的技術可行性很高。量測出來的流體參數與傳統方法,
在統計上有著高度相關性。
關鍵詞:放射狀掃描; 流體同步;相位對比
Abstract
Flow measurements by phase-contrast imaging generally requires an ECG signal to synchronize the acquisition of imaging data with pulsatile arterial flow. Recently, self-gated and flow-gated methods via radial scanning are reported for acquiring phase-contrast images on major cardiac vessels without usage of ECG. For carotid arteries with much weaker flow than larger vessels, flow gating without ECG becomes rather challenging. In this study, we accomplished such an aim by employing a correlation method on ROI-selected complex difference images acquired with radial scanning. Quantitative comparison with conventional ECG-gated imaging showed that the proposed method is highly feasible. The correlation coefficients of flow-related measurements between conventional ECG-gated imaging and radial flow-gated imaging are ranged from 0.96~0.92.
Key words: radial scan; flow-gated; phase contrast MRI; complex difference; carotid artery
Introduction
MR phase-contrast (PC) flow quantification imaging has been shown practical in the investigation of neurovascular disease. The applications include, but certainly not limited to, monitoring the effect of pharmaceutical treatment (1), carotid bifurcation hemodynamics with computational fluid dynamics (2,3), predicting the outcome of patients with acute stroke (4) ,vasomotor reactivity test and so on (5).
The current implementation of the phase-contrast imaging often uses bipolar velocity encoding gradient with specific VENC preceding gradient-echo readout. To measure the pulsatile blood flow in the vessels, the phase-contrast sequences generally acquire electrocardiograph (ECG) signal and k-space data simultaneously to accordingly capture the same cardiac phases from one heartbeat to the next. Then, the k-space data is arranged to several specific cardiac phases either prospectively or retrospectively according to the ECG signal information, yielding the reconstructed velocity-encoded phase images synchronized with cardiac motion. However, the requirement of ECG signal complicates the preparation before scan due to the placement of the ECG electrodes and leads. Moreover, acquiring ECG signals during MR scanning may obtain signals with significant artifacts because of the rapid switching of magnetic field gradients and RF pulsing (6-9). Furthermore, the PC imaging may fail in those patients with the presence of arrhythmia or weak ECG signals. As a result, the need of ECG referencing increases the cost and complexity of PC flow imaging in the clinical practice.
The recently reported self-gating methods(10,11) provided alternative ways to the ECG-gating method. In the study of Larson et al (10), cardiac imaging was acquired with radial trajectory over-sampling the k-space center. Owing to a significant amount of ventricular volume change during cardiac pulsation, prominent signal intensity differences of radial views were observed and used to extract the cardiac motion trace. The cine cardiac images were reconstructed by retrospectively synchronizing the k-space data with the self-generated motion trace. This method is thus termed “self-gating”. In the study of Thompson et al. (11), the self-gating method was adapted with complex difference method to extract pulsatile blood flow trace and incorporated into PC imaging to measure the blood flow velocity of major large vessels or area with strong flow, such as aorta, pulmonary artery, renal artery and left ventricular (LV) cavity.
Applying the aforementioned techniques in the neurovascular applications is however more difficult. First, the blood flow in the neurovascular (e.g. carotid arteries) is much weaker than large vessels such as aorta or pulmonary artery. The self-gating method, which mainly relies on the alteration of blood flow velocity, may become less applicable. Secondly, the cross-sectional area of neurovascular vessels, which is used to measure the through plane flow velocity, is generally small compared to the whole image FOV. The pulsation trace reconstructed by very limited k-space data, usually four to eight views, is thus more susceptible to background noise.
Thus, obtaining accurate flow-gated times synchronized with cardiac cycle is less feasible. In this article, a self-gating method with sophisticated processing was proposed for the PC flow imaging on the carotid arteries. Utilizing our algorithms, the calculated gating time exhibits highly correlated with the ECG signal recorded simultaneously by MR scanner. We will further show the consistency of flow-related parameters measured by PC flow imaging with both ECG gating and the proposed gating techniques.
Materials and Methods In vivo volunteer study
Our study population consisted of 9 healthy subjects without history of cardiovascular disease (female:3; male:6; age: 26.2 4.81 years). All MR images were acquired on a 3T clinical imager (Siemens Trio, Erlangen, Germany). The proposed radial fast low-angle shot (FLASH) sequence (10) (TR/TE=23/7.1 msec, flip angle=300, VENC=110 cm/sec, FOV=140x140 mm2, matrix size=256x256) was applied in each subject at the common carotid artery level, 1.5 cm proximal to the carotid bifurcation, using the standard birdcage head coil. In order to compare ECG and flow-derived gating times, during the imaging of two of our nine healthy subjects, the raw ECG signals were acquired and logged simultaneously from the ECG facility established in MR scanner. We were able to synchronize the ECG signal to the acquired MR signal off-line by putting markers indicating timing of each RF excitation in the logged ECG data file.
For comparison purpose, a conventional 2D FLASH sequence (TR/TE=42/6.6 msec, flip angle=300, VENC=110 cm/sec, FOV=140x140 mm2, matrix size=256x256) was also applied at identical slice position as radial FLASH of each subject with prospective ECG gating, sampling 85~90% of the cardiac cycle.
Radial phase-contrast imaging
The trajectory of radial FLASH is shown as Fig. 1(a). Each segment included eight echoes separated by 22.5°. The projection angles of next segment increased at an interval of 0.7031°, as shown in Fig. 1(a). Therefore, total 256 kinds of projection angles covered roughly whole k-space.
Self-gating algorithm and cine phase-contrast image reconstruction
The post processing procedures are as the flowchart in Fig. 1(b). For the purposes of measuring a flow-gating signal, the phase data were processed with complex-difference subtraction to retain signal from spins moving in the flow-encoded direction while eliminating signal from stationary tissue (12-15). The complex-difference signal intensity is modulated by the blood velocity of
the phase-difference method works well for measuring volumetric flow rates. Due to partial volume effect in smaller vessels such as coronary arteries or carotid arteries in our study, however, this method might overestimate the area containing moving spins and underestimate the velocity of moving spins (13). In order to measure higher SNR and more correctly flow-gating waveform from the image data itself, we reconstruct complex-difference rather than phase-difference images to derive cardiac gating times. To generate the flow-gating waveform, we used the sum of the pixel intensities of an ROI selected from the low-resolution complex-difference images (11). Each low-resolution complex-difference images was reconstructed by inverse Radon transform using 8 echoes covering roughly whole k-space, shown as Fig. 1(c-d). On the other hand, to reduce the post processing time, we also down-sampled each echo by a factor of 4 before reconstructing those complex-difference images (Fig. 1(e-f)).
Moreover, a template matching method was used to correlate the cyclic patterns of flow to derive the flow-gating times. Correlation coefficients were calculated for each offset of the template pattern with respect to the flow-gating waveform. Note that the identification of carotid artery was performed from coarse images reconstructed from only 8 echoes. Yet visual identification of carotid artery was not difficult from complex-difference images, as shown in Figs. 1(c) to (f).
This task would be difficult if judging from phase images. The magnitude and phase images of radial FLASH data in different cardiac phases were then reconstructed by re-gridding method with a 3x3 Kaiser-Bessel kernel. (….more detail on reconstructing images)
Image reconstruction and self-gating algorithm were performed using MATLAB (Mathworks, Natick, MA) with codes developed in-house on a personal computer with Pentium IV processor.
Statistics
Flow-related measurements, the cross-sectional area, mean velocity, mean flow rate and flow volume, were calculated to quantitatively compare the image qualities of conventional FLASH and radial FLASH. Correlations between flow-related parameters obtained using two different methods were assessed.
Results
Fig. 2(a) displays the simultaneously monitoring ECG waveform from MR scanner of a 27-year-old healthy male. Fig. 2(b) shows the flow-gating waveform with using complex-difference calculation and ROI selected method of the same subject and corresponding correlation coefficients. As shown in Fig. 2(b), the bold dash line in the flow-gating waveform (dash line) was selected as a template to calculate correlation coefficients. The relatively high values ( ~ 1) of correlation coefficients demonstrate the correlation method on complex-difference images was able to extract the gating information robustly even with variations in the flow-gating waveform. The flow-gating times were calculated as the local
maxima of the correlation coefficients.
As shown in Fig. 3, the histogram of projection angles, used to reconstruct the image of one cardiac phase distributed roughly uniformly through 180 degrees. Each bar in this histogram includes a range of 7.2° that stands for approximately ten kinds of projection angles, each with interval of 0.7031°. To further quantitatively compare images acquired with radial FLASH and conventional FLASH, we measured several flow-related parameters. In statistically, the correlation between the values of flow volume of 9 healthy subjects obtained with radial FLASH and conventional FLASH in our study are shown in Fig. 4. The correlation coefficient of the values of flow volume from these two sequences is at the value of 0.92. The high correlation coefficients further suggest that reliable flow measurements without ECG gating are feasible for vessels having weak flow, such as carotid arteries in our study.
Discussion
Radial scan has the inherent advantage of self-gating by retrospectively arranging each k-space line (10). The original self-gated method (10), however, is not suitable for extracting gating signal from small vessels due to weak flow. The complex-difference images, echo down-sampling, and correlation-based template-matching are all important steps for finding accurate flow-gating times and thus have strong impact on the reconstructed image quality in small vessels with weak flow.
Self-gated cardiac MRI proposed by Larson et al. (10) enable the acquisition of high temporal and spatial resolution cardiac cine images without the need for ECG gating and with no loss in imaging efficiency. Presently, the technique of flow-gated phase contrast MRI was also proposed by Thompson and McVeigh for heart and aorta that regions both with relatively strong flow (11). In our study, we further demonstrated the feasibility of flow-gated technique in small vessels with weak flow. The good agreement in image appearance and flow parameter estimations between conventional and radial FLASH suggest that reliable flow measurements without ECG gating is highly feasible. The noticeable discrepancy in the mean flow rate likely arose from different cardiac phases used in the conventional prospectively ECG-gated FLASH versus the flow-gated radial scan. Another factor that could account for the difference is that the conventional FLASH sequence acquired only 85~90% of the cardiac cycle. In conclusion, the radial flow-gated PC imaging is applicable to vessels with weak flow such as intracranial vessels.
The advantages of this method includes that the intracranial flow information can be obtained reliably without additional setting for ECG gating. Furthermore, it is potentially a helpful technique to be used for patients in the presence of arrhythmia or weak ECG signals.
References
1. ten Dam VH, Box FM, de Craen AJ, van den Heuvel DM, Bollen EL, Murray HM, van Buchem MA, Westendorp RG, Blauw GJ. Lack of effect of pravastatin on cerebral blood flow or parenchymal volume loss in elderly at risk for vascular disease. Stroke 2005;36(8):1633-1636.
2. David A. Steinman, Jonathan B. Thomas, Hanif M. Ladak, Jaques S. Milner, Rutt BK, Spence JD. Reconstruction of carotid bifurcation hemodynamics and wall thickness using computational fluid dynamics and MRI. Magnetic Resonance in Medicine 2002;47(1):149-159.
3. Papathanasopoulou P, Zhao S, Kohler U, Robertson MB, Long Q, Hoskins P, Xu XY, Marshall I. MRI measurement of time-resolved wall shear stress vectors in a carotid bifurcation model, and comparison with CFD predictions. J Magn Reson Imaging 2003;17(2):153-162.
4. Liu Y, Karonen JO, Vanninen RL, Nuutinen J, Koskela A, Soimakallio S, Aronen HJ. Acute ischemic stroke: predictive value of 2D phase-contrast MR angiography--serial study with combined diffusion and perfusion MR imaging. Radiology 2004;231(2):517-527.
5. de Boorder MJ, Hendrikse J, van der Grond J. Phase-contrast magnetic resonance imaging measurements of cerebral autoregulation with a breath-hold challenge: a feasibility study. Stroke 2004;35(6):1350-1354.
6. Damji AA, Snyder RE, Ellinger DC, Witkowski FX, Allen PS. RF interference suppression in a cardiac synchronization system operating in a high magnetic field NMR imaging system.
Magn Reson Imaging 1988;6(6):637-640.
7. Polson MJ, Barker AT, Gardiner S. The effect of rapid rise-time magnetic fields on the ECG of the rat. Clin Phys Physiol Meas 1982;3(3):231-234.
8. Rokey R, Wendt RE, Johnston DL. Monitoring of acutely ill patients during nuclear magnetic resonance imaging: use of a time-varying filter electrocardiographic gating device to reduce gradient artifacts. Magn Reson Med 1988;6(2):240-245.
9. Shetty AN. Suppression of radiofrequency interference in cardiac gated MRI: a simple design. Magn Reson Med 1988;8(1):84-88.
10. Larson AC, White RD, Laub G, McVeigh ER, Li D, Simonetti OP. Self-gated cardiac cine MRI. Magn Reson Med 2004;51(1):93-102.
11. Thompson RB, McVeigh ER. Flow-gated phase-contrast MRI using radial acquisitions.
Magn Reson Med 2004;52(3):598-604.
12. Bernstein MA, Ikezaki Y. Comparison of phase-difference and complex-difference processing in phase-contrast MR angiography. J Magn Reson Imaging 1991;1(6):725-729.
13. Polzin JA, Alley MT, Korosec FR, Grist TM, Wang Y, Mistretta CA. A complex-difference phase-contrast technique for measurement of volume flow rates. J Magn Reson Imaging 1995;5(2):129-137.
14. Thompson RB, McVeigh ER. Real-time volumetric flow measurements with complex-difference MRI. Magn Reson Med 2003;50(6):1248-1255.
15. Wedeen VJ, Rosen BR, Buxton R, Brady TJ. Projective MRI angiography and quantitative flow-volume densitometry. Magn Reson Med 1986;3(2):226-241.
Figures
Fig. 1.
Fig. 1. (a)The trajectory of radial FLASH in k-space (fixed 256 kinds of angle). The eight projection angles within a segment are 22.5° apart in each continuous TR. Next eight echoes increased by 0.7031°, such that uniform 256 projection angles covering 180 degrees. (b) Flowchart describes the procedural steps for deriving the flow-gating time and image reconstruction. (c)The complex-difference images with reduced factor of 1 that is using 8 echoes to reconstruct the coarse complex-difference images without down-sampling the data. (d) The relatively zoom in images of (c); (e) The complex-difference images with reduced factor of 4 that is we down-sampled each echo by a factor of 4 before reconstructing those complex-difference images. (f) The relatively zoom in images of (e). The time shown on the top of (c) and (e) is the time from the beginning of scan.
Radial k-space trajectory kx ky
8
1 2 4 3 5 6
7 9
10 0.7031o
22.5o
a
image reconstruction: re-gridding calculate correlation coefficient select ROI of carotid artery reconstruct complex difference
calculate signal intensity
find first cardiac cycle as template
b
c
d
e
f
Fig. 2.
Fig. 2. (a) For comparison, ECG waveform was also extracted from MR scanner of a 27-year-old healthy male. (b) The dash line is the flow-gating waveform with using complex-difference images and ROI selected method. The bold region shows the template used to calculate correlation coefficients. The solid line stands for the values of correlation coefficients.
Even with beat-to-beat variations in the flow-gating waveform from complex-difference image, the correlation coefficients were highly consistent and close to the value of 1.
a
b
Fig. 3.
Fig. 3. Histogram of projection angles. The projection angles used to reconstruct an image of one of several cardiac phases are roughly uniformly covering 180°. Each bar in this histogram includes a range of 7.2° that stands for approximately ten projection angles.
0 50 100 150
0 20 40 60 80 100
Histogram of Projection Angle (ph=27)
Projection Angle (degree)
E c ho N o.
Fig. 4
Fig. 4. The correlation of the values of flow volume obtained with radial FLASH and conventional FLASH, respectively. The high correlation coefficient implies the reliable flow measurements without ECG gating for vessels with weak flow.
y = 1.04x + 0.73 R = 0.92
3 5 7 9
3 5 7 9
flow volume of conventional FLASH (cm
3)
fl ow v ol um e of r a di a l FLA S H ( c m
3)
赴國外研究心得報告
計畫編號
NSC 97-2320-b-011-002
計畫名稱
自我運動追蹤術:應用於磁振造影血流速測定及高解析度心 臟造影術(III)
出國人員姓名 服務機關及職稱
黃騰毅
出國時間地點 96/8/15 ~96/8/29 國外研究機構 德國弗萊堡大學
工作記要:
本次研究計畫原訂前往美國哈佛大學醫學院與本人研究伙伴 Dr. Brigitte Poncelet 進行研究進度的交流,然而 Dr. Poncelet 因為近期生育而暫停研究活動,
因此本人變更計畫前往德國弗萊堡大學進行為期兩週的訪問研究。德國弗萊堡 大學在 MRI 研究界甚為知名,因為其主持人 Dr. Hennig 曾為國際醫用磁振造影 學會之主持人,其發名的技術 fast-spin-echo 更大大影響了後輩學者的相關研 究。本人對該機構慕名已久,能夠趁這次機會前往參觀,獲益良多。本人於學 期結束後,忙完學生口試及比賽事項,將所有事務交代完整之後,於 8/15 日啟 程經香港轉機,抵達法蘭克福後,再轉乘火車前往德國弗萊堡。
由於歐元節節高漲,從過去的 1:28 的年代進入到目前 1:48,而國科會差旅 費確沒能給予修正。也因此本人為節省開支起見,在中山大學資工系教授柯正 雯的幫忙下,得以用短期租屋的方式,住進距離實驗室不遠的公寓內。不但費 用比旅館便宜,而且得以自行炊煮,以渡過兩個星期的生活起居。
在經過一兩天時差調整後,本人即展開該中心的研究參訪行程。首先 Dr.
Martin 安排本人及同在弗萊堡研究的中山大學教授(電機系莊子肇、資工系柯正 雯)參觀該中心最新的儀器 G-Scan。
G-Scan 是一台永久磁鐵型低磁場 MRI,其最大的特色是掃描平台得以任意 轉動。轉動的目的在於去觀察人體站立時的醫學影像,對於 Spine 影像極為有 利,因為 spine 損傷病人往往躺著與站立時呈現不同的椎間盤壓力及位置,利用 旋轉平台,則讓醫生得以更徹底的觀察問題。整個永久磁鐵據了解為七噸重,
也就是該平台的馬達必須有極大功率才得以完成這項任務。
接著我們請 G-Scan 工程師帶我們導覽相關工程內部結構以及細部規格。下 圖左為相當特殊的肩膀線圈,圖中則為其他線圈。該機型為 2-channel 型。由於 機器設定的目標在骨胳肌肉方面,我們可以看出大部份的線圈也都與該應用相 關,如 knee, shoulder, wrist 等線圈。
而另一天的行程則安排了心臟 MRI 的實驗,然而當天病人狀況不符合實驗
要求,而因此取消了實驗,甚為可惜。
還好在 Dr. Martin 的安排下,我們得以再度參觀一組由神經科醫生所進行的 ADHD 相關實驗研究。該實驗以 diffusion tensor imaging 及 MRS 來觀察 ADHD 患者的影像表現,讓我們了解了最新的研究趨勢以及最新的 MR 儀器所能夠提 供的功能。而本人也提供了若干磁場校正經驗供實驗者參考,以期望能提供更 好的影像品質。這次的實驗參觀,我們完成了良好的互動,除了吸取新知外,
也讓德國的研究者了解了台灣研究者的堅強實力。
最後,本人被安排參觀 Dr. Hennig 為首研究團隊的 Group meeting,那個星 期剛好輪到由 Dr. Michal Markl 所帶領的心臟研究子團隊報告,使本人有機會了 解該團隊的研究近況。該 Meeting 讓本人十分震撼,研究論文之前該團隊必需報 告近況。近況包含了人員的進出情形(包含休假、新進、畢業等),研究計畫(grant ) 申請狀況,列出總共十來項,各標出(submitted, rejected, accepted, amount)等,還 有近期發表論文的狀況圖表,國際會議投稿的 abstract ,全文完成的狀況等。讓 我見識到大型研究團隊的經營之道,必需要像這樣子,時時觀察每個子團隊運 行的狀況,並了解研究進度。各團隊的成績表現也需要放在陽光下讓大家檢視,
壓力可算是不小。
接著,由兩位研究生報告研究主題及進度。第一位研究生的報告主題是想 利用 MR 相容的超音波探頭,來偵測人的呼吸運動,而藉由超音波所量得的影 像位置,同步回饋至 MRI 控制程式,用以調控心臟造影序列。而目標是訂在吸
目前的進度僅處於初期狀況,MR 相容之超音波探頭剛剛建置完成,僅獲得初步 資料,目前尚不知道用於心臟影像可能的效果。
另外一位研究生則是報告 3D 心臟影像的 k-space 安排策略。希望利用心臟 位置的準確程度來即時調配 gradient 來安排靠近 k-space 中心點的遠近。技術 focus 在橢圓型 k-space。而分配 k-space 的準則及演算法則是其中最困難的部份。
目前的研究成果還沒有很好,做出來的影像品質反而更差。但或許未來再繼續 發展突破,能夠得到更好的影像品質以及更短的掃描時間。
在這段期間內本人開始鑽研 Dr. Makl 的心臟影像相關技術,也著手進行相 關的脈衝序列程序的配合,而進一步的成果已投稿至 Magnetic Resonance in Medicine, 並且已經完成了第一次的 revision。
Hsu-Hsia Peng, Simon Bauer, Teng-Yi Huang, Hsiao-Wen Chung, J ü rgen Hennig , Bernd Jung, Michael Markl “Optimized Parallel Imaging for Dynamic PC-MRI
with Multi-Directional Velocity Encoding”之後,本人在 8/28 日離開弗萊堡,搭乘火車前往法蘭克福之後經香港轉機 回台,於 8/29 日抵達國門。
建議:這樣的國際合作對於拓展研究視野有很大的幫助,也很感謝國科會能提 供機會及經費的支持,讓此次合作得以成行。然而,如同前面描述,歐元的匯 率已經漲到一個難以想像的地步,對於出國差旅費的報支,政府是否應該給予 若干調整,特別是在歐洲大陸的地區。
國科會
補助出席國際會議報告
Annual Meeting of ISMRM 20009
“國際醫用磁共振學會第十七屆年會”
會議報告
黃騰毅副教授 台科大電機系 九十八年六月一日
行政院國家科學委員會出席國際會議補助報告
國際醫用磁共振學會第十七屆年會
2009/4/18~2009/4/24, Toronto, Canada 黃騰毅副教授 台科大電機系
一、參加會議經過
本人於 4 月 17 日從桃園中正機場出發,搭乘中華航空公司班機前往東京再 再轉機至夏威夷檀香山。本人與相關研究伙伴(包括台大、清華、中山、逢甲等 大學伙伴)一同住在會場附近的 ILLIKAI hotel,該大樓生活設施包含廚房等,讓 本人得以自行開伙準備餐點,以節省生活開銷。本次與會人士,台灣方面有超過 五十名教授、醫師、研究員、學生等參與。本人在此次會議與研究伙伴們共發表 6 篇論文,而本人所帶領的研究生共有四人參加。
二、與會心得
會議於檀香山之 Convention Center 舉行, Scientific Meetings 總共約有一千 場之 oral presentations 。本人這次與學生主要發表在兩個不同的類別,一個是穩 定態磁振造影相關,而另外則是與 HIFU 觀測相關。在 HIFU 相關的 poster 發表 上,很高興能夠與大師 Kuroda 有了接觸,進而談論到未來可能的合作機會。本 人也向他介紹了本人在 HIFU 相關的研究。另外在 SSFP 方面,SSFP fMRI 這次 的論文比較少,不像去年一次出了很多 paper。此次大會中比較令人矚目的技術 是 compressed sensing,這技術在 MRI 應用大放異采,新的論文大量的發表,Sparse signal processing 在 MRI 找到了它很好的應用。在大堂課中,比較注意到的是多
技術的結合,例如 PET-MRI 以及 HIFU-MRI,這兩項技術已經接近成熟階段,
相信在不久的未來就能夠普及。而在今年的 Young Investigator award 上面,我們 也看到 Water-Fat separation 的進階演算技術獲得了獎項,同樣在進行相關研究的 我,也感得相當興奮。而在前幾年曾經火紅的 PROPELLER 技術,今年則少了許 多,探究其原因,應該是影像重建過程過於複雜,以至於研究者仍然努力尋找其 他的替代技術的可能性。
三、考察參觀活動
由於檀香山四面環海,本人與學生曾於休息時參觀當地著名的恐龍灣保護區,玩 水,聯絡師生感情。
四、建議
建議國科會能就跨校大型研究群參與國際會議給予積極的補助。
五、攜回資料名稱及內容
ISMRM 2009 Proceeding CD-ROM 一片、ISMRM 2009 Course Syllabus CD-ROM 一片、以及廠商提供產品訊息等等。
六、附錄
本人此次發表的論文條列如下:
1. Huang, Yin-Cheng Kris; Huang, Teng-Yi; Chang, Hing-Chiu; Chung, Hsiao-Wen
"The Effect of B0 Inhomogeneity on the SSFP Dixon Technique: A Comaprison of Variants " International Society for Magnetic Resonance in Medicine, Honolulu, Hawaii, 2009
2. Huang, Yin-Cheng Kris; Juan, Chun-Jung; Chang, Hing-Chiu; Liu, Hua-Shan;
Huang, Teng-Yi; Chung, Hsiao-Wen; Chen, Cheng-Yu; Huang, Guo-Shu "Fast Multislice T2-Weighted Image Assessment of Brain with TIDE BSSFP Imaging"
International Society for Magnetic Resonance in Medicine, Honolulu, Hawaii, 2009 3. Tsai, Yi-Lu; Huang, Teng-Yi "Measuring Task-Modulated Contrasts by
Transition-Band BSSFP FMRI: A Rate-Dependence Study of Human Visual Cortical Response" International Society for Magnetic Resonance in Medicine, Honolulu, Hawaii, 2009
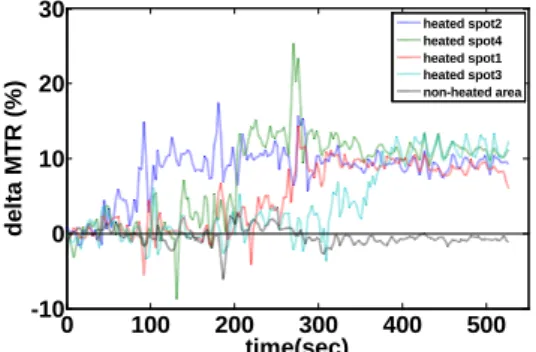
4. Lin, En-Li; Peng, Hsu-Hsia; Huang, Teng-Yi; Wang, Yu-Shun; Chen, Wen-Shiang; Tseng, Wen-Yih Isaac "Monitoring of HIFU Treatment Effectiveness by MR Imaging: An Ex-Vivo Studies with Multi-Spot Heating" International Society for Magnetic Resonance in Medicine, Honolulu, Hawaii, 2009
5. Huang, Yin-Cheng Kris; Huang, Teng-Yi; Wu, Wen-Chau; Liao, Ying-Po; Chung, Hsiao-Wen "On the Cause of Transient Off-Resonance Stopbands in TIDE BSSFP Imaging " International Society for Magnetic Resonance in Medicine, Honolulu, Hawaii, 2009
6. Tsai, Yi-Lu; Chen, Jyun-Wen; Huang, Teng-Yi; Peng, Hsu-Hsia; Chen, Wen-Shiang; Tseng, Wen-Yih Isaac "Proton Resonance Frequency Shift Weighted Imaging for the MR Monitoring of the Thermotherapy" International Society for Magnetic Resonance in Medicine, Honolulu, Hawaii, 2009
七、論文本文:
Fast Multislice T
2-weighted Image Assessment of Brain with TIDE bSSFP Imaging
Y-C. K. Huang1,2, C-J. Juan2, H-C. Chang3, H-S. Liu2, T-Y. Huang4, H-W. Chung1,2, C-Y. Chen2, and G-S. Huang2
1Department of Electrical Engineering, National Taiwan University, Taipei City, Taiwan, 2Department of Radiology, Tri-Service General Hospital, Taipei City, Taiwan,
3Applied Science Laboratory, GE Healthcare Taiwan, Taipei City, Taiwan, 4Department of Electrical Engineering, National Taiwan University of Scienece and Technology, Taipei City, Taiwan
Introduction
In clinical routine, turbo or fast spin echo (TSE or FSE) sequence is used as the standard T2-weighted imaging sequence [1]. The scan time usually takes several minutes for multislice imaging along any anatomical orientation. Obtaining all three-orientation (transverse, coronal, and sagittal) multislice information using TSE is not practical because of the long scan time. To acquire such images in a short period, a fast imaging technique is needed. Transition into Driven Equilibrium balanced steady-state free precession sequence (TIDE bSSFP, simply referred to as TIDE) [2] has been shown to carry T2 weighting as well as intrinsic fat suppression [3, 4]. The scan time of TIDE is approximately one second for a single slice scan. For a slice number of 20, a set of three-orientation scans takes only one minute or so. In this study, we propose to use TIDE for fast three-orientation multislice T2-weighted image assessment of the brain, as a supplement to the standard TSE examination along one anatomical orientation.
We quantitatively compared the image quality of TIDE with two other T2- weighted sequences, TSE and TGSE (GRASE) [5], by means of region of interest (ROI) analysis in brain tissues. The evaluations include signal intensity (SI), signal-to-noise ratio (SNR), and gray-white matter contrast-to-noise ratio (CNR).
Materials and Methods
Six volunteers (3 men & 3 women) as well as a female patient with stoke history were enrolled in this study. All images were acquired on a 1.5T system (Siemens Vision Plus, Erlangen, Germany). The sequences we used were T2-TSE, T2- TGSE, and TIDE bSSFP. TR/TE of TSE and TGSE were 3800/90 ms, while TR/TE of TIDE were 6.46/3.23 ms. TIDE-specific parameters were #180°-pulse
= 1, #ramp-step = 4, and bSSFP flip angle = 90° [2, 3, 4]. Half-Fourier function was applied to acquire T2 contrast as well as fat suppression of TIDE [3, 4]. To obtain similar image patterns, built-in fat-suppression (FS) was applied for the commercial TSE and TGSE sequences. The matrix size of TSE and TGSE is 256×250, locked by the vendor. The matrix size of TIDE is 256×256. Common parameters were: slice thickness = 4 mm, FOV ~ 240 mm. ROI analysis for image quality evaluation was performed off-line with MATLAB software. Two- tail t-test was used for statistical analysis with a p-value less than 0.05 regarded as statistically significant.
Results
Figure 1 demonstrates an axial image of a healthy man at the level of globus pallidus. The gray-white matter contrast was similar in all sequences except for the globus pallidus, of which the SI was much higher in TIDE bSSFP (Fig. 1c) that in FS-T2-TSE (Fig. 1a) and FS-T2-TGSE (Fig. 1b). Table 1 showed the ROI evaluation of anatomical structures of six volunteers, including gray matter (GM;
putamen and thalamus), iron-containing gray matter (ICGM; globus pallidus), and white matter (WM; centrum semiovale, corona radiata, and periventricular white matters). Figure 2 shows an old infarction of the female patient at left corona radiata. The hyperintensity of the lesion is similar in FS-T2-TSE, FS-T2- TGSE, and TIDE bSSFP (Fig. 2a, 2b, 2c, respectively). Figure 3 depicts a late subacute hematoma involving the right corpus striatum in the same patient. The hematoma was clearly demonstrated in both FS-T2-TSE and TIDE bSSFP images.
Discussion and Conclusion
Results from this study suggest that TIDE bSSFP is capable of acquiring fat- suppressed T2-weighted multislice images at a much shorter scan time than TSE or TGSE sequences. The SNR of TGSE and TIDE is about half of that in TSE, similar to the results in Ref. [5]. Lower SNR of TIDE can result from the use of Half-Fourier function and a higher receiver bandwidth. The CNR between GM and WM, however, is equivalent in TSE and TIDE. The CNR of ICGM subtracting WM is somewhat different: the value of TIDE is positive while those of the other two are negative. This may result from that bSSFP pulsing brings along some T1 relaxation effect, which makes TIDE less influenced by iron
compounds. Intrinsic fat suppression of TIDE is not as good as the built-in FS function in this study, possibly due to sampling center k-space slightly earlier than the off- resonance signal null [4]. Also in this study, it is found that TIDE is prone to magnetic susceptibility effect from air sinuses of inferior slices, showing an artifact of local signal drop. This is suspected to come from its gradient-echo nature. Nevertheless, considering that TIDE has a short scan time and its ability to detect pathological changes, this technique is still beneficial as a fast brain imaging. In conclusion, TIDE bSSFP can be used as a fast image assessment tool to screen pathological changes in the brain in supplement to the standard TSE examination.
References
1. Hennig J, MRM 1986;6:823 2. Hennig J, MRM 2002;48:801 3. Huang YC, ISMRM 2006 #2413 4. Huang YC, ISMRM 2006 #633 5. Fellner F, EJR 1995;19:171 FIG. 1. Axial images of a healthy man at the level of the globus pallidus:
(a) FS-T2-TSE, (b) FS-T2-TGSE, and (c) TIDE bSSFP.
a b c
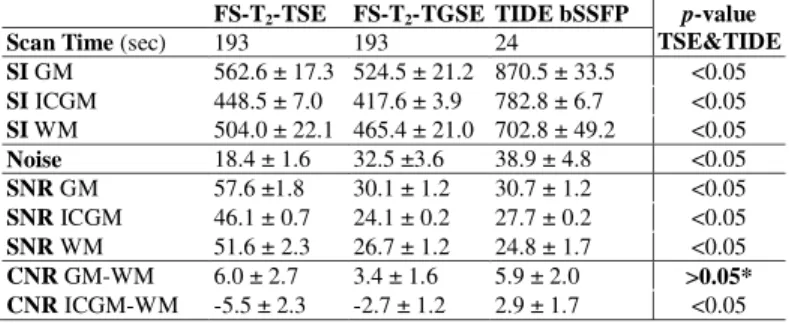
TAB. 1. Results of the ROI evaluation of anatomical structures of the six volunteers using FS-T2-TSE, FS-T2-TGSE, and TIDE bSSFP. The scan time, SI, noise, SNR, and CNR are listed (means ± S.D.). The abbreviations: GM, (common) gray matter; ICGM, iron-containing gray matter; WM, white matter.
p-values between TSE and TIDE are also listed, in which CNR between GM and WM is equivalent in both sequences. *, the p-value is 0.91.
FIG. 2. Axial images of a female patient with stroke history: (a) FS-T2-TSE, (b) FS-T2-TGSE, and (c) TIDE bSSFP. A similar hyperintense lesion at left corona radiata shows up in all three images.
FIG. 3. The image results of the same patient in Fig.
2 showing a late subacute hematoma (red arrow): (a) FS-T2-TSE, (b) TIDE bSSFP. An artifact (open arrow) can be seen in TIDE bSSFP due to magnetic susceptibility.
a b
a b c
FS-T2-TSE FS-T2-TGSE TIDE bSSFP p-value TSE&TIDE
Scan Time (sec) 193 193 24
SI GM 562.6 ± 17.3 524.5 ± 21.2 870.5 ± 33.5 <0.05 SI ICGM 448.5 ± 7.0 417.6 ± 3.9 782.8 ± 6.7 <0.05 SI WM 504.0 ± 22.1 465.4 ± 21.0 702.8 ± 49.2 <0.05 Noise 18.4 ± 1.6 32.5 ±3.6 38.9 ± 4.8 <0.05 SNR GM 57.6 ±1.8 30.1 ± 1.2 30.7 ± 1.2 <0.05 SNR ICGM 46.1 ± 0.7 24.1 ± 0.2 27.7 ± 0.2 <0.05 SNR WM 51.6 ± 2.3 26.7 ± 1.2 24.8 ± 1.7 <0.05 CNR GM-WM 6.0 ± 2.7 3.4 ± 1.6 5.9 ± 2.0 >0.05*
CNR ICGM-WM -5.5 ± 2.3 -2.7 ± 1.2 2.9 ± 1.7 <0.05
The Effect of B
0Inhomogeneity on The SSFP Dixon Technique: A Comaprison of Variants
Y-C. K. Huang1,2, T-Y. Huang3, H-C. Chang4, and H-W. Chung1,2
1Department of Electrical Engineering, National Taiwan University, Taipei City, Taiwan, 2Department of Radiology, Tri-Service General Hospital, Taipei City, Taiwan,
3Department of Electrical Engineering, National Taiwan University of Scienece and Technology, Taipei City, Taiwan, 4Applied Science Laboratory, GE Healthcare Taiwan, Taipei City, Taiwan
Introduction
Images of fat-water separation can be obtained by combining the Dixon method [1] and the balanced steady-state free precession (bSSFP) sequence [2], which is termed as SSFP Dixon method [3]. The application of this method was successful at regions of relatively homogeneous B0 [3]. Another variant of this method is the dual-TR method, which was anticipated to have a better immunity to the shimming condition [4]. In this study, we validate this concept with experiments of both methods at regions with significant B0 inhomogeneity.
Theory
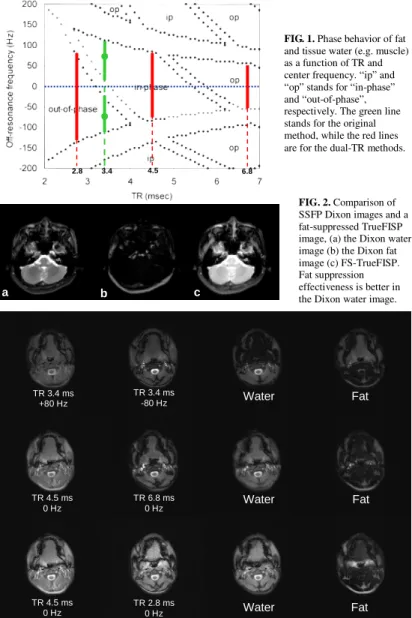
The phase behaviors between fat and tissue water (e.g. muscle) at a 3.0T environment using steady-state bSSFP sequence is shown in Fig. 1. Here “ip”
and “op” stands for in-phase and out-of-phase behaviors between the two tissues. The original SSFP Dixon method use a single TR = 3.4 ms and acquire two images with center frequency adjusted to ± 80Hz (the two green spots in Fig. 1) [3]. At the on-resonance condition (i.e. off-resonance frequency = 0 Hz), the choice of TR = 3.4 – 5.4 ms can also lead to in phase of the two tissues, or out of phase when TR < 3.2 ms or TR > 5.8 ms. Using this property, we can acquire in-phase and out-of-phase bSSFP images using two different TR’s without altering the system’s center frequency. This was then termed as Dual-TR method [4].
Also from Fig. 1, the tolerance to the B0 inhomogeneity varies in accordance with TR. In the original method, the two images are acquired already with center frequency shifted to ±80 Hz. The tolerance to resonance frequency drift will be at most ~80 Hz in each image (the two green bars). Meanwhile, an image acquired at TR = 4.5ms is anticipated to be in-phase with a frequency tolerance ~ 200 Hz (the central red bar). The out-of-phase image can be acquired at TR = 2.8 ms or TR = 6.8, while the former has a much wider shimming tolerance (the left red bar) than the later does (the right red bar).
However, using a TR as short as 2.8 ms inevitably requires the application of the partial-echo function, which may arouse one’s suspicion about the effect of an extra phase offset.
Materials and Methods
We investigated the tolerance to the B0 inhomogeneity by performing scans at head-and-neck regions, where the B0 inhomogeneity is regarded as significant.
The images were acquired on a 3.0T system (Siemens Trio, Erlangen, Germany). We used a set of TR/TE, including 3.4/1.7, 4.5/2.25, 2.8/1.26 (partial echo), 6.8/3.4 ms. Image matrix size was 128×128. Raw data were processed off-line with MATLAB software to get the calculated “water images” and “fat images”. A gradient-echo phase image of the same slice was also obtained to give an estimation of the B0 drift across the imaging plane.
TrueFISP with built-in fat suppression (FS-TrueFISP) was also performed for comparison of the fat suppression effectiveness to SSFP Dixon methods.
Results
The SSFP Dixon water image (Fig. 2a) exhibits superior fat-suppression effectiveness than that in the FS-TrueFISP image (Fig. 2c). Fig. 3 shows the image results of a female volunteer. Note that the erroneous assignment of the tongue signals mainly to the fat image in the original TR = 3.4 ms method. Fig.
4 is the gradient-echo phase image corresponding to the same slice in Fig. 3 for a rough estimation of the B0 distribution. The dental repair with amalgam on the right side has influence on B0 inhomogeneity.
Discussion and Conclusion
We have demonstrated that for body regions with significant B0 inhomogeneity, both the two dual-TR variants had a better performance than the original method in Ref. [3]. For the dual-TR methods, to shorten TR to 2.8 ms requires the use of partial echo function, or one has to use 3D slab scan to circumvent
the limited gradient switching and the possible physiological stimulations. This situation is thus somewhat unfavorable. Also, an extra phase offset may bring along some complexities into the image data when partial echo is used. Using TR = 6.8 ms for the dual-TR method is therefore considered to be more desirable. In conclusion, we compared three variants of the SSFP Dixon techniques, and validate the anticipation that dual-TR methods have a better immunity to B0 drift.
References
1. Dixon WT, Radiology 1984;153:189 2. Oppelt A, Electromedia 1986;54:15 3. Huang TY, MRM 2004;56:1328 4. Huang TY, ISMRM 2007 #1626
FIG. 3. The axial images of a female volunteer at the tongue level, showing the original method (upper row: TR = 3.4 ms with ±80 Hz adjustment), the dual-TR method version 1 (middle row: TR = 4.5 ms and TR = 6.8 ms) and the dual-TR version 2 (lower row: TR = 4.5 ms and TR = 2.8 ms using partial echo). In all three calculated water image, the tongue signals are lowest in the original method, where they are mostly assigned to the fat image. The signal intensities in the water image of dual-TR version 1 are a bit more homogeneous than those in the version 2. As seen, there are some bright signals around oropharynx in the fat image of dual-TR version 2. This is related to hyperintensity at the same region in the TR = 2.8 ms image, of which the cause is unclear.
TR 3.4 ms +80 Hz
TR 3.4 ms
-80 Hz Water Fat
TR 6.8 ms 0 Hz
TR 2.8 ms 0 Hz TR 4.5 ms
0 Hz
TR 4.5 ms 0 Hz
Water
Water
Fat
Fat
FIG. 4. A gradient-echo phase image (TR/TE = 1000/12.46 ms) of the same slice in Fig. 3 demonstrates the B0
distribution across the image plane. The dental repair with amalgam on the right side shows its influence on B0
inhomogeneity.
FIG. 1. Phase behavior of fat and tissue water (e.g. muscle) as a function of TR and center frequency. “ip” and
“op” stands for “in-phase”
and “out-of-phase”, respectively. The green line stands for the original method, while the red lines are for the dual-TR methods.
2.8 3.4 4.5 6.8
FIG. 2. Comparison of SSFP Dixon images and a fat-suppressed TrueFISP image, (a) the Dixon water image (b) the Dixon fat image (c) FS-TrueFISP.
Fat suppression effectiveness is better in the Dixon water image.
a b c
3110
Proton Resonance Frequency Shift Weighted Imaging for the MR monitoring of the thermotherapy
Y-L. Tsai1, J-W. Chen1, T-Y. Huang1, H-H. Peng2, W-S. Chen3, and W-Y. I. Tseng4
1Dept. of Electrical Engineering, National Taiwan University of Science and Technology, Taipei, Taiwan, 2Dept. of Electrical Engineering, National Taiwan University, Taipei, Taiwan, 33. Department of Physical Medicine and Rehabilitation, National Taiwan University Hospital, Taipei, Taiwan, 44. Center for
Optoelectronic Biomedicine, Medical College of National Taiwan University, Taipei, Taiwan
Introduction
Recent development of MRI-guided focused ultrasound (MRIgFUS) technology has been demonstrated the potential as a non-invasive surgical tool in many clinical settings [1].Among the MRI methods, the PRF temperature mapping is the most popular for this purpose due to its linearity, sensitivity, and near-independence of tissue type [2]. It is generally accomplished by acquiring spoiled gradient-echo sequences and transforming the obtained phase images into quantitative temperature maps [2].In addition, the magnitude images obtained in the meantime can allow the anatomical identification and also the lesion localization. Owing to the temperature dependence of most MRI parameters such as the longitudinal relaxation time T1 [3] and the proton density [4], the magnitude images obtained by the PRF-based sequences also exhibit temperature-related image contrast. In this study, we aimed to fuse the temperature-dependent phase and magnitude image by a post-processing method similar to the recently advanced susceptibility-weighted imaging (SWI) method, namely PRFSWI.
Theory
According to the past studies, the proton density (PD) is proportional to 1/T
~0.3%/
oC to ~0.7%/
oC [4]. On the other hand, the temperature dependence of the relaxation time T1 is on the order of 1%/
oC[3]. While the local temperature is elevated by HIFU heating, the PD reduction and the prolonged T1 (due to temperature elevation) both contribute to the signal drop at the heated region. In addition to the magnitude drop, the PRF shifts to a lower value while the temperature is elevated. Interestingly, the overall temperature-dependent signal behavior (both magnitude and phase) is very similar to the blood oxygen-level dependent effects of the venous blood vessels [5] except the sign of the off-resonance frequency change (SWI: the more deoxyhemoglobin, the higher PRF; PRFSWI: the higher temperature, the lower PRF)
Materials and Methods
PRFSWI post-processing was almost identical to the SWI method with the modification of the phase-mask scaling. Due to the sign reversal of the temperature-dependent PRF shift, the phase-mask of PRFSWI was modified as follows:
π θ
= π + ) , ( y x
PM if θ<0,
PM(x,y)=
0if θ≧0
Pulsed-wave HIFU pulses with power of 83 watt were performed on porcine liver tissue, immersed in 25 ℃ degassed water. Serial MR images were acquired on a 3T clinical imager (Siemens Trio, Erlangen, Germany) with the gradient-echo sequence(TR/TE:2.9ms/3.61ms, flip angle:20° , FOV: 160×
120mm
2, matrix size:128×96, slice thickness:3mm, dynamic number:40, HIFU ON/OFF: OFF (0~19 sec), ON (20~122 sec) , OFF (123~223 sec)). The acquired images were transferred to a personal computer for the PRFSWI processing with Matlab® system (Mathworks, Natick, MA, USA).
Results
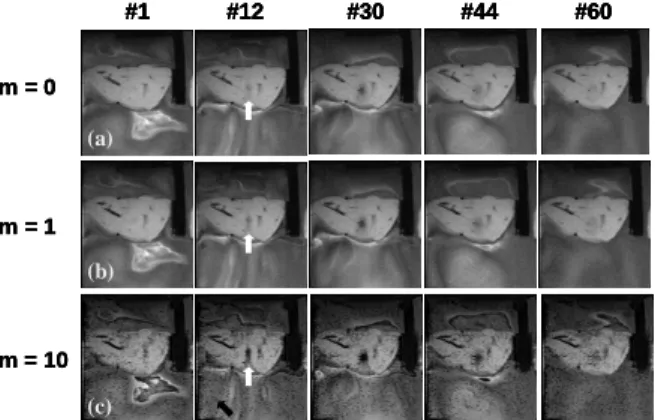
Fig.1 shows the selected PRFSWI images (multiplication factor m: 0,1,10) acquired during HIFU transmission. Note that the contrasts of the heated-spot (indicated by white arrows) increases while m-factors are higher. Fig.2 shows the quantitative curves of the averaged signal intensity and the temperature of a ROI covering the heated spot. We can notice that the signal drop of PRFSWI (m=10) is more prominent than that of the original magnitude images.
Discussion and Conclusions
In our results, the PRFSWI method enhanced the temperature-related
contrast during HIFU transmission. The raised contrast is helpful to identify focused spot during the pre-treatment procedure. After applying PRFSWI enhancement, the image contrast is significantly improved. For the HIFU monitoring applications, the PRFSWI technique combined with the optimized
m factor can be applied to enhance the visibility of the target spot. It is very helpful for treatment planning and calibration. Compared to the PRF-shift temperature quantification, PRFSWI does not need the baseline subtraction. Therefore, the problem of motion-induced subtraction error can be avoided in PRFSWI method. Moreover, the PRFSWI post-processing is fully compatible to the temperature mapping sequence.
Neither sequence modification nor the parameter adjustment is required. Therefore, the PRF-shift thermometry and the PRFSWI can be obtained Figure 1: (a) m=0, original magnitude images, (b) m=1, (c) m=10. Notice that the heated spot (white arrow) can be clearly observed in PRFSWI (b,c) images at the initial stage of HIFU heating.
#1 #12 #30 #44 #60
m = 0
m = 1
m = 10 (a)
(b)
(c)
#1 #12 #30 #44 #60
m = 0
m = 1
m = 10
#1 #12 #30 #44 #60
#1 #12 #30 #44 #60
m = 0
m = 1
m = 10 (a)
(b)
(c)
Figure 2: The signal intensity and temperature change (dotted line) of dynamic curves are ROI of heated spot of original MR gradient echo image (solid line) and PRFSWI image (dashed line).
0 10 20 30 40 50 60
0 200 400 600
Intensity
Serial Number
Comparison between intensity and temperature
0 10 20 30 40 50 60-50
0 50 100
0 10 20 30 40 50 60-50
0 50 100
°C
Heating duration
7 33
Temperature change Original magnitude PRFSWI
3023
Measuring Task-Modulated Contrasts by Transition-Band bSSFP fMRI: A Rate-Dependence Study of Human Visual Cortical Response
Y-L. Tsai1, and T-Y. Huang1
1Dept. of Electrical Engineering, National Taiwan University of Science and Technology, Taipei, Taiwan
Introduction
Recently, both transition-band and pass-band balanced steady-state free precession (bSSFP) has been shown a practical tool for functional MRI (fMRI) applications [1,2].TB-bSSFP has been shown able to detect the local proton frequency change caused by the altered concentration of the paramagnetic deoxyhemoglobin during brain functional activation. On the other hand, the fMRI sensitivity of the pass-band method is based on the intrinsic T2/T2* contrast of bSSFP[3], which is close to the BOLD mechanism. The bSSFP methods are free of geometry distortion and therefore suitable for high resolution fMRI studies [1]. However, for the TB-bSSFP method, the functional contrast depends on the complex and nonlinear phase behavior, which is quite different from the BOLD methods. Whether the functional-contrast studies using the BOLD methods and TB-bSSFP can reach the same conclusions is still not investigated. To answer this question, in our study, we designed a visual experiment to compare the stimulus-rate dependency of the functional contrast of both BOLD-EPI and TB-bSSFP.
Material and Methods
Five healthy volunteers participated in the study. The experiments were performed on a 3T whole-body MR system (Trio, Siemens) using an eight-channel head phase-array. Single-shot gradient EPI and TB-bSSFP sequences were applied with the following parameters. (FOV: 220 x 220 mm
2, matrix size:64 x 64, slice thickness=4 mm; EPI: TR/TE: 1000/40 ms, flip angle:90°, slice number:10;
TB-bSSFP: TR/TE=5/2.5ms, flip angle=4°, slice number:3). The system frequency drifts that affected the TB-bSSFP signal were reduced by real-time frequency tracking with an additional navigator echo[IIR,Wu] and the data feedback mechanism provided by Siemens ICE environment. The checkerboard stimulation paradigm consisted of nine blocks (block size:20 s, OFF: 5, ON: 4). For each scanning method, five sessions were performed with the flicker frequencies of (8,8,8,8 Hz), (6,2,4,8 Hz), (2,8,4,6 Hz), (6,4,8,2 Hz), (4,6,2,8 Hz).
The sessions of (8,8,8,8 Hz) were analyzed with the SPM2 software package. Then, an activation mask (i.e. regions covering the activation region) were extracted from t-test (p<0.001) maps generated from SPM2. To eliminate the large vessel regions, the pixels with signal change higher than 5% were excluded [4]. A time-intensity curve of each session was calculated by averaging the pixel values covered by the mask. Finally, the signal changes corresponding to the flicker rates (2,4,6,8 Hz) of both methods (BOLD-EPI and TB-SSFP) were extracted and averaged.
Results
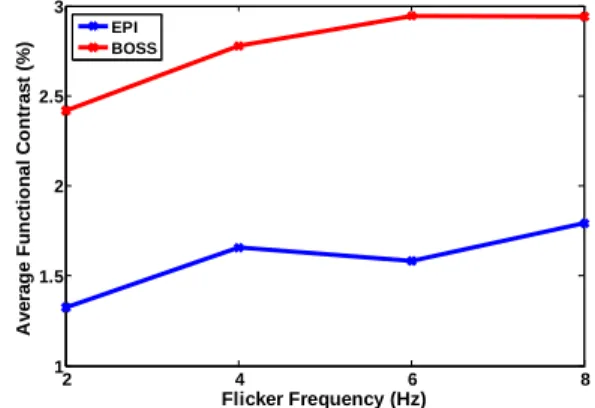
Figure 1 shows effect the frequency tracking method of TB-bSSFP. Using this method, the signal drift(green line) was effectively reduced (blue line) as previously reported [2]. Figure 2 shows the stimulus-rate dependencies of the averaged functional contrasts obtained by BOLD-EPI (blue line) and TB-bSSFP (red line). The TB-bSSFP curve shows highly correlated (CC=0.87) to the BOLD-EPI curve. Furthermore, the averaged functional contrasts obtained by TB-bSSFP are 1.75 ±0.1 times higher than that obtained by BOLD-EPI.
Discussion and Conclusions
The recently proposed TB-bSSFP is based on the steady-state phase alteration caused by the activation-related local frequency shift. The resulted phase dispersion of this technique is not linearly related to the local frequency, which is different from the conventional gradient-echo EPI. In this study, we designed an visual fMRI experiment to compare the stimulus-rate dependent contrasts obtained by two methods (i.e. gradient-echo EPI and TB-bSSFP). The order of flicker frequencies (2,4,6,8 Hz) were not fixed to avoid the potential bias of the system drifts and the feedback control of the system frequency was implemented to reduce the known signal drifting of TB-bSSFP. In our result, the data obtained by the both methods showed highly correlated. This infers that TB-bSSFP can be
applied to the studies of functional contrasts while the task-modulated brain-perfusion changes are under the perfusion elevation induced by the 8Hz-stimulus (i.e. ~46% CBF changes [4]). The comparison of both methods with higher perfusion level change (e.g. hypercapnia challenge) needs further investigation. On the other hand, the functional contrasts of TB-bSSFP show higher than that of BOLD-EPI. This suggests that, using the experiment setup (TR/TE, visual cortex) in this study, the functional sensitivity of TB-bSSFP is higher than that of BOLD-EPI. In conclusion, combined with less geometry distortion, the high functional sensitivity, and the similar contrast behavior to BOLD-EPI, TB-bSSFP is a practical tool to measure the task-modulated functional contrasts.
References
[1] Miller KL et al. MRM (2003) 50:675-83. [2] Wu ML et al, MRM (2007) 57:369-379.
[3] Miller KL et al. MRM (2008) 60:661-73. [4] Zhu XH et al, MRM (1998) 40:703-711.
Figure 1: The stabilization of TB-bSSFP signal by the feedback control of system frequency. (green line: without feedback, blue line: with feedback).
0 20 40 60 80 100
600 650 700 750 800 850 900 950
Measurment number
Signal Intensity (A.U.)
frequency tracking conventional TB-bSSFP
Figure 2: The averaged signal changes obtained with TB-bSSFP (red line) and BOLD-EPI (blue line) sequence versus flicker frequencies of the visual checkerboard stimuli.
2 4 6 8
1 1.5 2 2.5 3
Flicker Frequency (Hz)
Average Functional Contrast (%) EPIBOSS