國立台灣科技大學
National Taiwan University of Science and Technology
工業管理系
Department of Industrial Management 一百學年度實務專題報告書
Graduation Practical Project Report
專題名稱 Research Topic
台北花博之運補系統最佳化研究與 RFID 雲端存貨盤點系統設計 Flower Replenishment Logistics Research and Design of Cloud Inventory
Management System Based on RFID Technology - A Case Study on Taipei Flora Exposition
專題編號 Project Number:TR-99-01-107
指導老師:羅士哲 博士 Advisor: Dr. Shih-Che, Lo
研究組員 Researchers:
B9701015 葉佳祥 Chia-Hsiang, Yeh B9701039 張易晟 Yi-Cheng, Chang B9701055 鍾家豪 Chia-Hao, Chung
中華民國一百年十二月三十一日
December 31, 2011
II
ABSTRACT
The 2010 Taipei International Flora Exposition is open on November 6, 2010. It is authorized by the International Association of Horticultural Producers and categorized as A2B1 level. This is the first such internationally-recognized exposition to take place in Taiwan and the seventh of its kind to take place in Asia. During the Expo, an orchid exhibition will be held and more than 1,000 varieties of orchids will be on display. Moreover, there are 30 million plantings, 1,600 types, and 3,300 varieties of flower plantings in the Expo parks for displaying near six months. Among the plantings, over ninety percent was produced in Taiwan.
In order to maintain the quality of the Expo, the authority has to replace withered flowers by fresh ones. There are several challenges are faced by the authority while supplying flora products. The first consideration is how to supply all products in the shortest time, and the second is how to minimize delivery costs. In order to control temperature on vehicles for shipping flowers, we need to use trucks with refrigerator to supply flora products. After the trucks supply the flowers to the flora exposition, we need employees to make the stock check and replace the flowers, which have the life cycle problems, one by one. Hence, we categorize two big part major challenges in this case; one is flower replenishment Logistics problem. How can we supply all products in the shortest distance and how can we minimize the delivery cost. The second major challenge is that how can we use the fewest labor to check the flowers with shortest time to replace the flower, which according to the life cycle of these flowers. Therefore, we are going to divide our research into two parts for the further discussion and advanced researches on this issue. As a result, we categories our first part is Flower Replenishment Logistics for Flora Exposition and second part is Design of Cloud Inventory Management System Based on RFID Technology - A Case Study on Taipei Flora Exposition.
As we categorized two major researches, in the first research we consider Flower Replenishment Problem (FRP) as a Vehicle Routing Problem with Time Window (VRPTW). In the second research, we are going to apply Radio Frequency Identification Technology (RFID) and cloud computing into this research. Later on, we will discuss two major challenges separately and continue working on two major challenge researches for solutions.
III
摘要
2010 臺 北 國 際 花 卉 博 覽 會 是 臺 灣 首 次 獲 得 國 際 園 藝 生 產 者 協 會 (International Association of Horticultural Producers, AIPH)正式授權舉 辦 A2B1 的世界級博覽會,成為亞洲第七個主辦此類博覽會的城市,在 171 天的 展期內,展館、展場景觀所需植栽約 3,300 萬株,種類高達 1600 類,3300 個品 種,九成以上是臺灣生產的花卉植栽,配合季節及依各縣市主要生產花卉之種類 與數量,規劃花博的用花選擇,並平均照顧到全國各主要生產花卉之縣市。
為了保持台北花卉博覽會花卉的品質,首先我們必須考量如何在最短的時間 及最小的運送成本下將花卉運送至倉庫,由於要確保花卉的新鮮程度,我們必須 使用附有溫度控制的貨車進行花卉的運送。在花卉運送至倉庫後,由於每種不同 的花卉都有各自屬於的生命週期,我們需要大量的工作人員為這些花卉逐一地進 行盤點及分類,進而再替展示區的花卉進行更換。因此,在此研究中,我們將探 討「如何在最短的時間及最少的運送成本下供應花卉」及「如何降低人力成本在 花卉的盤點及資訊整合」。
在此研究中,我們將以上的問題分成兩部分加以探討,分別為「花卉補給物
流系統」及「雲端存貨系統結合 RFID 技術之應用」。
在補給物流系統部分,我們提出一套兩階段的演算法,主要是利用K-means
分群法具有的簡便性及快速分群的優勢,減少將供應商分群的時間,提早聯絡供 應商並縮短前置期,還可在訂購的同時,決定所需要的車輛數,降低車輛的使用 成本,提高整體展覽的彈性,加上基因演算法可應用於最佳化問題上的特性,以 符合各個供應商取貨的時間點為前提,在供應商群中找出最低成本路徑,並透過 電腦程式的模擬與求解,為整體展覽的補給作業提出相對應的最佳解。
在第二部分當中,我們設計了一雲端存貨系統結合了 RFID 技術,主要是能 將花卉博覽會內的花卉資訊及所有花卉供應商連接在一起加以統整,將所有資訊 儲存在後端架設的雲端存貨系統,讓資訊傳遞更迅速及透明化。除此之外,工作 人員還能利用手持式的 RFID 讀取器進行花卉的盤點並直接與此雲端存貨系統連 線進行資訊的確認及更新。
IV
APPRECIATIONS
For past two semesters of our undergraduate study in industrial management, we have many thanks to those who assisted me to finish our project. First of all, we would like to appreciate our advisor Dr. Shih-Che Lo. Without his inspiration and guidance, we can’t overcome many problems and challenges in the process of finishing this project. We do learn a lot from him. Thank you so much.
Also, we would like to thank all ISE lab members, who have given us generous support and helpful advice during the past years. They have provided us great help and comprehensive supervision through the two semesters. We have benefited a great deal from their advice and suggestions.
During this project, we have learned a lot of skills such as writing theses, developing programs, even team work. We do our best in the process of this project.
Last, we hope we will entertain positive and diligent attitude in the future.
V
CATALOG
ABSTRACT ... II 摘要... III APPRECIATIONS ... IV FIGURES ... VI TABLES ... VI
CHAPTER1 Flower Replenishment Logistics for Flora Exposition ... 1
1.1 Introduction ... 1
1.2 Mathematical Formulation ... 3
1.2.1 The KG Algorithm ... 5
1.2.2 K-means Algorithm ... 5
1.2.3 Genetic Algorithm ... 7
1.3 Experimental Results ... 8
1.4 Conclusions ... 10
TRANSITION... 11
CHAPTER2 Design of Cloud Inventory Management System Based on RFID Technology ... 12
2.1 Introduction ... 12
2.2 Research Methodology :Inventory Management ... 15
2.2.1 Acquisition ... 15
2.2.2 Redeployment ... 16
2.2.3 Termination ... 16
2.3 System Structure ... 17
2.3.1 Could Computing Data Base ... 17
2.3.2 Radio Frequency Identification Technology (RFID) ... 18
2.4 The result by using CIM and RFID system in Taipei flora exposition ... 19
2.4 Conclusion ... 27
Final Conclusions and Recommendations ... 28
REFERENCE ... 29
VI
FIGURES
FIG.1K-MEANS ALGORITHM. ... 6
FIG.2GENETIC ALGORITHM. ... 9
FIG.3INVENTORY MANAGEMENT SYSTEM STRUCTURE. ... 15
FIG.4CLOUD INVENTORY MANAGEMENT CONNECTED WITH DATABASE AND ERP BASED ON RFID TECHNOLOGY. ... 17
FIG.5RADIO FREQUENCY IDENTIFICATION WITH CIM STRUCTURE. ... 19
FIG.6CIM BASED ON RFID TECHNOLOGY IN TAIPEI FLORA EXPOSITION CASE STUDY STRUCTURE. ... 22
TABLES TABLE 1COMPARISONS BETWEEN HEURISTIC METHODS. ... 10
TABLE 2DA-CHIA RIVER SIDE AREA. ... 23
TABLE 3YUAN SHAN PARK AREA ... 24
TABLE 4FINE ARTS PARK AREA ... 25
TABLE 5XIN SHENG PARK AREA. ... 26
1
CHAPTER1 Flower Replenishment Logistics for Flora Exposition 1.1 Introduction
The 2010 Taipei International Flora Exposition is authorized by the International Association of Horticultural Producers and categorized as A2B1 level. This is the first such internationally-recognized exposition to take place in Taiwan and the seventh of its kind to take place in Asia. During the Expo, an orchid exhibition will be held and more than 1,000 varieties of orchids will be on display. Moreover, there are 30 million plantings, 1,600 types, and 3,300 varieties of flower plantings in the Expo parks for displaying near six months. Among the plantings on display, over ninety percent was produced in Taiwan. In order to maintain the quality of the Expo, the authority has to replace withered flowers by fresh ones. The replenishment operation must be designed in such a way that each supplier is visited only once by exactly one vehicle, all routes start and end at the Expo, and the total supplies from the suppliers on one particular route must not exceed the capacity of the refrigerated trucks. Also, trucks travel from points to points followed existing time constraints in order to keep flowers fresh.
Two major challenges are faced by the authority while supplying flora products.
The first consideration is how to supply all products in the shortest time, and the other is how to minimize delivery costs. To control temperature on vehicles for shipping flowers, trucks with refrigerator are used to supply flora products. The efficiency of supplying flora products becomes critical due to short product life cycle and quick response for the authority requirements. In addition to increasing the quality of the Expo and decreasing supplying cost, increasing efficiency of supply chain is also considered as the third source of profit. To quickly respond to the authority demands, logistics providers can increase the number of trucks, so suppliers’ waiting time can be reduced. However, the costs related to the size of the trucks fleet and transporting goods were very significant and are growing rapidly (Alvarenga and Mateus, 2004).
How to develop optimal routes dynamically for each truck serving a group of suppliers and decrease the total cost while satisfying the authority requirements becomes significant important.
2
Flower replenishment problem (FRP) adds complexity of allowable delivery times, or time window constraints, stemming from the fact that suppliers request the earliest and the latest service times. FRP has been an intensive research and can be formulated as the model the flower replenishment operation in 2010 Taipei Flora Expo. Early works on the vehicle routing problem (VRP) can be served as solutions for the FRP, including both exact and heuristic approaches. The computational time required to solve a VRP to optimality was studied by Desrochers et al. (1992). FRP as well as VRP is a well-known NP-hard problem, many researches provided various heuristics methods to solve the problem in the literature. Therefore, heuristic methods often produce optimal or near optimal solutions in a reasonable amount of computer time. Besides, heuristics have been found to be very effective and efficient in solving a wide range of practical size VRP (Solomon and Desrosiers, 1988).
In recent years, Tan et al. (2001a) is the first to document the implementation of artificial intelligent methods for VRP, together with their comprehensive results.
Cheng and Wang (2009) decomposed the VRP into a clustering problem (main problem) and a set of traveling salesman problem (TSP) with time window constraints.
To solve the TSP, a genetic algorithm (GA) was developed with a simple heuristic algorithm. The core of the GA is the simulation for biological natural evolution phenomenon, which uses the simple code mechanism and the evolution system for solving complex problems. Thangiah et al. (1991) were the first to apply a genetic algorithm to VRP. A heuristic search strategy based on GA was implemented by Thangiah (1993) .This paradigm uses a cluster-first route-second approach to solve the VRP. Bräysy and Gendreau (2001) proposed the findings indicate that the results obtained with pure genetic algorithms were not competitive with the optimal results, though the differences are not overwhelming. Lau et al. (2003) introduce the concept of a holding list, a data structure containing the unserviced customers. In the beginning, all customers are in the holding list, then the simple relocate and exchange operators are used to transfer customers back and forth from the holding list. Chunhua (2010) improved GA to overcome the shortcomings of premature convergence and slow convergence of conventional GA. Zhu (2000) pre-set the number of vehicles that is going to be used in the solution. Wang et al. (2008) designs the customer clustering assignment algorithm, which can help achieve the initialization of the GA and provides a new method for VRP customer clustering assignment.
MacQueen (1967) proposed the standard K-means clustering algorithm is used to find a set of k processing unit centers which represent a local minimum of the total
3
squared Euclidean distances E between the N exemplars and the nearest of the k centers. There existed efficient algorithms for finding locally optimal partitions of the sample points into k clusters by Hartigan and Wong (1979). Krishna and Murty (1999) designed new operators in their hybrid scheme. In order to achieve global search and fast convergence, they have proposed a new genetic K-means algorithm (GKA) that combines a genetic algorithm with a gradient descent algorithm and the K-means algorithm.
This paper proposes a two-stage algorithm combining the K-means algorithm and the genetic algorithm, called the KG algorithm, to efficiently and effectively solve the flower replenishment operation in 2010 Taipei Flora Expo. Since suppliers usually form the Industry Cluster, our first step is to find the minimum required number of trucks, and the second phase is to determine the route that minimizes the total traveling distances of total trucks.
1.2 Mathematical Formulation
We define the FRP as follow: given a fleet of K trucks located at the Expo to N suppliers. All trucks have the same capacity q. Suppliers i has a supply of gi (for i = 1, …, N), gi < q, and must be serviced within specified time window [ei, li]. That is, a truck has to arrive after ei, but before li. For each truck, we need to find a path that begins at the Expo, visits a subset of suppliers, and then returns to the Expo without violating the capacity constraints and the time window constraints. The dij denotes the distance from supplier i to supplier j. Generally, the transportation costs include fixed costs, such as trucks purchase and depreciation, and variable costs, such as fuel consumption. Variable costs are directly related to traveling distance of the vehicle, while fixed costs are allocated to the trucks also based on its traveling distance. Hence, we consider the objective is to minimize the number of trucks, and the total length of all routes. We denote the position of the Expo as node 0 and suppliers by 1, 2, ..., N, and define notations as follows:
otherwise.
, 0
, supplier to
supplier from
travels truck
if ,
1 k i j
xijk (1)
Truck arrival time at supplier j:
4
,
1,2,...,
,0 1
N j
s t t x t
N
i K
k
i ij i ijk
j
with t0 = 0. (2)
Also,
tij = time for traveling from supplier i to supplier j, for i, j{1, 2, …, N};
si = service time of customer i, for i {1, 2, …, N}, with s0 = 0.
tcijk =the transportation cost of vehicle k from customer i to j.
ck = fixed cost of vehicle k.
The objective of the problem is defined as follows:
K
k N
j
jk k N
i N
j K
k
ijk
ijX c X
tc Z
1 1
0
0 0 1
Minimize (3)
Subject to:
; 0 ,
1 1
i K x
N j
K
k ijk (4)
1,2,...,
; ,0 , 1
1
K k
i x
N
j
ijk
(5)
1,2,...,
; ,1
0 1
N i
x
N j
K
k ijk
(6)
1,2,...,
; ,1
0 1
N j
x
N
i K
k
ijk
(7)
1,2,...,
; ,0 0
K k
q x g
N
j ijk
N
i i
(8)
1,2,...,
.,i N
l t
ei i i (9)
The objective, equation (3), is to minimize the sum of the number of trucks and the length of all routes. Equation (4) limits the number of trucks dispatched from the Expo must less than the total number of vehicles K. Equation (5) make sure that the flow conservation law holds, that is, each truck goes out from the Expo and needs to returns to it; Equations (6) and (7) ensure that a supplier is served exactly once and also served by only one truck; Equation (8) is the truck capacity constraints and equation (9) is the time window constraints.
5
1.2.1 The KG Algorithm
The solution procedure for the KG algorithm for the FRP described in the previous section is a two-stage process. The first step is to divide all supplier nodes into K clusters by minimizing the number of required trucks. The second step is to determine each route to minimize the total traveling distance of total trucks. The K-means algorithm and the genetic algorithm will serve as the main engine for step 1 and step 2 respectively. The following describes the two algorithms.
1.2.2 K-means Algorithm
The K-means algorithm is a popular clustering algorithm known for its observed speed and its simplicity. The aim of the K-means algorithm is to divide M points in N dimensions into K clusters so that the within-cluster sum of squares is minimized. We consider each cluster does not exceed the capacity of truck and minimum required number of trucks.
Notations:
Ci the set of all clusters, i = {1, 2, …, k};
Si the set of all supplier nodes, i = {1, 2, …, N};
gi supply of supplier nodes i, i = {1, 2, …, N};
q the capacity of truck;
Mi the centre of mass of Ci cluster, i = {1, 2, … , k};
i the average of Ci cluster, i = {1, 2, …, k}.
Objective:
k
i S C
i i
i i
S
1
2;
M in (10)
Subject to:
; q g
i
i C
S
i
(11)
: () () , * 1,2,...,
;) (
* i k
M S M
S S
Cit i i it i it (12)
1 .
)
) (
( ) 1
(
t i
i C
S t i i t
i S
C
M (13)
6
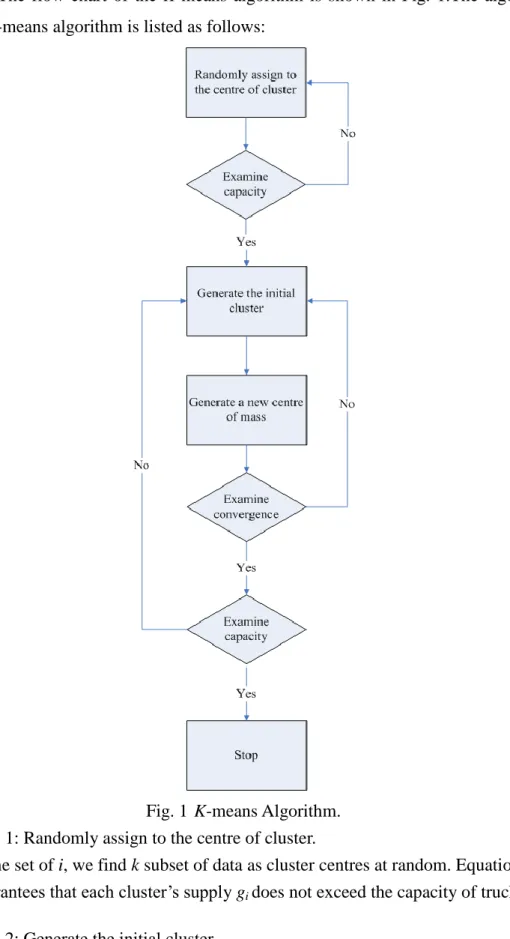
In above model, the objective function (10) minimizes the within-cluster sum of squares. The flow chart of the K-means algorithm is shown in Fig. 1.The algorithm for the K-means algorithm is listed as follows:
Fig. 1 K-means Algorithm.
Step 1: Randomly assign to the centre of cluster.
In the set of i, we find k subset of data as cluster centres at random. Equation (11), guarantees that each cluster’s supply gi does not exceed the capacity of truck q.
Step 2: Generate the initial cluster.
Calculate each data to a distance between each random centre of cluster. Then,
7
compare the data and determine which one is the closest to the random centre of cluster. This data will be assigned to the closest centre of cluster. Furthermore, it will form a cluster boundary resulting in a collection of the initial members of the cluster.
Step 3: Generate a new centre of mass.
According to each data within the borders, use Equation (12) to recalculate the cluster centre of mass. The previous random cluster is replaced by the new centre of mass to be the centre of the cluster.
Step 4: Change the boundary of cluster.
After assigning the new centre of mass by Equation (13), compare the distance between each data to the new centre of cluster. According to the distance, reallocate each data which belongs to the cluster. Repeat step 3 and step 4 until cluster members do not change, or exceed the capacity constraint.
Therefore, we have the outcome of K-means algorithm as clusters of suppliers and the minimum required number of trucks.
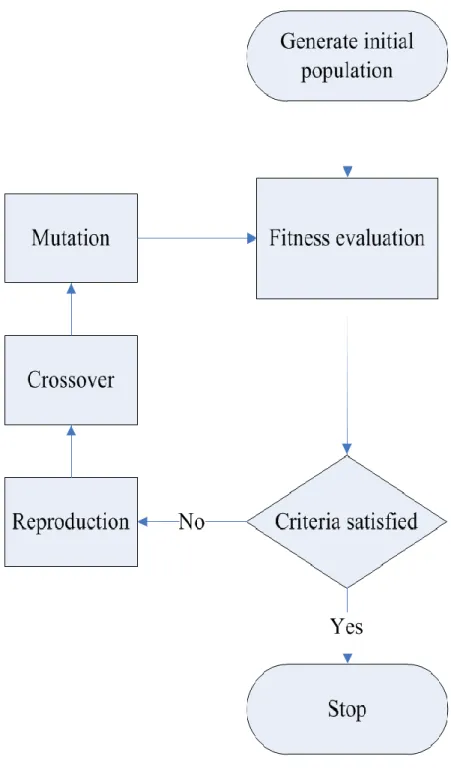
1.2.3 Genetic Algorithm
The GA is a randomized search technique and an adaptive heuristic search method based on population genetics. The search is guided by the fitness value of each individual. A GA process can be summarized as follows:
Step 1: Representation.
Encode the characteristics of each individual in the initial population as a chromosome. Typically, a chromosome is a bit string. Set the current population to this initial population. In our problem, the chromosome is the order of the sequence visited by trucks.
Step 2: Reproduction.
Select two parent chromosomes from the current population. The selection process is stochastic, and a chromosome with high fitness is more likely to be selected.
8
Step 3: Crossover.
Generate two offspring from the two parents by exchanging pieces of genetic material.
Step 4: Mutation.
Apply a random mutation to each offspring with a small probability.
Repeat steps (2), (3), and (4), until the number of chromosomes in the new population is the same as in the old population. Moreover, set the current population to the new population of chromosomes. This procedure is repeated for a fixed number of generations, or until convergence to a population of similar individuals is obtained. Then, the best chromosome generated during the search is decoded into the corresponding individual. The fitness function in the genetic algorithm is used to evaluate the performance of a chromosome which is the optimality of a set of decision variable values. That is, the fitness function of the GA is set as the objective function in our problem.
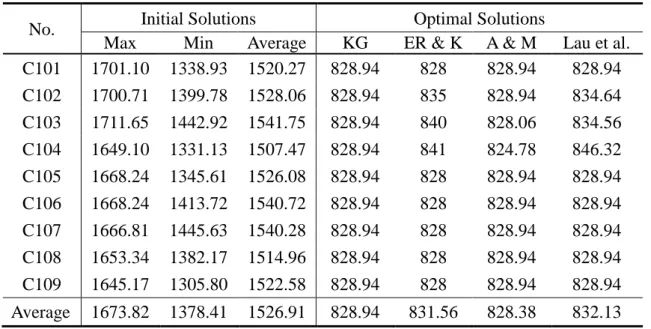
1.3 Experimental Results
A set of FRP test instances was created with 100 suppliers and various time constraints. The proposed KG algorithm was executed 30 times for each instance along with three methods from literature: El Rhalibi & Kelleher (2003), Alvarenga &
Mateus (2004), and Lau et al. (2003). Table 1 shows the result of our experiments.
“Initial Solutions” column shows the initial solution quality for repeating experiment for 30 times with average and maximum/minimum values. All the values in the table are the total traveling distance beginning from Expo and back to Expo for different methods.
9
Fig. 2 Genetic Algorithm.
10
Table 1 Comparisons between heuristic methods.
No. Initial Solutions Optimal Solutions
Max Min Average KG ER & K A & M Lau et al.
C101 1701.10 1338.93 1520.27 828.94 828 828.94 828.94 C102 1700.71 1399.78 1528.06 828.94 835 828.94 834.64 C103 1711.65 1442.92 1541.75 828.94 840 828.06 834.56 C104 1649.10 1331.13 1507.47 828.94 841 824.78 846.32 C105 1668.24 1345.61 1526.08 828.94 828 828.94 828.94 C106 1668.24 1413.72 1540.72 828.94 828 828.94 828.94 C107 1666.81 1445.63 1540.28 828.94 828 828.94 828.94 C108 1653.34 1382.17 1514.96 828.94 828 828.94 828.94 C109 1645.17 1305.80 1522.58 828.94 828 828.94 828.94 Average 1673.82 1378.41 1526.91 828.94 831.56 828.38 832.13
According to the table, all methods that we tested were able to find near-optimal solutions. The near-optimal values were almost half of original initial solutions. The proposed KG algorithm was able to find the consistent solutions for all nine test instances.
1.4 Conclusions
In this paper, we considered flower replenishment operation as a special type of vehicle routing problem, which can be described as the problem of designing least cost routes and required trucks. Hence, we formulated the flower replenishment operation in 2010 Taipei Flora Expo as the flower replenishment problem in this study.
We proposed a two-stage algorithm, the KG algorithm, combining the K-means algorithm with the genetic algorithm to provide feasible and near-optimal solutions for the Expo’s daily operations. Base on the experiment results, the KG algorithm showed significant cost reduction and traveling time saving while compared with traditional methods. The optimal operation could keep flora products fresh with shorter traveling time. Moreover, the authority has more time to replace withered flowers by fresh products and deals with other daily operations. Therefore, the Expo’s quality will be improved in order to provide excellent exhibitions.
11
TRANSITION
After we did a research on flower replenishment operation for the Taipei Flora Exposition, we apply the heuristic method into practical. We consider this case is a VRPTW Problem and we applied some algorithm to figure out the best solution to save the truck traveling time to supply flowers to Taipei Flora Exposition. Also, we did have a significant cost reduction while comparing with the traditional method.
Our first part for Taipei Flora Exposition Case has concluded many improvement of your research and the performance of our application in this case. After that, we will move on the next part for the Design of Cloud Inventory Management System Based on RFID Technology - A Case Study on Taipei Flora Exposition. In this case, we know that in Taipei Flora Exposition, we need a lot of employees to take care of different kinds of flower every day and replace the new one according to its life cycle.
However, in this huge Exposition, we speech too much money on taking stock and replace the flowers every day. Respecting this issue, we are going to design an inventory management system based on RFID Technology to apply in this case to minimize the labor cost and traveling cost for replacing the flowers. Besides, we will combine the cloud computing technique with our inventory system to run the whole flower supply chain for Taipei Flora Exposition. The Part 2 will be our second part of our research for this case.
12
CHAPTER2 Design of Cloud Inventory Management System Based on RFID Technology
2.1 Introduction
In today's society, science and technology in rapid development, abundant products, improving quality and using advanced technology are more and more diverse. As an important part of the supply chain management, inventory control has direct impact on the overall effectiveness of the supply chain, such as maintaining production process continuity, cost-sharing orders, in a timely manner to meet customer needs. Inventory faces issues, such as overstock, shortage and cost of risk.
How to prevent inventory risk and setup the inventory in a reasonable level is a problem to every business. Appling technologies in supply chain management play a key role in the prevention of inventory risk. Advanced information technology can optimize and reorganize of the various nodes on the supply chain, achieve sharing information on all nodes of the supply chain, understand customer needs in real-time, reduce inventory levels, and improve purchasing and delivery accuracy, reducing the inevitable information distortion in the supply chain, improve the supply chain imbalance as the result of information asymmetry, provide enterprises with real-time information, thereby reduce the bullwhip effect on the supply chain. Moreover, in a rapid development of technology, the initial of stage of cloud computing is also a good choice to implement in inventory management system.
Cloud Computing is one kind of emerging business accounting model. It calculates the duty to distribute on the resource pool with massive computers constitute, enabling each kind of application system according to the need to gain the computation strength, the storage space and all kinds of software services. This kind of resource pool is called “the cloud.” “The cloud” is virtual computation resources that can maintain and manage itself, usually for some large-scale server cluster, including calculating server, storage server and so on. The Cloud computing will integrate all computation resources, and can be managed automatically through the software without intervene. This is favorable to innovation and reduces cost and also can be integrated in our inventory management system.
13
RFID is considered as the main technology for realizing the ubiquitous environment by providing the identity to the physical object. The RFID tag, which is consisted of an antenna, transceiver, and integrated circuit with memory, has been widely used for supply chain and inventory management to increase the business efficiency. Also, it can be used for ID badges, access control, fleet maintenance, equipment and parts maintenance, parking log access control, toll gate system, car tracking, manufacturing line control, etc. The tag is attached or integrated to an object, such as a product that can be read by RFID reader and then identify the object with the information in the tag. In general, RFID tags tend to be mobile and readers are stationary. This is the typical architecture for the well known RFID application such as supply chain management. However, we can easily think the RFID applications that both of RFID tags and readers to be mobile. This kind of RFID reader is referred to as portable RFID reader or mobile RFID reader. In this case, the handheld of the mobile RFID reader can read the tag and get the information of the tagged object at any time and in any place. This is provided by the fact that the mobile RFID reader can easily connect the RFID to server in any place via wireless communication network.
Implementing information technology to accelerate and smooth the physical flow of goods through a supply chain is significantly more valuable than using information technology to expand the flow of information [1]. Traditional inventory management method can’t meet the requirement because the events of the each link based on the supply chain of products are synchronized under the environment of supply chain management [2]. The effective inventory management is crucial in terms of reducing operational costs. The newly emerged narrowcasting technology enables the integration of promotion and inventory management activities in a real time manner [3]. In addition, Liu [4] analysis the effect of RFID technology in reducing inventory levels, mastery real-time inventory information, improve inventory management capabilities, and presents information feedback security protocols.
Cloud computing can connect millions of computers to super cloud and the application field the merit of cloud computing, such as, it do not need user’s high level equipment to reduce the user’s cost. It provides secure and dependable data storage center, so user do not need to do redundant things of storing data and killing virus. This kind of task can be done by professionals [5]. In addition, cloud computing
14
has taken commercial computing by storm. Cloud computing platforms provide easy access to a company’s high-performance computing and storage infrastructure through web services. With cloud computing, the aim is to hide the complexity of IT infrastructure management from its users. At the same time, cloud computing platforms provide massive scalability, 99.999% reliability, high performance, and specifiable configurability [6]. Besides, Cloud computing can be viewed from two different aspects. One is about the cloud infrastructure which is the building block for the up layer cloud application. The other is of course the cloud applications. By means of three technical methods, cloud computing has achieved two important goals for the distributed computing: high scalability and high availability [7].
Nowadays, the cost of introducing RFID technology in an application is not generally a barrier and RFID can be implement to manage and control the rotation of returnable transport item [8]. In this study, we have conducted great effort on inventory management. Inventory management based on RFID can be tracked more accurately in real time, resulting in reduced processing time and labor. The complete visibility of accurate inventory data throughout the intelligent management system from tags to portable reader brings opportunities for transformation and improvement in mass inventory stocking [9]. In addition, in our case, we may consider about the life cycle of product. Researchers have developed various models for production planning and control, the collection of end-of-life products from the suppliers to customers [10]. The benefits of RFID have been discussed in many articles.
According to the article by Lapide [11], RFID benefits manufacturing suppliers with operational efficiencies and integrated supply chains. Many examples show supply chain benefits being realized with RFID including elimination of human errors, errors in product processing, improve operator efficiency, reduce out-of stock rate, and eliminate the need for human operators to key in ID codes [12]. Companies can expect to benefit from RFID in a number of ways such as flexibility, responsiveness, enhanced service, control, and improved security [13].
15
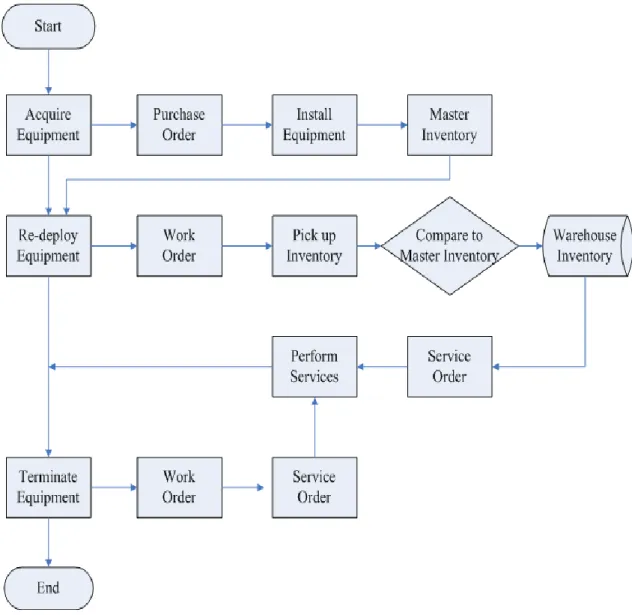
2.2 Research Methodology :Inventory Management
Fig. 3 Inventory Management System Structure.
Inventory Management is an enterprise-wide discipline concerned with the identification and tracking of Information Services (IS) hardware and software assets.
Its three main areas of concern are: acquisition, redeployment, termination.
2.2.1 Acquisition
Acquisition procedures are established to assist personnel in procurement of software and hardware products. Its main purpose is to ensure that proper justifications are performed and that financial guidelines. Acquisitions require
“Purchase Orders” to track and authorize the purchase, while the actual installation of equipment is performed by the Infrastructure or Facilities Management Department.
16
Once added to the environment, a Master Inventory record is created to describe the newly added equipment and its components. Inventory records can be used to calculate the resale price of existing equipment, when planning for an upgrade / replacement or reduction in size. The Inventory Report can be used to inform buyers of your stock and obtain bids on the purchase of your surplus equipment.
2.2.2 Redeployment
Redeployment procedures are responsible for ensuring that assets are tracked when moved from one location to another and that budgetary considerations are adjusted as needed. Should a product be moved in from its original owner, then the Inventory System is updated to reflect the new location and owner. Redeployment requests can generate transportation activity (pick-up and delivery of equipment), facilities management activity (disconnecting device, data wipe, reconnecting device, etc.) and inventory management update, and service activities associated with the device(s) being moved.
2.2.3 Termination
Termination is responsible for deleting the asset from the inventory when it is discontinued, or replaced. The owner's budget will be updated to reflect the asset termination and the asset will no longer be listed when location reports are generated.
Whenever equipment is being terminated (even if for donation to charities or employees) a data wipe operation must be performed to eliminate any sensitive information from the hard drive. Additionally, a certified vendor must be utilized to insure that the computers components are disposed of in an environmentally friendly manner. This scrapping process must be certified, so that legal and civil penalties are no longer the responsibility of the terminating firm but rather the scrapping organization.
17
2.3 System Structure
2.3.1 Could Computing Data Base
Product n
Wireless Communication
Internet (Wired/Wireless) CIM System
RFID Reader
Database
Product 3
RFID Reader Product 2
RFID Reader Product 1
RFID Reader
Client n
Supplier n Client 3
Supplier 3 Client 2
Supplier 2 Client 1
Supplier 1
ERP
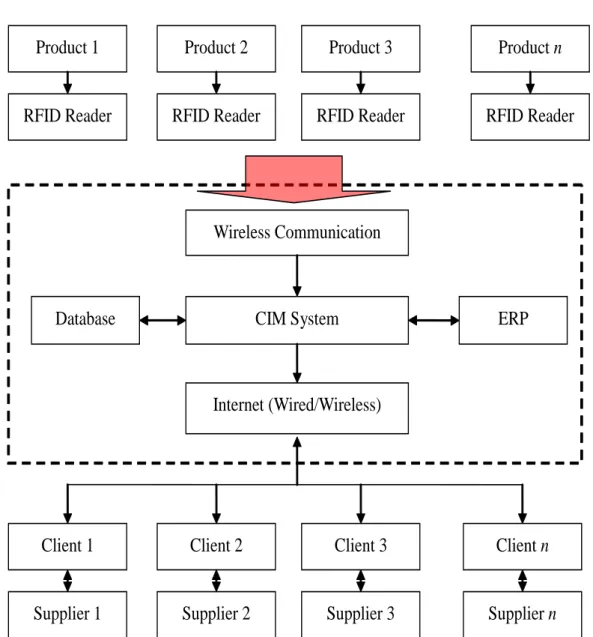
Fig. 4 Cloud Inventory Management Connected with Database and ERP based on RFID technology.
Cloud storage is amorphous today, with neither a clearly defined set of capabilities nor any single architecture. Choices abound, with many traditional hosted or managed service providers (MSP) offering block or file storage, usually alongside traditional remote access protocols or virtual or physical server hosting. The Taneja Group defines cloud storage as a specific category within the larger field of “storage in the cloud” solutions. Storage in the cloud encompasses traditional hosted storage, including offerings accessed by FTP, WebDAV, NFS/CIFS, or block protocols either remotely or from within a hosted environment. Cloud storage is an evolution of this
18
hosted storage technology that wraps more sophisticated APIs, namespaces, file or data location virtualization, and management tools, around storage. Figure 4, for the system of cloud inventory management connected with database and ERP based on RFID technology, shows the evolution of Cloud Storage based on traditional network storage and hosted storage.
There are hundreds of different cloud storage systems. Some have a very specific focus, such as storing Web email messages or digital pictures. Others are available to store all forms of digital data. Some cloud storage systems are small operations, while others are so large that the physical equipment can fill up an entire warehouse. The facilities that host cloud storage systems are called data centers. At its most basic level, a cloud storage system needs just one data server connected to the Internet. A client (e.g., a computer user subscribing to a cloud storage service) sends copies of files over the Internet to the data server, which then records the information. When the client wishes to retrieve the information, he or she accesses the data server through a Web-based interface. The server then either sends the files back to the client or allows the client to access and manipulate the files on the server itself.
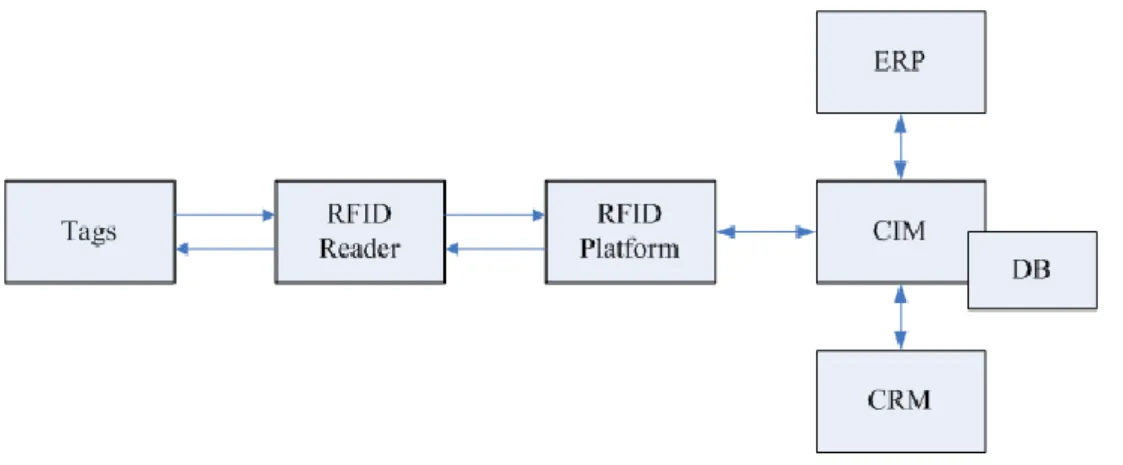
2.3.2 Radio Frequency Identification Technology (RFID)
RFID is an automatic identification technology that can be used to provide a unique ID to a physical object. A typical RFID system consists of RFID reader(s), tags, RFID platform, RFID database, and RFID services. Communication in RFID occurs through radio waves, where information from a tag to a reader or vice versa is sent via an antenna. Unique identification is stored in RFID tags, which can consist of serial numbers, security codes, product codes, and other object specific data [14]. It is well known that RFID technology has many benefits over other identification technologies because it does not require line-of-sight alignment, multiple tags can be identified almost simultaneously, and the tags do not destroy the integrity or aesthetics of the original objects [15]. To achieve interoperability of RFID device and exchangeability of RFID information, various standards of protocols are proposed for different applications. Among them, the Electronics Product Code (EPC) [16] or EPC global plays the main role in standardizing and developing hardware physics, communication protocols, the EPC network infrastructure specifications, and so on.
19
Tags can either be active or passive. The active tag has a power source whereas the passive tag does not. Note that the passive RFID powers up and exchanges commands/responses by gathering energy from RF transmitted from the reader antenna [14]. Due to the battery-less characteristic of the passive RFID, it has been considered to be widely used in various applications. In this research, we assume that passive RFID tags are attached to physical objects.
Fig. 5 Radio Frequency Identification with CIM structure.
2.4 The result by using CIM and RFID system in Taipei flora exposition
In such a special period and environment condition, how to maintain the quality of the exposition will be a big challenge. The authority has to replace withered flowers by fresh ones. Two major challenges are faced by the authority while counting flora products. The first consideration is how to use less labors to get all flowers data within the shortest path, and the other one is how to reduce counting time. Labors, for serving in Taipei Flora Exposition, need to count of every flower manually. It means that we have to walk every route for every flower and need a lot of papers works to check the flowers life cycle, replacement date, planted date, and etc. These paper works not only need a lot of labors to deal with but also take a lot of time to process these data. What`s worse, we will waste a lot of time to walk every route for counting.
These problems will increase our labors cost and time cost greatly in this case.
Therefore, we will implement CIM system into this case.
At the beginning of applying this technology into this case, we need to divide all flowers into different areas, different blocks, and different batches in order. After clustering flowers, we will embed RFID tag into every batch of flowers with name data, life cycle data, region data and etc.
20
For the CIM system used in Taipei Flora Exposition, we use cloud database to integrate current data. When inventory personnel count, they use handheld reader to check, revise, and confirm the amount of flowers after connecting with the end users in the cloud. With the integration of cloud computing database, rear end users can easily get the amount of flowers and RFID tags. Preparation for the system is to collect data for different flowers into RFID tags, classify flowers, and input in electronic database for integration when flower and RFID tags suppliers transport products to warehouse.
Before we apply cloud inventory management system into this case, labors, for serving in Taipei Flora Exposition, need to count of every flower manually. It means that we need a lot of paper work to check the flowers life cycle, replacement date, planted date, and etc. These paper works not only need a lot of labor to deal with but also take a lot of time to process these data. Therefore, our cloud inventory management system can help us to improve this issue.
At first, we will choose a block of flowers which has been embedded with RFID tags. With the handheld wireless RFID reader to do inventory management, we can get the data from the tags which were embedded inside after scanning this area. For example, we can get the data, including the name, life cycle, and amount of flowers. If we need to update or exchange the data, we can process synchronously via the rear-end cloud database service to inquire the stocking of flowers, or economic order quantity of flowers so that the concurrent engineering will be implemented to update and exchange the data simultaneously. If we do not have to update or exchange the data, we can make a record on the tags which were embedded in flowers so that it will help improve the effectiveness and efficiency of taking stock.
For this exposition, we will consider environment limitation as the following statements for our model assumption:
1. With the wide hinterland in this exposition, we need lots of labors to check stock for every batch of flower.
2. With the significant amount of flowers, it takes lots of labor cost and time to do inventory management.
3. With different life cycle for different flowers, it takes lots of time and labor cost to manage and integrate information.
21
4. There are no path obstacles in this case.
5. Every route is smooth without altitude.
6. Operators work 8 hours every day.
7. Operators have same walk speed in this case.
8. Operators take 10 minutes break after 50 minutes work.
9. Operators need to count every batch of flowers one by one.
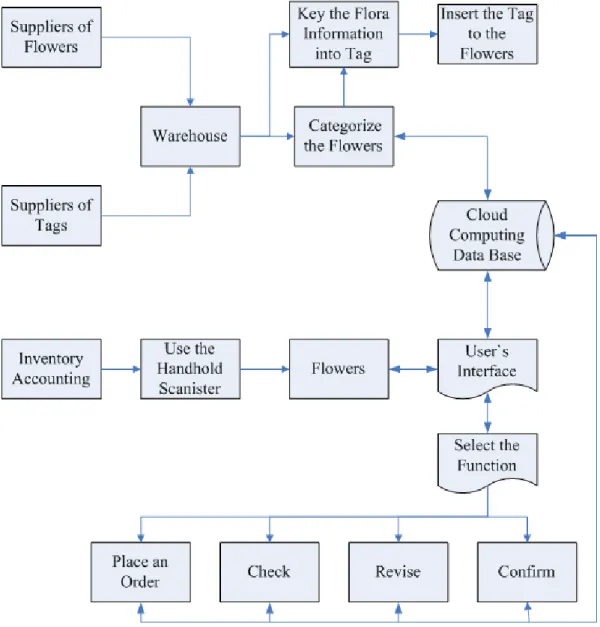
In the process of counting in Taipei Flora Exposition, flower supplier and tag supplier will keep products into warehouse. In the warehouse, flowers will be categorized and tags will be embedded with flower information so that the CIM system can integrate these information. When labors check stocks with RFID handheld reader, we can use the user platform, which is installed in handheld reader, to link the rear end clouding computing system. For instance, we find out the amount of flowers is under the safety stock, we can choose “place an order” to order flowers by labors. These actions will be recorded in CIM system for checking and updating simultaneously.
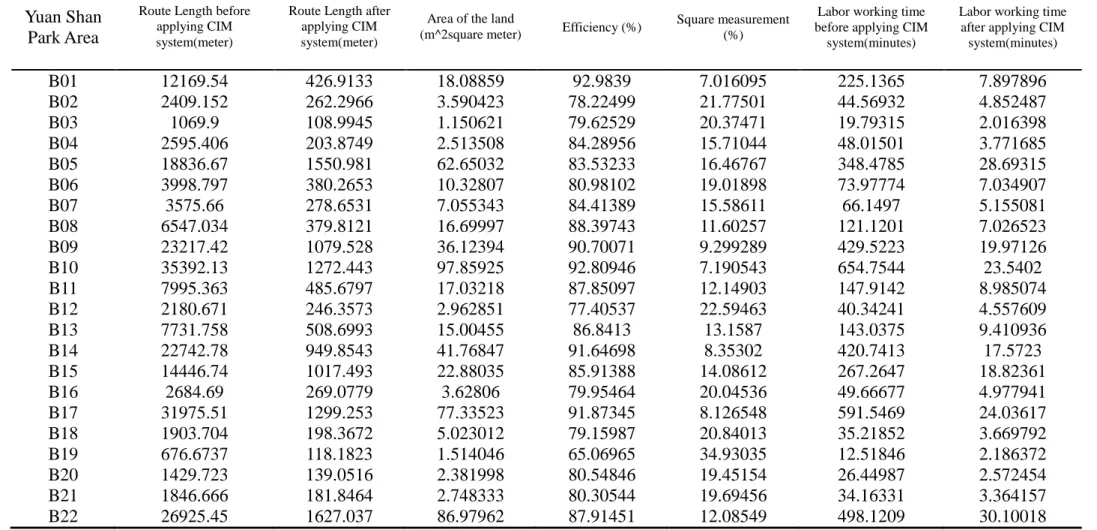
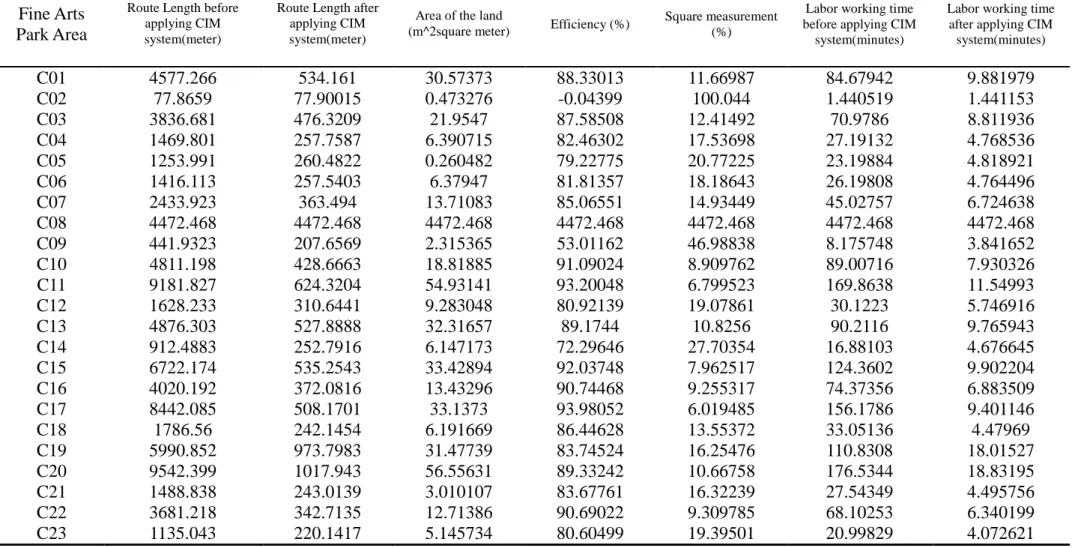
In this case, we divide Taipei Flora Exposition where planted with flower into 4 area and measure the route length and working time. In the table shows the route length comparison between each other, and the working time comparison between each other.
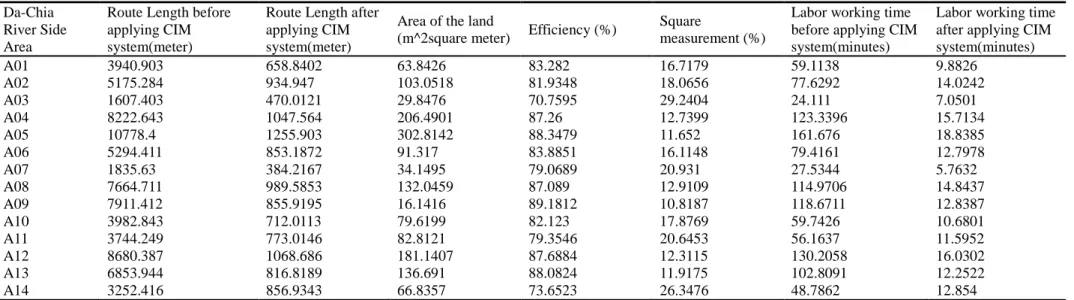
(1) By using cloud inventory management system, we can easily find out the reduction of route length and time reduction. As we can see from the table, by using the efficiency formula (see Eq. 1), we can acquire the data for the improvement of working efficiency. In the same route, we use less time to finish flowers checking and data processing.
This system provide us a simultaneously interaction between labor and their work. This system helps us to shorten 82.9792% walking route and time requirement to do flowers inventory counting. After applying the cloud inventory management system based on RFID technology, the efficiency of inventory counting gets greatly improved. According to the table, the inventory counting route lengths have been reduced 510563.7 meters after applying cloud inventory management system and inventory counting time reduced 9209.994 minutes after applying CIM system. The
CIM S applying before
Cost
improved Cost
Efficiency
22
labor cost reduced and the inventory management information is advanced processed.
In addition, the improved square measurement only has 17.044%. It indicates that applying cloud inventory management system has significantly improvement on working efficiency and time reduction in this case.
In this special case, we have special environmental limitation, including huge counting area. As a result, our efficiency improves dramatically by implementing cloud inventory management system base on RFID. RFID technology plays a very important role in the process to achieve rapid, real-time, standardize of collecting and processing of the logistics system. From the result we learn from the table, we have 82.955% efficiency improvement about route length and time reduction. In this special case, we actually lower down labor cost and time cost dramatically.
Fig. 6 CIM based on RFID technology in Taipei Flora Exposition case study structure.
23
Table 2 Da-Chia River Side Area.
Da-Chia River Side Area
Route Length before applying CIM system(meter)
Route Length after applying CIM system(meter)
Area of the land
(m^2square meter) Efficiency (%) Square
measurement (%)
Labor working time before applying CIM system(minutes)
Labor working time after applying CIM system(minutes)
A01 3940.903 658.8402 63.8426 83.282 16.7179 59.1138 9.8826
A02 5175.284 934.947 103.0518 81.9348 18.0656 77.6292 14.0242
A03 1607.403 470.0121 29.8476 70.7595 29.2404 24.111 7.0501
A04 8222.643 1047.564 206.4901 87.26 12.7399 123.3396 15.7134
A05 10778.4 1255.903 302.8142 88.3479 11.652 161.676 18.8385
A06 5294.411 853.1872 91.317 83.8851 16.1148 79.4161 12.7978
A07 1835.63 384.2167 34.1495 79.0689 20.931 27.5344 5.7632
A08 7664.711 989.5853 132.0459 87.089 12.9109 114.9706 14.8437
A09 7911.412 855.9195 16.1416 89.1812 10.8187 118.6711 12.8387
A10 3982.843 712.0113 79.6199 82.123 17.8769 59.7426 10.6801
A11 3744.249 773.0146 82.8121 79.3546 20.6453 56.1637 11.5952
A12 8680.387 1068.686 181.1407 87.6884 12.3115 130.2058 16.0302
A13 6853.944 816.8189 136.691 88.0824 11.9175 102.8091 12.2522
A14 3252.416 856.9343 66.8357 73.6523 26.3476 48.7862 12.854
24
Table 3 Yuan Shan Park Area
Yuan Shan Park Area
Route Length before applying CIM system(meter)
Route Length after applying CIM system(meter)
Area of the land
(m^2square meter) Efficiency (%) Square measurement (%)
Labor working time before applying CIM
system(minutes)
Labor working time after applying CIM system(minutes)
B01 12169.54 426.9133 18.08859 92.9839 7.016095 225.1365 7.897896
B02 2409.152 262.2966 3.590423 78.22499 21.77501 44.56932 4.852487
B03 1069.9 108.9945 1.150621 79.62529 20.37471 19.79315 2.016398
B04 2595.406 203.8749 2.513508 84.28956 15.71044 48.01501 3.771685
B05 18836.67 1550.981 62.65032 83.53233 16.46767 348.4785 28.69315
B06 3998.797 380.2653 10.32807 80.98102 19.01898 73.97774 7.034907
B07 3575.66 278.6531 7.055343 84.41389 15.58611 66.1497 5.155081
B08 6547.034 379.8121 16.69997 88.39743 11.60257 121.1201 7.026523
B09 23217.42 1079.528 36.12394 90.70071 9.299289 429.5223 19.97126
B10 35392.13 1272.443 97.85925 92.80946 7.190543 654.7544 23.5402
B11 7995.363 485.6797 17.03218 87.85097 12.14903 147.9142 8.985074
B12 2180.671 246.3573 2.962851 77.40537 22.59463 40.34241 4.557609
B13 7731.758 508.6993 15.00455 86.8413 13.1587 143.0375 9.410936
B14 22742.78 949.8543 41.76847 91.64698 8.35302 420.7413 17.5723
B15 14446.74 1017.493 22.88035 85.91388 14.08612 267.2647 18.82361
B16 2684.69 269.0779 3.62806 79.95464 20.04536 49.66677 4.977941
B17 31975.51 1299.253 77.33523 91.87345 8.126548 591.5469 24.03617
B18 1903.704 198.3672 5.023012 79.15987 20.84013 35.21852 3.669792
B19 676.6737 118.1823 1.514046 65.06965 34.93035 12.51846 2.186372
B20 1429.723 139.0516 2.381998 80.54846 19.45154 26.44987 2.572454
B21 1846.666 181.8464 2.748333 80.30544 19.69456 34.16331 3.364157
B22 26925.45 1627.037 86.97962 87.91451 12.08549 498.1209 30.10018
25
Table 4Fine Arts Park Area Fine Arts
Park Area
Route Length before applying CIM system(meter)
Route Length after applying CIM system(meter)
Area of the land
(m^2square meter) Efficiency (%) Square measurement (%)
Labor working time before applying CIM
system(minutes)
Labor working time after applying CIM system(minutes)
C01 4577.266 534.161 30.57373 88.33013 11.66987 84.67942 9.881979
C02 77.8659 77.90015 0.473276 -0.04399 100.044 1.440519 1.441153
C03 3836.681 476.3209 21.9547 87.58508 12.41492 70.9786 8.811936
C04 1469.801 257.7587 6.390715 82.46302 17.53698 27.19132 4.768536
C05 1253.991 260.4822 0.260482 79.22775 20.77225 23.19884 4.818921
C06 1416.113 257.5403 6.37947 81.81357 18.18643 26.19808 4.764496
C07 2433.923 363.494 13.71083 85.06551 14.93449 45.02757 6.724638
C08 4472.468 4472.468 4472.468 4472.468 4472.468 4472.468 4472.468
C09 441.9323 207.6569 2.315365 53.01162 46.98838 8.175748 3.841652
C10 4811.198 428.6663 18.81885 91.09024 8.909762 89.00716 7.930326
C11 9181.827 624.3204 54.93141 93.20048 6.799523 169.8638 11.54993
C12 1628.233 310.6441 9.283048 80.92139 19.07861 30.1223 5.746916
C13 4876.303 527.8888 32.31657 89.1744 10.8256 90.2116 9.765943
C14 912.4883 252.7916 6.147173 72.29646 27.70354 16.88103 4.676645
C15 6722.174 535.2543 33.42894 92.03748 7.962517 124.3602 9.902204
C16 4020.192 372.0816 13.43296 90.74468 9.255317 74.37356 6.883509
C17 8442.085 508.1701 33.1373 93.98052 6.019485 156.1786 9.401146
C18 1786.56 242.1454 6.191669 86.44628 13.55372 33.05136 4.47969
C19 5990.852 973.7983 31.47739 83.74524 16.25476 110.8308 18.01527
C20 9542.399 1017.943 56.55631 89.33242 10.66758 176.5344 18.83195
C21 1488.838 243.0139 3.010107 83.67761 16.32239 27.54349 4.495756
C22 3681.218 342.7135 12.71386 90.69022 9.309785 68.10253 6.340199
C23 1135.043 220.1417 5.145734 80.60499 19.39501 20.99829 4.072621