行政院國家科學委員會專題研究計畫 成果報告
機構投資人所扮演之訊息傳遞角色 研究成果報告(精簡版)
計 畫 類 別 : 個別型
計 畫 編 號 : NSC 95-2416-H-011-018-
執 行 期 間 : 95 年 08 月 01 日至 96 年 10 月 31 日 執 行 單 位 : 國立臺灣科技大學財務金融研究所
計 畫 主 持 人 : 莊文議
計畫參與人員: 臨時工:戴瑛慧、李依臻、陳儷瑛、林章煒、張哲豪
報 告 附 件 : 出席國際會議研究心得報告及發表論文
處 理 方 式 : 本計畫可公開查詢
中 華 民 國 96 年 10 月 23 日
The Diverse Roles of Institutional Investors and Financial Analysts in Information Transmission
Wen-I Chuang
Graduate School of Finance, College of Management National Taiwan University of Science and Technology
E-mail: [email protected]
Tel.: (+) 886-2-2730-1273; Fax: (+) 886-2-2737-6744 and
Bong-Soo Lee
KAIST Graduate School of Finance, and Florida State University
E-mail: [email protected]
Tel.: (+) 82-2-958-3006; Fax: (+) 82-2-958-3170 Tel.: 850-644-4713; Fax: 850-644-4225
Abstract
We provide empirical evidence on the impact of limited market participation on diverse roles played by institutional investors and financial analysts in propagating information. Our findings are as follows. First, some institutional investors and financial analysts play dual roles of market-wide information discoverers and disseminators, while others play dual roles of market-wide information receivers and disseminators. Second, the firms that are primarily held by individual investors and followed by fewer financial analysts tend to respond more sluggishly to new market-wide information than do the firms that are primarily held by institutional investors and followed by more financial analysts. Third, financial analysts provide more market-wide information to the market than do institutional investors. Fourth, good market-wide news diffuses more slowly across securities than does bad market-wide news, and this finding primarily occurs in the periods of NBER-dated expansions.
JEL classification: G14; G20
Keywords: Limited Market Participation; Institutional Investors; Financial Analysts;
Market-Wide Information; Information Transmission August 2007
The Diverse Roles of Institutional Investors and Financial Analysts in Information Transmission
Abstract
We provide empirical evidence on the impact of limited market participation on diverse roles played by institutional investors and financial analysts in propagating information. Our findings are as follows. First, some institutional investors and financial analysts play dual roles of market-wide information discoverers and disseminators, while others play dual roles of market-wide information receivers and disseminators. Second, the firms that are primarily held by individual investors and followed by fewer financial analysts tend to respond more sluggishly to new market-wide information than do the firms that are primarily held by institutional investors and followed by more financial analysts. Third, financial analysts provide more market-wide information to the market than do institutional investors. Fourth, good market-wide news diffuses more slowly across securities than does bad market-wide news, and this finding primarily occurs in the periods of NBER-dated expansions.
JEL classification: G14; G20
Keywords: Limited Market Participation; Institutional Investors; Financial Analysts;
Market-Wide Information; Information Transmission
1. Introduction
In analyzing the source of contrarian profits, Lo and MacKinlay (1990) uncover a striking finding that the returns on the portfolio of small stocks are correlated with the lagged returns on the portfolio of large stocks, but not vice versa. Although they attribute this finding to the tendency of small stocks to adjust more slowly to market-wide information than large stocks, they provide little explanation for why firm size per se may be an important determinant of the speed of price adjustment to information. Considerable research has been conducted to find factors that can account for information transmission across securities beyond the size effect. Candidates that have been put forward to account for information transmission across securities include the proportion of stocks held by institutional investors (Badrinath, Kale, and Noe (1995) and Sias and Starks (1997)), the number of analysts following a firm (Brennan, Jegadeesh, and Swaminathan (1993)), and trading volume (Chordia and Swaminathan (2000)).
1
Badrinath, Kale, and Noe (1995) hypothesize that because of differential information set-up costs (Merton (1987)) and/or legal restrictions arising from the “prudent man” regulations, both implying limited market participation, institutional investors gather information about only a subset of stocks. If the information they gather has common effects across securities, then the returns on stocks held by institutional investors, who have more resources to perform systematic investigations into the securities than do individual investors, help predict the returns on stocks held by individual investors. To test the hypothesis, Badrinath et al. (1995) form portfolios that have similar market capitalization but vary in the degree of institutional ownership. Consistent with their hypothesis, they find that the returns on the portfolios with the highest level of institutional ownership lead those with lower levels of institutional ownership.
However, given the implications of limited market participation, institutional
1 There are two additional explanations that have been proposed for cross-autocorrelations among portfolio
returns. The first group attributes cross-autocorrelations in portfolio returns to time-varying expected returns
(e.g., Conrad and Kaul (1988). A variation of this explanation claims that cross-autocorrelations are the
result of portfolio autocorrelations and contemporaneous correlations (e.g., Boudoukh, Richardson, and
Whitelaw (1994)). According to this explanation, portfolio cross-autocorrelations should disappear once
portfolio autocorrelations are taken into account. The second group attributes portfolio autocorrelations and
cross-autocorrelations to market imperfections or microstructure biases such as thin trading (e.g., Boudoukh,
Richardson, and Whitelaw (1994)).
investors should display different behavior in gathering information for the different characteristics of stocks. For example, due to the prudent man rules, institutional investors will prefer investing in large stocks to investing in small stocks, and therefore have more incentive to actively perform systematic investigations into large firms than small firms.
Then, the lead-lag relation between the returns on portfolios with different degrees of institutional ownership within large size groups can be attributable to the effect of the prudent-man rules on institutional investors’ behavior in gathering information. Moreover, active information gathering may help institutional investors acquire some new information prior to others.
Institutional investors may also invest in small stocks for the purpose of portfolio diversification or increasing profits.
2
However, they will devote less effort to conducting systematic investigations into small stocks because the costs of information acquisition for small firms are higher than for large firms (Merton (1987)). Since full-time professional institutional investors tend to pay more attention to information about small stocks than do part-time individual investors, the lead-lag relation between the returns on portfolios with different degrees of institutional ownership within small size groups can be attributable to the fact that institutional investors respond more rapidly to information than individual investors. In this circumstance, information collected by institutional investors may have already been propagated for a while in the market.Sias and Starks (1997) form portfolios first on the basis of firm size and then on the basis of the degree of institutional holdings and find, among other things, that for similarly capitalized portfolios the returns on the portfolios with high institutional holdings is more useful in predicting returns on those with low institutional holdings than vice versa. They interpret their finding as consistent with the hypothesis that institutional trading reflects market-wide information ultimately incorporated into other stocks with low institutional holdings. But their finding provides no direct evidence on whether institutional investors take different attitudes toward different characteristics of stocks in gathering information.
Some theoretical works show that as the number of informed investors increases, the share price will reflect new information more rapidly (e.g., Kyle (1985), Holden and
2 Bennett, Sias, and Starks (2003) show that over time institutional investors have shifted their preferences
toward smaller stocks because such stocks offer a relatively more attractive trade-off between risk and
expected return than do larger stocks.
Subrahmanyam (1992), and Foster and Viswanathan (1993)). Using the number of analysts as a proxy for the number of informed investors, Brennan, Jegadeesh, and Swaminathan (1993) find that the returns on the portfolios of firms that are followed by many analysts tend to lead those of firms that are followed by a few analysts, even when the firms are of approximately the same size. Although financial analysts are free from the prudent man regulations, they still have to consider the costs of information acquisition when they make forecasts of the firms’ earnings. It is not surprising to see that larger and more liquid firms tend to have more analysts following (e.g., Hong, Lim, and Stein (2000)). As in the case of institutional investors, limited market participation can exert its impact on the role of financial analysts in propagating information.
Hong and Stein (1999) develop a dynamic model in which information diffuses gradually across the investing public, implying that some investors are information discoverers, some are information receivers, and others are information disseminators.
These roles, of course, are not mutually exclusive. For example, the investor who discovers new information will disseminate information to others sooner or later through trading.
Some investors will receive disseminated information faster than others, and as such, the former will also help disseminate information that is already diffused for a certain period of time in the market to the latter. This implies that some investors are information discoverers and disseminators, some investors are information receivers and disseminators, and other investors are just information receivers.
One common observation from Badrinath et al. (1995), Sias and Starks (1997), and Brennan et al. (1993) is that institutional investors and financial analysts are better informed about market-wide information than individual investors. But they provide no clear evidence on the diverse roles of institutional investors and financial analysts in information transmission in different circumstances based on the implications of limited market participation. Our study attempts to fill this void in the literature. Although previous studies present evidence that institutional investors and financial analysts are better informed than individual investors, one interesting question that remains unanswered is which type of agent provides more information to the market. We also address this issue.
To address these issues, we form various portfolios: size-institutional ownership and volume-institutional ownership portfolios, size-analyst coverage and volume-analyst
coverage portfolios, analyst coverage-institutional ownership portfolios, and institutional ownership-analyst coverage portfolios. We calculate the daily returns of these portfolios. To proxy market-wide information, we use the returns on both the equal- and value-weighted market portfolios. Then, we measure the relative predictive power of the portfolios and the market portfolios by performing the Granger-causality tests.
Consistent with the previous studies, our results show that within each size or volume group, the returns on portfolio with the highest institutional ownership lead those with the lowest institutional ownership, and the returns on portfolio with the highest analyst coverage lead those with the lowest analyst coverage. This implies that firms that are primarily held by individual investors and followed by fewer financial analysts tend to respond more sluggishly to new market-wide information than do firms that are primarily held by institutional investors and followed by more financial analysts.
More importantly, we find that within the large size and high volume groups, returns on the portfolios with the highest institutional ownership lead returns on the market portfolio, while within the small size and low volume groups, returns on the portfolios with the highest institutional ownership lag returns on the market portfolio. The portfolios associated with analyst coverage yield similar results. Put together, these results imply that, due to the effect of limited market participation, institutional investors and financial analysts collect information more actively about large and liquid stocks and thus play the dual roles of information discoverers and disseminators, whereas they do less actively about small and illiquid stocks and thus play the dual roles of information receivers and disseminators.
We find that returns on the portfolios with the highest institutional ownership lead returns on the portfolios with the lowest institutional ownership for three of six analyst coverage groups, whereas returns on the portfolios with the highest analyst coverage lead returns on the portfolios with the lowest analyst coverage for all six institutional ownership groups. In other words, the extent to which financial analysts offer additional information to the market is greater than the extent to which institutional investors offer additional information to the market. These results imply that financial analysts provide more market-wide information than do institutional investors.
Finally, we find that stocks with the lowest institutional ownership (analyst coverage) tend to respond more slowly to good market-wide news emanating from stocks with the
highest institutional ownership (analyst coverage) than to bad news. This is consistent with the finding of McQueen, Pinegar, and Thorley (1996) that small stocks tend to have more delayed reactions to good market-wide news emanating from large stocks than to bad news.
Moreover, we find that this asymmetric delayed response occurs primarily during the periods of NBER-dated expansions. This implies that investors pay less attention to good market-wide news during the periods of expansion and pay more attention to all market-wide news during the periods of contraction.
The balance of the paper is organized as follows. In the next section, we describe the data and discuss the empirical frameworks. In Section 3, we present the empirical results, and we conclude in Section 4.
2. Data and Empirical Framework 2.1. Data
Our sample consists of all firms listed on the NYSE during the period of January 1982 to December 2004. We exclude any firm that was a prime, a closed-end fund, a real estate investment (REIT), and an American Depository Receipt (ADR). To be included in our sample, a firm must have available information on stock prices, market capitalization, trading volume, the number of shares held by institutional investors, and the number of financial analysts following it. Stock prices, market capitalization, and trading volume are obtained from the Center for Research in Security Prices (CRSP) database. Specifically, we use trading turnover, defined as the ratio of the number of shares traded in a given day to the total number of shares outstanding at the end of the day, as a measure of trading volume.
3
The number of shares held by institutional investors is obtained from January, April, July, and October issues of Standard and Poors’ Security Owners’ Stock Guides. The institutional holdings reported in the Security Owners’ Stock Guide originate from Vickers Stock Research Corporation. Specifically, data in the January issue reflect third-quarter
3 Lo and Wang (2000) argue that using trading turnover as a measure of trading volume has an advantage in
that it is unaffected by “neutral” changes of units such as stock splits and stock dividends. Moreover, one
problem with using the number of shares traded as a measure of trading volume is that it is unscaled and,
therefore, highly correlated with firm size. Chordia and Swaminathan (2000) show that the correlation
between trading turnover and firm size is much lower than that between other measures of trading volume and
firm size.
institutional holdings in the previous year (see also Nofsinger and Sias (1999)). Fractional institutional ownership is defined as the ratio of the number of shares held by institutional investors to the number of shares outstanding. The number of financial analysts following each sample firm is taken from the I/B/E/S tapes. The number of financial analysts following a particular firm in a given quarter is defined as the number of financial analysts making an annual earnings forecast in January, April, July, and October.
4
Previous studies document that firm size and trading volume are highly positively correlated with institutional holdings and analyst coverage (e.g., Badrinath et al. (1995), Sias and Starks (1997), Brennan et al. (1993), and Hong et al. (2000)). These high positive correlations naturally lead to the question of whether the size or volume effects are subsumed by the institutional ownership or analyst coverage effects or vice versa. To effectively evaluate diverse roles of institutional investors and financial analysts in information transmission, we divide our sample of stocks in the following manners. For size-institutional ownership portfolios, six size groups are formed at the beginning of each quarter by ranking all sample stocks by their market capitalization. Then, each size group is further classified into six groups based on the fraction of shares held by institutional investors. Thus, each sample stock is assigned to one of 36 groups. We construct volume-institutional ownership portfolios, size-analyst coverage portfolios, volume-analyst coverage portfolios, analyst coverage-institutional ownership portfolios, and institutional ownership-analyst coverage portfolios in a similar manner.
5
This sorting algorithm ensures that size-institutional ownership and volume-institutional ownership portfolios are different in terms of institutional ownership but similar in terms of size and volume, respectively. A similar idea applies to other portfolios. For example, size-analyst coverage and volume-analyst coverage portfolios are different in terms of analyst coverage but similar in terms of size and volume, respectively.Once portfolios are formed in this manner at the beginning of each quarter, their composition remains unchanged for the remainder of the quarter. Then, daily equal-weighted portfolio returns are computed for each portfolio by averaging daily returns
4 We use the number of financial analysts who make an annual earnings forecast rather than a quarterly earnings forecast. This is because prior to year 2000 the number of financial analysts making a quarterly earnings forecast is not available for most of sample firms.
5
The volume-ranked portfolios are based on daily average trading turnover of the sample stocks over the
previous year before the portfolio formation date (see also Chordia and Swaminathan (2000)).
of the stocks in the portfolio. To minimize the effect of non-synchronous trading on cross-autocorrelations, we follow the Chordia and Swaminathan (2000) methodology and exclude stocks that did not trade on date t or t – 1 when computing portfolio returns for date
t. For each portfolio, we obtain 5,553 observations of daily portfolio returns. 6
Table 1 reports descriptive statistics on various portfolios. We find that the mean values of firm size of size-institutional ownership and size-analyst coverage portfolios are virtually similar for each size group. A similar observation is made for each volume group, each analyst coverage group, and each institutional ownership group. This indicates that we are successful in reducing the association between size and institutional ownership/analyst coverage, between volume and institutional ownership/analyst coverage, and between institutional ownership and analyst coverage.
The limited market participation implies that institutional investors and financial analysts display different behavior in gathering information for the different characteristics of stocks, and thus they play different roles in propagating market-wide information in financial markets. To gauge whether different size or volume groups exhibit significant differences to meet the requirement that they have different characteristics in size or volume, we perform the t-tests for the difference in mean values of size or volume for adjacent two groups.
Table 1 shows that the t-statistics for two portfolios Pi vs. Pi+1 are statistically significant at the 1% level for all adjacent size or volume groups, illustrating that our sorting algorithm successfully captures the effect of limited market participation. The t-statistics for Pi vs. Pi+1 of analyst coverage-institutional ownership portfolios and institutional ownership-analyst coverage portfolios are also statistically significant at the 1% level for all adjacent analyst coverage or institutional ownership groups.
Table 1 also reports the t-statistics for two portfolios Pih vs. Pil , where h and l refer to the highest and lowest institutional-ownership and analyst coverage portfolios,
6 Previous studies document that non-synchronous trading is a more serious problem in daily data than in
weekly data (e.g., Kadlec and Patterson (1999)) and that Wednesday trading volume is higher relative to other
weekdays’ trading volume (e.g., Barclay, Litzenberger, and Warner (1990)). To further alleviate the concerns
of the non-synchronous trading and non-trading problems, we also compute Wednesday-to-Wednesday
equal-weighted portfolio returns for each portfolio and conduct all empirical analyses of the paper using
weekly portfolio returns. The weekly results show that all conclusions drawn from the results of daily portfolio
returns remain virtually unchanged. To conserve space, we do not report the results using weekly portfolio
returns. However, they are available from the authors upon request.
respectively, within each size group, each volume group, each analyst coverage group, or each institutional ownership group i. They are used to test whether portfolios have different degrees (or mean values) of institutional ownership within each size or volume group, of analyst coverage within each size or volume group, of institutional ownership within each analyst coverage group, and of analyst coverage within each institutional ownership group, respectively. The results show that all t-statistics for Pih vs. Pil are statistically significant at the 1% level, indicating that size- and volume-institutional ownership portfolios have different degrees of institutional ownership within each size or volume group, respectively. A similar observation is made for other groups.
2.2. Empirical Framework 2.2.1. Vector Autoregressions
Following Brennan et al. (1993), we employ vector autoregressions (VAR) to investigate the lead-lag relation between portfolio returns (see also Sias and Starks (1997) and Chordia and Swaminathan (2000)). Brennan et al. (1993) demonstrate that returns of portfolios that are first to reflect market-wide information will predict the returns of portfolios that reflect market-wide information later. To understand the rationale behind the VAR, suppose that we want to test whether portfolio B returns lead portfolio A returns. For this, we consider the following bivariate vector autoregressions:
, , , ,
1 1
,
K K
A t A k A t k k B t k A t
k k
R α a R
−b R
−ε
= =
= +
∑
+∑
+ (1), , , ,
1 1
,
K K
B t B k A t k k B t k B t
k k
R α c R
−d R
−ε
= =
= +
∑
+∑
+ (2)where
R
A t, andR
B t, are the returns of portfolios A and B, respectively. The number of lags in each equation is chosen by considering both the Akaike (1974) information criterion (AIC) and the Schwarz (1978) information criterion (SIC). In equation (1), if the lagged returns of portfolio B can predict the current returns of portfolio A, controlling for the predictive power of the lagged returns of portfolio A, the returns of portfolio B are said toGranger-cause the returns of portfolio A. Following Chordia and Swaminathan (2000), we
also examine whether the sum of the coefficients associated with the returns of portfolio B in equation (1) is greater than zero. Therefore, this version of the Granger-causality tests examines not only for predictability but also for the sign of predictability (or net effect).
Then, we focus on testing formally whether the ability of the lagged returns of portfolio B to predict the current return of portfolio A is better than vice versa. We test this hypothesis by examining whether the sum of the
b
k coefficients in equation (1) is greater than the sum of thec
k coefficients in equation (2). If the ability of the lagged returns of portfolio B to predict the current return of portfolio A is better than vice versa, Brennan et al.(1993) theoretically demonstrate that the sum of the
b
k coefficients in equation (1) should be significantly greater than the sum of thec
k coefficients in equation (2).7
We use the return on the market portfolio to proxy market-wide information. This proxy is important because it helps us to identify the diverse roles played by institutional investors and financial analysts in propagating market-wide information. For example, if the returns on the portfolios with the highest institutional ownership Granger-cause those with the lowest institutional ownership with the effect being positive, this implies that institutional investors disseminate market-wide information to individual investors. Then, based on the implications of limited market participation, there are two circumstances that will occur. First, if the returns on the portfolios with the highest institutional ownership significantly and positively Granger-cause the returns on the market portfolio, this implies that institutional investors make efforts to discover and acquire market-wide information prior to others. Put together, they suggest that these institutional investors play the dual roles of information discoverers and disseminators in the market. Second, given that institutional investors are better informed than individual investors, if the returns on the market portfolio Granger-cause the returns on the portfolios with the highest institutional ownership and the effect is positive, this implies that these institutional investors are market-wide information receivers and disseminators.
2.2.2. Asymmetric Regression
7 Brennan et al. (1993) show that if the lagged returns of portfolio A predict the current returns of portfolio B
with a negative sign, it is simply a result of the fact that the returns of portfolio A adjust more sluggishly to
market-wide information than returns of portfolio B.
McQueen et al. (1996) find that the cross-autocorrelation puzzle documented by Lo and MacKinlay (1990) is primarily associated with a slow response by some small stocks to good, but not to bad, market-wide news. A variation of our empirical framework of the bivariate vector autoregression of equations (1) and (2) can also provide information about the cross-autocorrelation between the returns of two portfolios under consideration. Here, we also investigate whether the cross-autocorrelation of our portfolios exhibits an asymmetric response to good and bad market-wide news.
Following the McQueen et al. (1996) method, we employ the following asymmetric regression to investigate the asymmetric response of the returns of one portfolio to positive and negative returns of the other portfolio:
UP DN
, , , , , , , ,
0 0
( ) ( (1 )) ,
K K
B t B B k A t k A t k B k A t k A t k B t
k k
R α β R
−D
+ −β R
−D
+ −ε
= =
= +
∑
× +∑
× − + (3)where
R
A t, andR
B t, are the returns of portfolios A and B, respectively, andD
A t k+,− is a dummy variable and takes on a value of one ifR is positive and zero otherwise.
A t,8
The lag length in equation (3) is determined based on the AIC and the SIC. It can be shown that portfolio B adjusts more slowly to good market-wide news emanating from portfolio A than to bad news if and only if the contemporaneous beta associated with the positive returns of portfolioA, β
BUP,0,
is less than that associated with the negative returns of portfolio A,DN ,0
,
βB and the sum of the lagged betas in an up market, UP,
1
,
K k=
β
B k∑
is greater than that in a down market, DN,1 K k=
β
B k∑
. In terms of the asymmetric regression in equation (3), this translates into examining whetherβ
BUP,0< β
BDN,0 and UP, DN,1 1
K K
B k B k
k= β
>
k= β∑ ∑
(see alsoMcQueen
et al. (1996)). 9
The rationale behind this result is that if portfolio B responds more sluggishly to good market-wide news released from portfolio A than to bad news,
it should respond less to today’s good market-wide news than to today’s bad news, and respond more to past good market-wide news than to past bad news. It should be noted that in order to make a conclusion about the asymmetric response, the above two conditions should hold simultaneously.
8
We have checked the returns of portfolio A and found that none of them is zero over the sample period.
Therefore, it is safe to define D
A t k+,−as the positive returns of portfolio A and define (1 − D
A t k+,−) as the negative returns of portfolio A.
9 Chordia and Swaminathan’s (2000) Dimson beta regressions use the same concept to measure the relative
speeds of adjustment of portfolios to market-wide information.
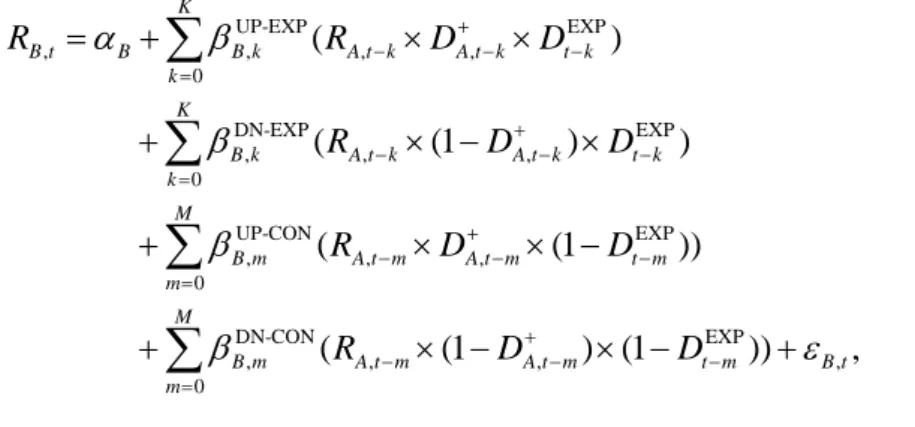
Here, we go one step further to investigate whether the asymmetric response is related to the state of the macro economy. To this end, we modify equation (3) as follows:
(4)
where
D
tEXP is a dummy variable and takes on a value of one during an NBER-dated expansion and zero otherwise.10
The lag length in equation (4) is determined based on the AIC and the SIC. As discussed above, to investigate the relation between asymmetric responses and the state of the macro economy, we examine the relative magnitudes of the contemporaneous betas and the relative magnitudes of the sum of the lagged betas during the period of NBER-dated expansions and contractions.11
3. Empirical Results
3.1. The Diverse Roles of Institutional Investors in Information Transmission
Table 2 presents the estimation results of the bivariate VAR for the size-institutional ownership and the equal- and value-weighted market portfolios. Specifically, Panel A of Table 2 presents the estimation results of the bivariate VAR for 12 size-institutional ownership portfolios, Pih (Portfolio A) versus Pil (Portfolio B), where h and l refer to the highest and lowest institutional-ownership portfolios, respectively, within each size group i.
The
χ bc
(1) statistic is employed to measure the relative ability of two portfolios in predicting each other. The results show that for each size group, the sum of thec
k coefficients is greater than that of theb coefficients. Moreover, the null hypothesis that
k10
According to the definition of a business cycle by the NBER, any period should belong to either a period of expansion or a period of contraction. Thus, our dummy variables should cover all the periods and there is no period in between.
11
We also examine whether market-wide news displays different patterns of diffusion across securities during the business cycle, but find no significant differences.
UP-EXP EXP
, , , ,
0
DN-EXP EXP
, , ,
0
UP-CON EXP
, , ,
0
DN-CON
, ,
( )
( (1 ) )
( (1 ))
( (1
K
B t B B k A t k A t k t k
k K
B k A t k A t k t k
k M
B m A t m A t m t m
m
B m A t m
R R D D
R D D
R D D
R D
α β
β β β
+
− − −
=
− + − −
=
− + − −
=
−
= + × ×
+ × − ×
+ × × −
+ × −
∑
∑
∑
EXP
, ,
0
) (1 )) ,
M
A t m t m B t
m
D
ε+
− −
=
× − +
∑
k k
, b = c
∑ ∑
which we test by theχ bc
(1) statistic, is rejected at conventional significance levels for all size groups. These results indicate that the ability of the lagged returns on the portfolio with the highest institutional ownership to predict the current returns on the portfolio with the lowest institutional ownership is better than vice versa, implying that institutional investors are better informed than individual investors.Panel B1 of Table 2 reports the results of the Granger-causality tests for the portfolios with the highest institutional holdings (i.e., Pih for i = 1, 2,…, and 6) and the equal-weighted market portfolio, Pem. Based on the relative magnitudes of the
b and
kc
k coefficients and theχ bc
(1) statistics, the ability of the returns of P1h
, P2h
, and P3h
to predict the returns of Pem is better than vice versa. Combined with the results of Panel A of Table 2, this implies that some institutional investors discover new market-wide information and disseminate it to other investors. Moreover, the results show that the ability of the returns of Pem to predict the returns of P5h
and P6h
is better than vice versa. Combined with the results of Panel A of Table 2, this suggests that some institutional investors receive market-wide information faster than individual investor and then disseminate market-wide information to individual investors.Panel C1 of Table 2 reports the results of the Granger-causality tests for the portfolios with the lowest institutional holdings (i.e., Pil for i = 1, 2,…, and 6) and the equal-weighted market portfolio, Pem. Based on the relative magnitudes of the
b and
kc
k coefficients and theχ bc
(1) statistics, we find that the ability of the returns of Pem to predict the returns of P3l
, P4l
, P5l
, and P6l
is better than vice versa. Combined with the results of Panel A of Table 2, these findings imply that most individual investors acquire market-wide information more slowly than institutional investors and, consequently, the returns of the stocks in which individual investors have greater ownership can be predicted from the returns of the stocks in which institutional investors have greater ownership and of the market portfolio.Although our sample firms listed on the NYSE tend to be larger than firms listed on other U.S. stock exchanges, it cannot be ruled out that the equal-weighted market portfolio may be strongly influenced by small cap portfolios. To alleviate this concern, we also use the returns on the value-weighted market portfolio as another proxy for market-wide information. Panels B2 and C2 of Table 2 show that the results using the value-weighted
market returns, Rvm, are similar to what we find in Panels B1 and C1 of Table 2 using the equal-weighted market returns, Rem. The only exception is that the relative ability of returns of R
3h
and Rvm to predict each other is not statistically significant in Panel B2 of Table 2.To obtain further evidence on the impact of limited market participation on diverse roles played by institutional investors in transmitting information in the market, we perform similar analyses for the volume-institutional ownership and the equal- and value-weighted market portfolios. The results are reported in Table 3. Panel A of Table 3 presents the estimation results of the bivariate VAR for 12 volume-institutional ownership portfolios, Pih
(Portfolio A) versus Pil (Portfolio B), where h and l refer to the highest and lowest institutional-ownership portfolios, respectively, within each volume group i. It shows that the sum of the
c coefficients is greater than that of the
kb coefficients, and that the null
k hypothesis that they are equal is rejected at conventional significance levels for all six volume groups. Consistent with the results of Panel A of Table 2, the results indicate that the stocks held primarily by institutional investors adjust faster to market-wide information than do the stocks held primarily by individual investors in each volume group.Panel B1 (B2) of Table 3 presents the estimation results of the Granger-causality tests for the portfolios with the highest institutional holdings (i.e., Pih for i = 1, 2,…, and 6) and the equal-weighted (value-weighted) market portfolio, Pem (Pvm). We find that the sum of the
b coefficients is significantly smaller than that of the
kc coefficients for P
k1h
vs.Pem (Pvm) and for P
2h
vs. Pem (Pvm), indicating that the ability of P1h
and P2h
portfolios to predict the equal-weighted (value-weighted) market portfolio is better than vice versa.Moreover, the sum of the
b coefficients is significantly greater than that of the
kc
k coefficients for P6h
vs. Pem (for P6h
vs. Pvm), indicating that the ability of the equal-weighted (value-weighted) market portfolio to predict P6h
is better than vice versa. Consistent with the results of Table 2, these results suggest that some institutional investors play dual roles of information discoverers and disseminators, and some institutional investors play dual roles of information receivers and disseminators.Panel C1 (C2) of Table 3 presents the estimation results of the Granger-causality tests for the portfolios with the lowest institutional holdings (i.e., Pil for i = 1, 2,…, and 6) and the equal-weighted (value-weighted) market portfolio, Pem (Pvm). We find that the sum of the
b coefficients is greater than that of the
kc coefficients, and the
kχ bc
(1) statisticis significant at conventional levels for all volume group. These findings indicate that the ability of the equal- and value-weighted market portfolios to predict the portfolios with the lowest institutional holdings is better than vice versa. Consistent with the results of Panels C1 and C2 of Table 2, the results of Panels C1 and C2 of Table 3 also suggest that individual investors are in an inferior position to institutional investors in obtaining new market-wide information.
3.2. The Diverse Roles of Financial Analysts in Information Transmission
Now, we turn our attention to diverse roles financial analysts play in propagating information in financial markets. Table 4 presents the results of the Granger-causality tests for the size-analyst coverage and the equal- and value-weighted market portfolios. Panel A of Table 4 presents the estimation results of the bivariate VAR for 12 size-analyst coverage portfolios, Pih (Portfolio A) versus Pil (Portfolio B), where h and l refer to the highest and lowest analyst coverage portfolios, respectively, within each size group i. It shows that the sum of the
b coefficients is smaller than that of the
kc coefficients for all size groups.
k Moreover, based on theχ bc
(1) statistics, the null hypothesis that the ability of two portfolios to predict each other is equal is rejected for five of six size groups. These findings are consistent with Brennan et al. (1993) that the firms followed by more financial analysts react faster to market-wide information than do the firms followed by fewer financial analysts.Panel B1 (B2) of Table 4 presents the estimation results of the Granger-causality tests for the portfolios with the highest analyst coverage (i.e., Pih for i = 1, 2,…, and 6) and the equal-weighted (value-weighted) market portfolio, Pem (Pvm). We find that the sum of the
b coefficients is smaller than that of the
kc coefficients, and the
kχ bc
(1) statistics are significant at conventional levels for P1h
vs. Pem and for P1h
vs. Pvm, respectively.Together with the results of Panel A of Table 4, this implies that some financial analysts who follow the firms with the largest market capitalization discover new market-wide information and then spread it to others. Panels B1 and B2 of Table 4 also show that the sum of the
b coefficients is greater than that of the
kc coefficients, and the
kχ bc
(1) statistics are significant at conventional levels for P6h
vs. Pem and for P6h
vs. Pvm,respectively. Together with the results of Panel A of Table 4, this implies that some financial analysts who follow the firms with the smallest market capitalization receive market-wide information prior to others and then disseminate it to others who receive market-wide information later than them.
Panel C1 (C2) of Table 4 presents the estimation results of the Granger-causality tests for the portfolios with the lowest analyst coverage (i.e., Pil for i = 1, 2,…, and 6) and the equal-weighted (value-weighted) market portfolio, Pem (Pvm). We find that the sum of the
b coefficients is greater than that of the
kc coefficients, and the null hypothesis that
kk k
b = c
∑ ∑
is rejected at conventional significance levels for P4l
vs. Pem, P5l
vs. Pem, and P6l
vs. Pem and for P4l
vs. Pvm, P5l
vs. Pvm, and P6l
vs. Pvm, respectively. This indicates that the ability of the market portfolios to predict these portfolios is better than vice versa.Combined with the results of Panel A of Table 4, this implies that the firms followed by fewer financial analysts tend to respond sluggishly to new market-wide information.
Table 5 reports the estimation results of the Granger-causality tests for the volume-analyst coverage and the equal- and value-weighted market portfolios. Panel A of Table 5 presents the estimation results of the bivariate VAR for 12 volume-analyst coverage portfolios, Pih (Portfolio A) versus Pil (Portfolio B), where h and l refer to the highest and lowest analyst coverage portfolios, respectively, within each volume group i. We observe that the sum of the
b coefficients is smaller than that of the
kc coefficients for all
k volume groups. In addition, theχ bc
(1) statistics, which are used to test the null hypothesis that∑ bk = ∑ c
k,
are rejected at conventional significance levels for all volume groups.
These findings demonstrate that the ability of the portfolios with the highest analyst coverage to predict the portfolios with the lowest analyst coverage is better than vice versa.
Furthermore, they imply that financial analysts play an important role for stock prices in adjusting to new market-wide information.
It is noted that Panel A of Tables 2 and 3 show that the returns on portfolios with the highest institutional ownership significantly predict the returns on portfolios with the lowest institutional ownership even in the largest size and highest volume groups, respectively, and that Panel A of Tables 4 and 5 show that the returns on portfolios with the highest analyst coverage significantly predict the returns on portfolios with the lowest analyst coverage even in the largest size and highest volume groups, respectively. These results suggest that
autocorrelations and non-synchronous trading may not fully explain the observed lead-lag patterns in portfolio returns.
Panel B1 (B2) of Table 5 presents the estimation results of the Granger-causality tests for the portfolios with the highest analyst coverage (i.e., Pih for i = 1, 2,…, and 6) and the equal-weighted (value-weighted) market portfolio, Pem (Pvm). We find that the sum of the
b coefficients is smaller than that of the
kc coefficients, and the null hypothesis that
kk k
b = c
∑ ∑
is rejected at conventional significance levels based on the statistical significance of theχ bc
(1) statistic for P3h
vs. Pem and P4h
vs. Pem and for P3h
vs. Pvm and P4h
vs. Pvm, respectively. This indicates that the ability of two portfolios, P
3h
and P4h
, to predict the market portfolio is better than vice versa. Combined with the results of Panel A of Table 5, these findings suggest that some financial analysts discover new market-wide information prior to others, and new market-wide information revealed by them helps predict future market movements. Unlike the results reported in Panels B1 and B2 of Table 4, the results reported in Panels B1 and B2 of Table 5 reveal no clear evidence of the roles of information receivers and disseminators played by financial analysts.Panel C1 (C2) of Table 5 presents the estimation results of the Granger-causality tests for the portfolios with the lowest analyst coverage (i.e., Pil for i = 1, 2,…, and 6) and the equal-weighted (value-weighted) market portfolio, Pem (Pvm). We find that the ability of the equal- and value-weighted market portfolio to predict the portfolios with the lowest financial analyst coverage is better than vice versa based on the measure of the relative magnitudes of the
b and
kc coefficients and the statistical significance of the
kχ bc
(1) statistics for all volume groups. Combined with the results of Panel A of Table 5, these findings suggest that the firms followed by fewer financial analysts tend to respond slowly to new market-wide information.3.3. The Relative Degree of Additional Information Provided by Institutional Investors and Financial Analysts
Table 6 reports the estimation results of the bivariate VAR for the analyst coverage -institutional ownership and the equal- and value-weighted market portfolios. Specifically, Panel A of Table 6 reports the estimation results of the bivariate VAR for 12 analyst
coverage-institutional ownership portfolios, Pih (Portfolio A) versus Pil (Portfolio B), where
h and l refer to the highest and lowest institutional ownership portfolios, respectively, within
each analyst coverage group i. Based on the relative magnitudes of∑ bk and ∑ ck
and the statistical significance of the
χ bc
(1) statistics, we find that the ability of the portfolios with the highest institutional ownership to forecast the portfolios with the lowest institutional ownership is better than vice versa for the analyst coverage groups 3, 5, and 6.These findings imply that some institutional investors provide the market with additional market-wide information that is not the contribution of financial analysts.
Panel B1 (B2) of Table 6 presents the estimation results of the Granger-causality tests for the portfolios with the highest institutional ownership (i.e., Pih for i = 1, 2,…, and 6) and the equal-weighted (value-weighted) market portfolio, Pem (Pvm). Panel B1 of Table 6 shows that the sum of the
b coefficients is smaller than that of the
kc coefficients, and
k the null hypothesis that∑ bk = ∑ c
k is rejected at the 10% level for P3h
vs. Pem, indicating
that the ability of P3h
to forecast Pem is better than vice versa. A similar observation is made
for P3h
vs. Pvm in Panel B2 of Table 6. Consistent with the results of Panels B1 and B2 of
Tables 2 and 3, this implies that some institutional investors are market-wide information
discoverers and disseminators. However, both Panels B1 and B2 of Table 6 show that the
sum of the b coefficients is greater than that of the
k c coefficients, and the null
k
hypothesis that ∑ bk = ∑ c
k is rejected at conventional significance levels for the last
three analyst coverage groups, indicating that the ability of Pem and Pvm to forecast P4h
, P5h
,
and P6h
is better than vice versa. Consistent with the results of Panels B1 and B2 of Tables 2
and 3, this implies that some institutional investors are information receivers and
disseminators.
= ∑ c
k is rejected at conventional significance levels for the last three analyst coverage groups, indicating that the ability of Pem and Pvm to forecast P4h
, P5h
, and P6h
is better than vice versa. Consistent with the results of Panels B1 and B2 of Tables 2 and 3, this implies that some institutional investors are information receivers and disseminators.Panel C1 (C2) of Table 6 presents the estimation results of the Granger-causality tests for the portfolios with the lowest institutional ownership (i.e., Pil for i = 1, 2,…, and 6) and the equal-weighted (value-weighted) market portfolio, Pem (Pvm). Both Panels C1 and C2 of Table 6 show that the sum of the
b coefficients is greater than that of the
kc
k coefficients, and the null hypothesis that∑ bk = ∑ c
k is rejected at the 1% level for the
last three analyst coverage groups. This indicates that the ability of Pem and Pvm to forecast
P4l
, P5l
, and P6l
is better than vice versa. This is consistent with the results of Panels C1 and
C2 of Tables 2 and 3 that the firms held primarily by individual investors tend to respond
slowly to new market-wide information.
Table 7 reports the estimation results of the bivariate VAR for the institutional ownership-analyst coverage and the market portfolios. Panel A of Table 7 presents
t
he estimation results of the bivariate Granger-causality tests for 12 institutional ownership-analyst coverage portfolios, Pih (Portfolio A) versus Pil (Portfolio B), where h and l refer to the highest and lowest analyst coverage portfolios, respectively, within each institutional ownership group i. Based on the relative magnitudes of∑ bk and ∑ ck
and the rejection of the null statistic that
∑ bk = ∑ c
k at least at the 5% level, we find that
the ability of the portfolios with the highest analyst coverage to forecast the portfolios with
the lowest analyst coverage is better than vice versa for all institutional ownership groups.
This implies that financial analysts provide additional market-wide information that is not provided by institutional investors.
More importantly, the results suggest that the extent to which financial analysts offer additional information to the market is greater than the extent to which institutional investors offer additional information to the market. This is because, in Panel A of Table 6, the ability of the portfolios with the highest institutional ownership to forecast the portfolios with the lowest institutional ownership is better than vice versa for three of six analyst coverage groups, whereas in Panel A of Table 7, the ability of the portfolios with the highest analyst coverage to forecast the portfolios with the lowest analyst coverage is better than vice versa for all six institutional ownership groups. As such, our results suggest that financial analysts are relatively better informed about market-wide information than institutional investors.
Panel B1 (B2) of Table 7 presents the estimation results of the Granger-causality tests for the portfolios with the highest analyst coverage (i.e., Pih for i = 1, 2,…, and 6) and the equal-weighted (value-weighted) market portfolio, Pem (Pvm). Panel B1 of Table 7 shows no statistically significant difference in the relative ability of two portfolios to predict each other for all institutional ownership groups. The results of Panel B2 of Table 7 also show no statistically significant difference in the relative ability of the portfolios with the highest analyst coverage and the value-weighted market portfolio to predict each other for all institutional ownership groups.
Panel C1 of Table 7, which reports the results of the bivariate Granger-causality tests
for the portfolios with the lowest analyst coverage (i.e., Pil for i = 1, 2,…, and 6) and the equal-weighted market portfolio, Pem, shows that the ability of the equal-weighted market portfolio to forecast the portfolios with the lowest analyst coverage is better than vice versa for all institutional ownership groups. The results of the bivariate Granger-causality tests for the portfolios with the lowest analyst coverage (i.e., Pil for i = 1, 2,…, and 6) and the value-weighted market portfolio, Pvm, reported in Panel C2 of Table 7, show that the ability of the value-weighted market portfolio to forecast the portfolios with the lowest analyst coverage is better than vice versa for all institutional ownership groups. The results of Panels C1 and C2 of Table 7 are consistent with those of Panels C1 and C2 of Tables 4 and 5 in that the firms followed by fewer financial analysts to react sluggishly to new market-wide information.
3.4. The Relative Speed of the Diffusion of Good and Bad Market-Wide News across Investors
Table 8 reports the estimates of equation (3). Panels A and B of Table 8 report the results for the portfolios with the highest (Pih) and lowest (Pil )institutional holdings in six size groups and in six volume groups, respectively. The left-hand-side variable of the regression is Pil
for i = 1, 2, .. and 6. We find that βilUP,0
<
βilDN,0 , and the null hypothesis thatβ
iUP0 =β
iDN0 is rejected at the 1% level for all size and volume groups. We also find thatUP DN
1 1
K K
ik ik
k= β
>
k= β∑ ∑
, and the null hypothesis that UP DN1 1
K K
ik ik
k= β
=
k= β∑ ∑
is rejected atleast at the 5% level in all size groups in Panel of A and in three of six volume groups in Panel B.
12
These findings suggest that the portfolios with the lowest institutional holdings respond more sluggishly to good market-wide news than to bad market-wide news.Similarly, Panels C and D of Table 8 report the results for the portfolios with the highest (Pih) and lowest (Pil )analyst coverage in six size groups and in six volume groups, respectively. Again, the left-hand-side variable of the regression is Pil for i = 1, 2, .. and 6.
The observation that βilUP,0
<
βilDN,0,
with the rejection of the null hypothesis thatβ
iUP0 =β
iDN0 at conventional significance levels, and that UP DN1 1
,
K K
ik ik
k= β
>
k= β∑ ∑
with the rejection of
12