ISSN: 0163-5581 print / 1532-7914 online DOI: 10.1080/01635581.2011.535966
Usefulness of the Mini Nutritional Assessment in Predicting the Nutritional Status of Patients With Liver Cancer
in Taiwan
Alan C. Tsai
Department of Healthcare Administration, Asia University, and Department of Health Services Management, School of Public Health, China Medical University, Taichung, Taiwan
Wei-Chung Hsu
Department of Radiation Oncology, Cheng-Ching General Hospital, Taichung, Taiwan
Shu-Ching Chan and Tusi-Lan Chang
Department of Healthcare Administration of Asia University, Taichung, Taiwan
Liver cancer patients are confronted with the additional risk of malnutrition because the disease is often associated with hepatitis, liver cirrhosis, and metabolic disturbances. Nutritional interven- tion can improve treatment outcome, but early detection is impor- tant. This study aimed to determine whether the Mini Nutritional Assessment (MNA) could effectively rate the nutritional status of patients with liver cancer in Taiwan. A total of 300 patients were evaluated for nutritional status with two modified versions of the MNA in short and long forms. MNA-Taiwan Version 1 adopted population-specific anthropometric cutpoints, whereas Version 2 replaced mid-arm and calf circumferences in place of body mass index. Predicted statuses were compared to results predicted by the Council on Nutrition Appetite Questionnaire (CNAQ) and an- alyzed for correlations with biochemical or cancer status parame- ters. Results showed that both versions of the MNA were effective in predicting nutritional status, and predictions by the short forms agreed well with those by the long forms. The nutritional scores cor- related well with hemoglobin, serum albumin, C-reactive protein, r-glutamyl transpeptidase, TNM (tumor, node, metastasis) staging, and severity of cirrhosis. These results suggest that the MNA can be an effective tool for assessing the nutritional status of patients with liver cancer.
INTRODUCTION
Cancer patients are at high risk of malnutrition, and patients with liver cancer may have additional nutritional risk because they often have hepatitis, liver cirrhosis, and neoplastic cachexia.
Submitted 1 December 2009; accepted in final form 16 May 2010.
Address correspondence to Alan C. Tsai, Department of Healthcare Administration, Asia University, 500 Liufeng Rd., Wufeng, Taichung, Taiwan 41354. Phone: 886-4-2332 3456 ext. 1943. Fax: 886-4-2332- 1206. E-mail: [email protected]
These patients are often confronted with anorexia, involuntary weight loss, muscle wasting, anemia, malnutrition, and other metabolic abnormalities (1,2). Poor nutrition or depleted nutri- tional reserve may adversely affect a patient’s prognosis, toler- ance to treatment, susceptibility to diseases and infections, qual- ity of life, and even survival. Early detection and timely interven- tion is important. Proper assessment tools are needed to monitor the progress of intervention. To be an effective routine proce- dure, the tool needs to be simple, reliable, low-cost, and noninva- sive, as well as easily applied without requiring extensive profes- sional background or training. The Mini Nutritional Assessment (MNA) is a tool that meets these conditions (3–5), but it has not yet been robustly validated for use in cancer patients—although it has been suggested to be an appropriate tool for identifying cancer patients at risk of malnutrition (6). A recent study has further shown that the MNA has good sensitivity and moder- ate specificity using the Scored Patient-Generated Subjective Global Assessment (PGSGA) as the gold standard (7).
Malignant tumors are the leading cause of death in Taiwan, and liver cancer is the leading tumor in men (8). Although nu- trition plays a well-known role in the prognosis and treatment outcome of cancer patients, relatively little attention has been paid to monitoring their nutritional status on a routine basis.
Therefore, the objective of this study was to determine the use- fulness of the MNA in predicting the nutritional status of patients with liver cancer in Taiwan. Two modified versions of the MNA were examined: one using the population-specific anthropomet- ric cutpoints (a content-equivalent version) and another further with the BMI item in the scale replaced by mid-arm (MAC) and calf circumferences (CC). A scale without BMI will elimi- nate the need of weight measurement, which can be thrown off because of ascites or edema in cancer patients.
334
METHODS
The study employed a convenience sampling and recruited outpatients with liver cancer of a hospital in central Taiwan to participate in the study. Patients who were 30 yr or older, able to communicate verbally, and willing to sign a written study consent were recruited. A total of 300 consecutive patients (239 men and 61 women) agreed to participate in the study, which took place from August 15, 2007 to January 31, 2008. The Institutional Review Board of the hospital approved the study protocol.
In addition to the routine clinical procedure, each participant was also interviewed with a structured questionnaire for elicit- ing personal demographic, lifestyle, and health-related data and answers to questions in the Council on Nutrition Appetite Ques- tionnaire (CNAQ) (9) and the MNA, and measured for weight, height, MAC and CC (10). An overnight fasting blood sample was taken for measurement of hemoglobin, blood urea nitrogen, serum albumin, cholesterol, C-reactive protein (CRP), creati- nine, r-glutamyl trans-peptidase (r-GT), and alpha-fetoprotein (AFP) as a part of their routine laboratory tests.
CNAQ is a validated appetite/nutrition risk assessment tool.
It can predict a 5% weight loss in 6 mo. This 8-item question- naire has a maximum of 40 points, and those who score fewer than 28 points are considered to have impaired appetite status (9). The nutritional status of each subject was assessed with 2 slightly modified versions of the MNA: Taiwan version-1 and -2 (MNA-T1 and -T2). The MNA-T1 adopts Taiwanese-specific anthropometric cutpoints and is considered a content equivalent version of the original MNA for Taiwanese (11). The MNA-T2 displaced BMI from the scale by reassigning the weighted score of BMI to the MAC and CC items (12,13).
Hepatitis status was classified according to the infected viruses: Types B, C, non B–non C, and B and C. Liver cirrhosis status was graded with the Child-Pugh classification (14,15).
The stage of liver cancer was classified according to TNM (tu- mor, node, and metastasis) staging set forth by the 6th edition of AJCC/UICC (American Joint Committee on Cancer and In- ternational Union Against Cancer) (16).
Results were analyzed with SPSS version 12.0 (SPSS, Inc., Chicago, IL) computer software. Spearman’s correlation analy- sis was employed to determine the significance of the relation- ship between the MNA scores and each of the demographic, lifestyle, health, and biochemical parameters. A binary clas- sification test was used to determine the agreement between results predicted with the MNA and the CNAQ. Receiver oper- ating characteristics (ROC) curves were generated for the MNA versions using CNAQ as the reference, and for the short-form MNA versions using the long-form versions as the references.
Statistical significance was accepted atα = 0.05.
RESULTS
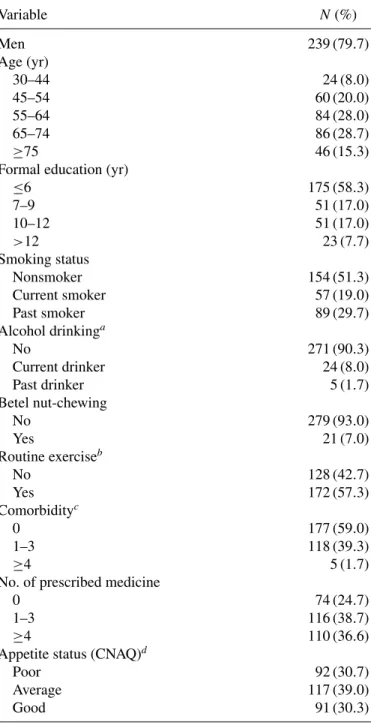
The characteristics of subjects are summarized in Table 1.
The majority (80%) of patients were males. Most (77%) subjects
TABLE 1
Characteristics of subjects (N= 300)
Variable N (%)
Men 239 (79.7)
Age (yr)
30–44 24 (8.0)
45–54 60 (20.0)
55–64 84 (28.0)
65–74 86 (28.7)
≥75 46 (15.3)
Formal education (yr)
≤6 175 (58.3)
7–9 51 (17.0)
10–12 51 (17.0)
>12 23 (7.7)
Smoking status
Nonsmoker 154 (51.3)
Current smoker 57 (19.0)
Past smoker 89 (29.7)
Alcohol drinkinga
No 271 (90.3)
Current drinker 24 (8.0)
Past drinker 5 (1.7)
Betel nut-chewing
No 279 (93.0)
Yes 21 (7.0)
Routine exerciseb
No 128 (42.7)
Yes 172 (57.3)
Comorbidityc
0 177 (59.0)
1–3 118 (39.3)
≥4 5 (1.7)
No. of prescribed medicine
0 74 (24.7)
1–3 116 (38.7)
≥4 110 (36.6)
Appetite status (CNAQ)d
Poor 92 (30.7)
Average 117 (39.0)
Good 91 (30.3)
CNAQ= Council on Nutrition Appetite Questionnaire.
aDefined as ≥1 time/mo. But all positive responders drank >3 times/wk.
b≥2 times/wk and ≥30 min/day.
cComorbidities included heart disease, diabetes mellitus, hyperten- sion, hyperlipidemia, respiratory disease, kidney disease, and stroke.
dAssessed with Council on Nutrition appetite questionnaire (9).
were 45 to 74 yr old. More than half (59%) of the subjects had no comorbidity, 39% had 1–3, and 2% had 4 or more. Thirty- nine percent of the subjects were taking 1–3 kinds of prescribed medicine, 37% were taking 4 or more, and 25% were not taking
TABLE 2
Distribution (N,%) of nutritional status graded with the long-form and short-form MNA-T1 and -T2 Version Malnourished At risk Normal Testa Long-form
MNA-T1 5 (1.7) 142 (47.3) 153 (51.0) A, B∗ MNA-T2 7 (2.3) 125 (45.0) 158 (52.7) A, D Short-form
MNA-T1 164 (54.7) 136 (45.3) C∗, B
MNA-T2 152 (50.7) 148 (49.3) C, D
MNA= Mini Nutritional Assessment; T1 & T2 = Taiwan version 1 & 2.
aDistributions indicated by the same alphabet are compared for significant difference with Wilcoxon Matched-Pairs Signed-Rank Test.
Comparison A: Z= −0.905 (P > 0.05); B: Z = −2.592 (P < 0.05);
C: Z= −3.00 (P < 0.05); and D: Z = −1.443 (P > 0.05).
∗P< 0.05.
any. Thirty-one percent of the subjects had poor appetite, 39%
had fair appetite, and only 30% had good appetite, according to CNAQ.
The MNA-T1-LF graded 2% of the subjects as malnour- ished, 47% at risk of malnutrition, and 51% normal, whereas the MNA-T2-LF graded 2%, 45%, and 53%, respectively (P> 0.05) (Table 2). The MNA-T1-SF rated 55% at high risk of malnutri- tion and 45% at low risk, whereas the MNA-T2-SF rated 51%
and 49%, respectively (p< 0.05).
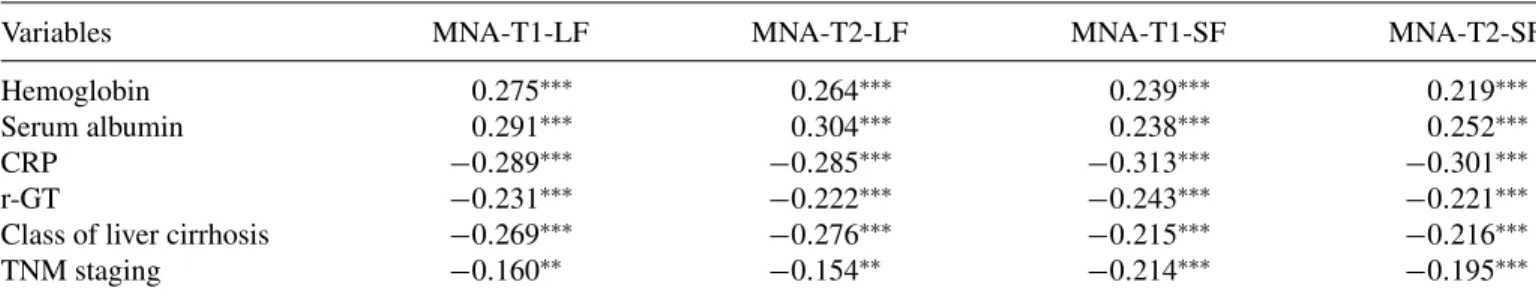
Table 3 shows the Spearman’s correlation coefficients (r) of the MNA scores with each of the nutrition- or cancer status- related parameters. The strength of the relationship between the 2 long-form MNA versions or the 2 short-form versions was relatively similar. Hemoglobin, serum albumin, and the class of liver cirrhosis had slightly stronger relationships with the long-form versions compared to the short-form versions.
On the other hand, CRP and TNM staging had slightly stronger relationships with the short-form versions compared to the long- form versions. Both long-form and short-form MNA versions had similar strength of relationship to r-GT.
Table 4 shows the binary classification tests of the nutritional risk statuses predicted with the short-form versions using re- sults predicted with the long forms as the “gold standard.” Test characteristics were sensitivity (0.922), specificity (0.804), and kappa (0.714 for T1-SF; 0.837, 0.810, and 0.647, respectively, for T2-SF). When using T2-LF as the “gold standard,” the re- spective values were 0.901, 0.772, and 0.668 for T1-SF, and 0.866, 0.816, and 0.680 for T2-SF.
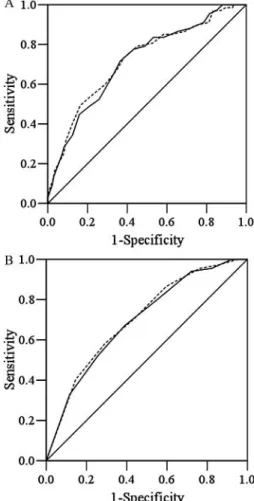
Analysis with ROC showed that areas under the curve (AUC) generated by the 2 versions were very similar: 0.714 and 0.720 for T1-LF and T2-LF, and 0.696 and 0.704 for T1-SF and T2- SF, respectively, using the predictions made with CNAQ as the reference (Fig. 1).
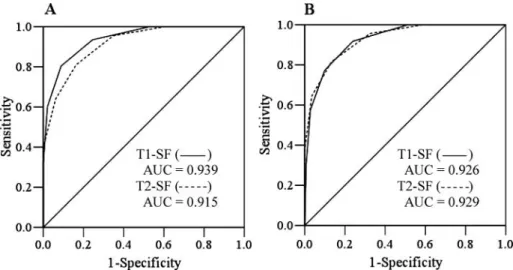
Figure 2 shows that the AUC generated by the 2 short-form MNA versions agreed well with predictions made with the 2 long-form versions. The AUC was 0.939 for T1-SF and 0.915 for T2-SF using MNA-T1-LF as the “gold standard”; and 0.926 and 0.929, respectively, using T2-LF as the “gold standard.”
Subjects’ cancer-related information, anthropometric and bio- chemical data, and scoring patterns of the MNA items are sum- marized in Appendixes 1, 2, and 3, respectively.
DISCUSSION
Predicting the Nutritional Status
Results of the present study suggest that the MNA is effective in predicting the nutritional status of patients with liver cancer.
Both versions (T1 and T2) rated similar proportions of patients malnourished or at risk of malnutrition. The nutritional scores rated with the 2 versions are strongly correlated with nutritional indicators such as serum albumin and hemoglobin levels. Re- sults also agree well with the appetite status evaluated with the CNAQ. These results suggest the MNA is capable of predicting the nutritional status of patients with liver cancer.
The MNA has been suggested as a tool that can potentially help determine the most appropriate diagnostic procedures and the best therapeutic strategies by identifying individuals at risk of malnutrition and measuring the efficacy of nutritional in- terventions in cancer patients (6). However, few studies have
TABLE 3
Spearman’s correlation coefficient (r) of the MNA scores with each of the biochemical and anthropometric parameters (N= 300)
Variables MNA-T1-LF MNA-T2-LF MNA-T1-SF MNA-T2-SF
Hemoglobin 0.275∗∗∗ 0.264∗∗∗ 0.239∗∗∗ 0.219∗∗∗
Serum albumin 0.291∗∗∗ 0.304∗∗∗ 0.238∗∗∗ 0.252∗∗∗
CRP −0.289∗∗∗ −0.285∗∗∗ −0.313∗∗∗ −0.301∗∗∗
r-GT −0.231∗∗∗ −0.222∗∗∗ −0.243∗∗∗ −0.221∗∗∗
Class of liver cirrhosis −0.269∗∗∗ −0.276∗∗∗ −0.215∗∗∗ −0.216∗∗∗
TNM staging −0.160∗∗ −0.154∗∗ −0.214∗∗∗ −0.195∗∗∗
MNA= Mini Nutritional Assessment; T1 and T2 = Taiwan version 1 and 2; CRP = C-reactive protein; r-GT = r-glutamyl transpeptidase;
TNM= tumor, node, metastasis.
∗∗P< 0.01.∗∗∗P< 0.001.
TABLE 4
Binary classification tests of the nutritional status of patients graded with the short-form MNA versions against the outcome graded with the long-form versions
MNA-T1-LF MNA-T2-LF
MNA-T2-LF UN Normal Kappa UN Normal Kappa
MNA-T1-SF
At risk 134 (91.2) 30 (19.6) 0.714 128 (90.1) 36 (22.8) 0.668
Normal 13 (8.8) 123 (80.4) 14 (9.9) 122 (77.2)
MNA-T2-SF
At risk 123 (83.7) 29 (19.0) 0.647 123 (86.6) 29 (18.4) 0.680
Normal 24 (16.3) 124 (81.0) 19 (13.4) 129 (81.6)
MNA= Mini Nutritional Assessment; T1 and T2 = Taiwan version 1 and 2; LF = long-form; SF = short-form; UN = undernutrition (malnourished+ at risk portions).
FIG. 1. Receiver operating characteristic (ROC) curves for MNA-T1LF (———) and MNA-T2-LF (- - - - -) scores (Chart A), and MNA-T1-SF (———) and MNA-T2-SF (- - - - -) scores (Chart B) using the CNAQ score (≤28 points) as the reference in liver cancer patients. The areas under the curve (AUC) were 0.714 (95% CI= 0.644–0.783) and 0.720 (0.649–0.791) for T1-LF and T2-LF, respectively, in Chart A, and 0.696 (0.627–0.765) and 0.704 (0.636–0.772) for T1-SF and T2-SF, respectively, in Chart B. All P< 0.05. MNA = Mini Nutri- tional Assessment; T1 and T2= Taiwan version 1 and 2; SF = short form; LF
= long form.
demonstrated the usefulness of the MNA in grading the nutritional status of cancer patients. Slaviero et al. (17) ob- served strong interrelationships between biochemical and an- thropometric measures and the MNA scores in cancer patients and found that the baseline weight loss status was highly corre- lated with MNA scores and plasma CRP.
More recently, Read et al. (7) evaluated the predictive ability of the MNA using predictions made with PGSGA as the refer- ence and found that the MNA had good sensitivity (79–97%) but more moderate specificity (54–82%) at various stages of a nutritional intervention in cancer patients. These results suggest that the MNA is capable of correctly classifying patients who are truly malnourished but slightly less capable of identifying those who are not malnourished using the PGSGA as the reference.
Short-Form vs. Long-Form
As demonstrated in the ROC curves, results predicted with both short-form MNA versions agree well with those predicted with long-form versions. Binary classification tests also show that both short-form versions have high sensitivity against long- form versions. The 2 short-form versions can identify 84% to 92% of those who are identified at risk by the long-form ver- sions. The rate of false positive is also relatively low (18–23%).
Furthermore, it should be remembered that nutritional risk is along a continuum; the false positives and the false negatives are likely to be in an ambiguous state. When compared to in- dependent nutritional or cancer staging or severity indicators, the short-form MNA versions generally perform favorably and, in some cases, even better than the long-form versions. These results suggest that the short-form versions are capable of identi- fying most patients with cancer who are at risk of malnutrition.
With frequent screening, the risk of missing a positive case would be relatively low.
MNA-T1 vs. T2
Results suggest that the MNA-T1 and -T2 have compara- ble ability to predict the nutritional status and to reflect the stage of liver cancer or functional status of patients with liver
FIG. 2. Receiver operating characteristic (ROC) curves for MNA-T1-SF and MNA-T2-SF using MNA-T1-LF (MNA score≤23.5) in Chart A, and MNA-T2-LF in Chart B as the reference, respectively. The areas under the curve (AUC) were 0.939 (95% CI= 0.915–0.963) and 0.915 (0.885–0.945) for MNA-T1-SF and MNA-T2-SF, respectively, in Chart A; and 0.926 (0.898–0.954) and 0.929 (0.902–0.955) for MNA-T1-SF and MNA-T2-SF, respectively, in Chart B. All P< 0.05.
MNA= Mini Nutritional Assessment; T1 and T2 = Taiwan version 1 and 2. SF = short form; LF = long form.
cancer. MNA-T2 has been shown to be an effective alterna- tive to MNA-T1 in elderly patients from various living settings (12,13,18,19). The availability of an alternative version with- out weight and height measurements is a significant improve- ment and would improve the applicability of the MNA in places where a weighing scale is not a common household item or for patients who have ascites or edema, which may throw off weight measurement.
The MNA, in addition to predicting the nutritional status, also reflects liver functional status. The nutritional scores graded with the MNA-T1 and -T2 are positively correlated with nutritional indicators such as hemoglobin and serum albumin and are neg- atively correlated with liver inflammation indicators (CRP), the severity of liver cirrhosis, the stage of liver tumor, and serum r-GT. Serum albumin reflects nutritional status but is also in- dicative of liver functional status. In patients with liver cancer, nutritional status is influenced not only by nutrient intake but also by the functional status of the liver. As the tumor progresses, hepatitis and cirrhosis (which are often associated with liver tu- mors) can impair liver function. Thus, in these patients, drastic changes in appetite and nutritional status can occur abruptly.
Close monitoring of nutritional status is important in cancer patients.
Limitations of the Study
This study has some obvious limitations. Cancer patients vary in the type and stage of cancer, comorbidity, treatment, and self-imposed lifestyle changes. The results of the present study reflect the general condition and treatment of the par- ticipating subjects. The present study involved only community home-dwelling subjects from 1 hospital in central Taiwan. Thus, the generalizability of study results should be interpreted with caution. In patients with advanced liver cancer, ascites may be a
problem and that can complicate anthropometric measurements.
Since patients’ appetite is influenced by both dietary intake and liver functional status, the nutritional status of liver cancer pa- tients can change rather drastically and abruptly. Frequent mon- itoring would be especially important in these patients.
CONCLUSION
Using CNAQ and a list of nutritional and cancer staging or liver functional indicators as references, this study has demon- strated that the MNA is a useful tool in predicting the nutritional status of patients with liver cancer. The results also have demon- strated that a modified version without BMI can function ade- quately compared to a content-equivalent version of the MNA that adopted Taiwanese-specific anthropometric cutpoints. The study further shows that both of the short-form versions perform well compared to the long-form versions. These results suggest that both the long form and short -form of both versions can be used to monitor the nutritional risk of patients with liver cancer.
ACKNOWLEDGMENTS
This study was partially supported by Cheng-Ching General Hospital Research Fund (CH970098). We thank the patients for their cooperation in this study.
REFERENCES
1. Argiles JM: Cancer-associated malnutrition. Eur J Oncol Nurs 9(Suppl 2), S39–S50, 2005.
2. Davies M: Nutritional screening and assessment in cancer-associated mal- nutrition. Eur J Oncol Nurs 9(Suppl 2), S64–S73, 2005.
3. Guigoz Y, Vellas BJ, and Garry PJ: The Mini Nutritional Assessment (MNA): a practical assessment tool for grading the nutritional state of elderly patients. In: Facts and Research in Gerontology. Vellas BJ, Guigoz Y and Albarede JL (eds.). New York: Sprinker, 1994, pp. 15–59.
4. Guigoz Y, Vellas B, and Garry PJ: Assessing the nutritional status of the elderly: the Mini Nutritional Assessment as part of the geriatric evaluation.
Nutr Rev 54(Suppl), S59–S65, 1996.
5. Guigoz Y, Lauque S, and Villas BJ: Identifying the elderly at risk for mal- nutrition: the Mini Nutritional Assessment. Clin Geriatr Med 18, 737–757, 2002.
6. Zulian GB, Gold G, Herrmann F, and Michel JP: Mini Nutritional Assess- ment and cancer. Nestle Nutr Workshop Ser Clin Perform Programme 1, 93–100, 1999.
7. Read JA, Crockett N, Volker DH, MacLennan P, Choy STB, et al.: Nutri- tional assessment in cancer: comparing the Mini-Nutritional Assessment (MNA) with the scored Patient-Generated Subjective Global Assessment (PGSGA). Nutr Cancer 53, 51–56, 2005.
8. Death Cause Statistics of 2008, Taiwan. http://www.doh.gov.tw/CH T2006/DM2 2.aspx?now fod list no=10642&class no=440&level no=3.
Accessed October 21, 2009.
9. Wilson MMG, Thomas DR, Rubenstein LZ, Chibnall JT, Anderson S, et al.:
Appetite assessment: simple appetite questionnaire predicts weight loss in community-dwelling adults and nursing home residents. Am J Clin Nutr 82, 1074–1081, 2005.
10. Lee RD and Nieman DC: Biochemical assessment of nutritional status.
In: Nutritional Assessment (3rd ed.), Lee RD and Nieman DC (eds.). New York: McGraw-Hill, 2003, pp. 303–337.
11. Tsai AC, Ho CS, and Chang MC: Population-specific anthropometric cut- points improve the functionality of the Mini Nutritional Assessment (MNA) in elderly Taiwanese. Asia Pacific J Clin Nutr 16, 656–662, 2007.
12. Tsai AC, Ku PY, and Tsai J-D: Population-specific anthropometric cutoff standards improve functionality of the Mini-Nutritional Assessment with- out BMI in institutionalized elderly in Taiwan. J Nutr Health Aging 12, 696–700, 2008.
13. Tsai AC, Chou YT, Chang TL, Chang-Lee SN, and Tsay SF: A modified Mini Nutritional Assessment without BMI can effectively assess the nu- tritional status of neuropsychiatric patients. J Clin Nurs 18, 1916–1922, 2009.
14. Child CG and Turcotte JG: Surgery and portal hypertension. In: The Liver and Portal Hypertension, Child CG III (ed.). Philadelphia: W.B. Saunders, 1964, pp. 57–72.
15. Pugh RNH, Murray-Lyon IM, Dawson JL, Pietroni MC, and Williams R:
Transection of the oesophagus for bleeding oesophageal varices. Br J Surg 60, 649, 1973.
16. Greene FL, Page DL, Fleming ID, Fritz A, Balch CM, et al.: Part III-14.
Liver (including intrahepatic bile ducts). In AJCC Cancer Staging Manual (6th ed.), Greene FL, Page DL, Fleming ID, Fritz A, Balch CM, et al. (eds.).
New York, Springer-Verlag, 2002, pp. 131–138.
17. Slaviero KA, Read JA, Clarke SJ, and Rivory LP: Baseline nutritional assessment in advanced cancer patients receiving palliative chemotherapy.
Nutr Cancer 46, 148–157, 2003.
18. Tsai AC and Shih CL: A population-specific Mini Nutritional Assessment can effectively grade the nutritional status of stroke rehabilitation patients in Taiwan. J Clin Nurs 18, 82–88, 2008.
19. Tsai AC, Lu SJ, and Chang TL: Modified Mini Nutritional Assessment can effectively assess the nutritional status of patients on hemodialysis. J Ren Nutr 19, 380–388, 2009.
APPENDIX 1
Cancer-related information of subjects (N= 300)
Type of Hepatitis n (%)
Non-B, C 30 (10.0)
B 148 (49.3)
C 108 (36.0)
B and C 14 (4.7)
Liver cirrhosis statusa
A 202 (67.4)
B 88 (29.3)
C 10 (3.3)
TNM stagesb
1 22 (7.3)
2 103 (34.3)
3 126 (42.0)
4 49 (16.3)
aChild Classification of liver cirrhosis. Class A (5–7 points) is mild, B (8–10 points) is moderate, and C (11–15 points) is severe cirrhosis.
bTNM (tumor, node, metastasis) staging—based on AJCC/UICC (American Joint Committee on Cancer and International Union Against Cancer) criteria. Stage 1 is T1, N0, and M0; Stage 2 is T2, N0, and M0; stage 3 is T3/4, N0, and M0, or any T, N1, and M0; and Stage 4 is M1 and any T and any N. T-staging (tumor size) has four stages, T1, T2, T3, and T4; N-staging (lymph node metastasis) is classified N0 (no regional metastasis) or N1 (regional metastasis); and M-staging is classified M0 (no distant metastasis) or M1 (distant metastasis).
APPENDIX 2
Anthropometric and serum biochemical parameters (Mean± SD) of subjects (N = 300)a
Parameter Mean± SD %
Height (cm)
Men 166.0 ± 6.2
Women 154.4 ± 5.6
Weight (kg)
Men 64.3 ± 11.0
Women 54.8 ± 10.1
BMI (kg/m2)
Men 23.3 ± 3.6
Women 23.0 ± 4.0
Mid-arm circumference (cm)
Men 27.2 ± 3.3
Women 27.1 ± 3.8
Calf circumference (cm)
Men 35.0 ± 3.8
Women 32.8 ± 3.9
Hemoglobin (g/dL) 12.6 ± 2.0
<12/10bg/dL 28.7
Serum albumin (g/dL) 3.6 ± 1.9
<3.5 g/dL 46.3
Serum cholesterol (mg/dL) 173.7 ± 48.7
<150 mg/dL 34.0
Serum CRP (mg/dL) 2.1 ± 3.4
>1.0 mg/dL 42.2
BUN (mg/dL) 18.0 ± 11.2
>20 mg/dL 25.2
Serum creatinine (mg/dL) 1.3 ± 1.2
>1.5 mg/dL 16.8
r-GT (U/L) 219.3 ± 261.1
>75 U/L 71.8
AFP (ng/mL)
11.5× 10³± 24.3 × 10³
>400 ng/mL 42.8
CRP = C-reactive protein; r-GT = r-glutamyl transpeptidase;
AFP= alpha-fetoprotein; BUN = blood urea nitrogen.
a239 men and 61 women.
bCutpoints for men/women, respectively.
APPENDIX 3
Scoring patterns of the MNA questions (N= 300)
Component (Item Score) Assigned Score % A. Food intake declined over the past 3 mo (2)
Severe 0 6.0
Moderate 1 44.0
No decline 2 50.0
B. Weight loss during last month (3)
>3 kg 0 31.0
Does not know 1 3.3
1–3 kg 2 24.0
No loss 3 41.7
C. Mobility (2)
Bed or chair-bound 0 0.7
Able to get out bed but does not go out 1 4.6
Goes out 2 94.7
D. Psychological stress/acute disease during past 3 mo (2)
Yes 0 31.3
No 2 68.7
E. Neuropsychological problems (2)
Severe dementia or depression 0 1.0
Mild dementia 1 2.0
No psychological problems 2 97.0
F. BMI (kg/m2) (3) (a) T1
<17 0 1.7/4.9a
17–19 1 7.9/13.1
19–21 2 17.6/8.2
>21 3 72.8/73.8
(b) T2 (0) Replaced with CC, item R G. Live independently (1)
No 0 5.7
Yes 1 94.3
H. Takes 4 or more kinds of prescribed drugs/day (1)
Yes 0 36.7
No 1 63.3
I. Pressure sores or skin ulcers (1)
Yes 0 5.3
No 1 94.7
(Continued on next page)
J. Full meals daily (2)
1 0 0.7
2 1 7.6
3 2 91.7
K. Daily consumption of protein-rich food (1)
0 or 1 “yes” 0 4.0
2 “yes” 0.5 25.3
3 “yes” 1 70.7
L. Consumes≥2 servings of fruits or vegetables per day (1)
No 0 10.7
Yes 1 89.3
M. Cups of water/fluid consumed (1)
<3 0 0.0
3–5 0.5 29.0
>5 1 71.0
N. Mode of feeding (2)
Unable to eat without assistance 0 0.3
Self-fed with difficulty 1 2.0
Self-fed with any problem 2 97.7
O. Self view of nutritional status (2)
Views self as being malnourished 0 26.0 Uncertain of nutritional status 1 34.0
No nutritional problem 2 40.0
P. Self view of health status compared to peers (2)
Not as good 0 54.0
Does not know 0.5 17.7
As good 1 20.6
Better 2 7.7
Q. MAC (cm) (a) T1 (1)
<22.5/21a 0 5.1/3.3a
22.5–23.5/21–22 0.5 5.4/6.5
>23.5/22 1 89.5/90.2
(b) T2 (2)
<22.5/21 0 5.1/3.3
22.5–23.5/21–22 1 5.4/6.5
>23.5/22 2 89.5/90.2
R. CC (cm) (a) T1 (1)
<28/25 0 1.7/6.6
>28/25 1 98.3/93.4
(b) T2 (3)
<28/25 0 1.7/1.6
28–29/25–26 1 3.8/0.0
29–30/26–27 2 2.9/3.3
>30/27 3 91.6/95.1
MNA= Mini Nutritional Assessment; BMI = body mass index;
MAC= mid-arm circumference; CC = calf circumference.
aValues for men/women, respectively.