1
交通部中央氣象局
委託研究計畫 ( ( 期 期 末 末 )成果報告 )
利用
W
波相逆推震源參數與單位海嘯建立南中國海海嘯預警系統計畫類別:□氣象 □海象 ■地震 計畫編號:MOTC-CWB-100-E-09-
執行期間: 100 年 1 月 1 日至 100 年 12 月 31 日 計畫主持人:陳伯飛
執行機構:國立中央大學地科系
中華民國 一百年 十一 月 二十五 日
2
政府研究計畫 (期 ( 期中 中 )報告摘要資料表 )
計畫中文名稱 利用 W 波相逆推震源參數與單位海嘯建立南中國海
海嘯預警系統
計畫編號 MOTC-CWB-100-E-09
主管機關 交通部中央氣象局
執行機構 國立中央大學地科系
年度 100 執行期間 100.1.1 ~ 100.12.31
本期經費 (單位:元)
345,000
執行進度 預定(%) 實際(%) 比較(%)
100 100 0
經費支用 預定(元) 實際(元) 支用率(%)
345,000 345,000 100.0
研究人員
計畫主持人 協同主持人 研究助理
陳伯飛 葉仁傑
報告頁數 23 使用語言 英文
中英文關鍵詞 關鍵字:海嘯預警、W波相、單位海嘯
Keywords:Tsunami Warning, W phase, Unit Tsunami
研究目的 位於南中國海東緣的馬尼拉沒隱帶,南北綿延超過 1000
公里,俱備大地震的孕震條件,並可能觸發大規模海嘯。此觸 發之海嘯約一至兩個小時傳播至台灣沿岸,雖有太平洋海嘯中 心的警報,若能及時預測海嘯的波高與到時,可大幅增加海嘯 預警的準確性,降低誤報的機率。本研究即針對馬尼拉沒隱帶 的海嘯地震,建立台灣地區的預警系統。
3
計畫名稱:利用 W 波相逆推震源參數與單位海嘯建立南中國 海海嘯預警系統
計畫主持人:中央大學地球科學系 陳伯飛 助理教授
1. Introduction
Historically, the tsunami hazards in Taiwan occurred in the North and SW coasts (Soloviev and Go 1974). Those at SW Taiwan are believed to be triggered by earthquakes in the Manila subduction zone and amplified by the steep slope of the South China Sea (SCS) shelf [Figure 1]. Although the length of the Manila trench – extending southward more than 1000 km from offshore South Taiwan to Mindoro island – is potentially plausible to accommodate strain energy of an Mw
9.0 earthquake, it is unclear whether strain energy of such an mega-earthquake will be accumulated or not on the Manila subduction zone. The earthquake catalogue only extends about 100 years backward in time and is thus unable or uncertain for the answer. Instead of arguing whether or not there will be a Mw 9.0 in the Manila subduction zone, we endeavor to establish a tsunami warning system in Taiwan for earthquakes in the SCS region. An effective tsunami warning system must be able to rapidly predict the arrival times and amplitudes of approaching tsunami waves before they arrive. Recently, unit tsunami method has been widely adopted (e.g., Liu et al. 2009) to circumvent the time consuming stage of simulating tsunami propagation by pre-calculating tsunami waves of a unit source (unit tsunami) stored in database. The tsunami waves of a real event are then synthesized by linear combination of unit tsunamis with associated weighting factors corresponding to the event. The methodology is conceptually analogous to that of Green’s function. The difference between tsunami warning and seismic tsunami warning is that the former inverts the weighting factors from tsunami waves detected by existing Dart buoys and the latter determines those by vertical seafloor displacements calculated from earthquake parameters such as location, size, and focal mechanism. While the locations of buoys relative to tsunamigenic earthquake are crucial for the success of the former, rapid determinations of reliable earthquake parameters are the key for that of the latter.
In this regard, Kanamori and Rivera (2008) proposed that source inversion of W phase is very suitable for the purpose of seismic tsunami warning system because W phase carries long period energies (100~1000s) of earthquakes with fast group
4
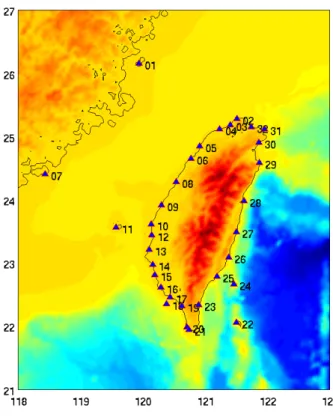
velocity (4.5~9 km/s) and arrives before S phase. Kanamori and Rivera (2009) further demonstrates that W phase inversion is also applicable for regional earthquakes ( Δ<12°) when broadband array (e.g., the Japanese F-net) are available. Here, we combine W phase inversion and unit tsunami method to build a tsunami warning system in Taiwan for earthquakes in the Manila subduction zone. We first assess the applicability of W phase inversion for earthquakes in the SCS region using data of Broadband Array in Taiwan for Seismology (BATS; Kao et al., 1998), of a few stations from F-NET, and of a couple of stations from the Malaysian National Seismic Network [Figure 2]. The selection of stations is to mimic the future distributions of an ongoing project to extend the current BATS by incorporating stations in Vietnam and the Philippines (see Fig. 10 in Huang et al., 2009). We expect that the full operation of extended BATS in the near future will significantly improve results of W phase inversion for SCS earthquake parameters with more azimuthal coverage. Secondly, we divide source region of the Manila subduction zone into subregion of unit source. The unit tsunamis of each unit source for the 32 existing Central Weather Bureau (CWB) tidal stations are calculated and stored in database from which we predict arrival times and synthesize tsunami waves. A Mw 9.0 scenario earthquake is used to compare with results of unit tsunami approach and those of real-time approach.
2. Methods
2.1 W Phase Inversion
We refer readers to Kanamori and Rivera (2008) regarding theory, modeling, and source inversion of W phase. We recapitulate here that W phase can be interpreted as superposition of the fundamental mode, first, second and third overtones of spheroidal modes at long period and can be synthesized by normal-node summation. The Green’s functions of six moment tensor elements are pre-computed for a distance range of 0°≦Δ≦90° with an interval of 0.1°
and for a depth range of 0-760 km. The synthetic waveforms of an earthquake are derived by convolving the Green’s function with its moment rate function, which is a triangular function defined by two parameters, half duration, th, and the centroid delay, td [Figure 3]. The broadband seismic data are deconvolved to displacement with instrument response removed and a band-pass filtered. A time period of 15Δs (Δ epicentral distance in degree) from the beginning of P wave is windowed to extract W phase. A time domain recursive method is used not only for real time operation but also for using available data to the point where it gets
5
clipped at the large amplitude S or surface waves. The same procedures are applied on synthetic waveform and, together with data, a linear inversion is performed on concatenated time series using a given hypocenter location and origin time.
2.2 Building Database of Unit Tsunamis
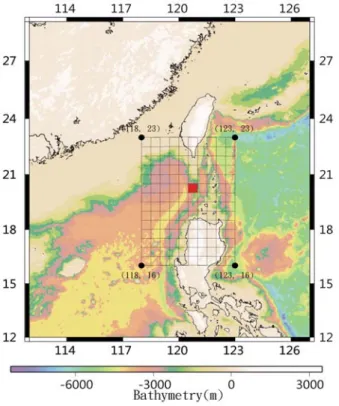
The potential source region of the Manila subduction zone is divided into 14×10 subregions of square each with 0.5∘×0.5∘in size and assigned with 1 m initial vertical seafloor displacement as unit source [Figure 4]. The propagations of each unit source are simulated using Cornell Multigrid Coupled Tsunami Model (COMCOT; Liu et al. 1998), where the grid size in space is 1 minute and time step is 1 sec. The ocean-land boundary is set to be total reflection and the map boundary radiation. The total run time for each unit source is four hours and the unit tsunamis are recorded by 32 virtual stations with locations corresponding to existing CWB tidal stations [Figure 5]. The arrival times of each unit tsunami are easily picked by the conventional scheme of Short Time Average over Long Time Average (STA/LTA; Allen 1982) in auto-picking of seismic P and S phases.
Finally, we store in database a total of 32×14×10 unit tsunamis as well as 14×10 maps of predicted arrival times for each unit source.
3. Data and Results
3.1 W Phase Inversion
We sorted out earthquakes between Jan. 2000 and July 2009 with moment greater than 1025 dyn-cm and bounded by (10°N, 26°N) and (115°E, 135°E) from the GCMT catalogue (Dziewonski et al., 1981; Ekström et al., 2005). The distribution of earthquakes can be grouped into near-group and far-group according to the epicentral distances relative to central Taiwan [Figure 2]. A visual regional array, including the bulk of current BATS and a few stations from F-NET, Malaysian National Seismic Network, etc., is set up to mimic the distribution of extended BATS [Figure 2]. The LH channel data (1 smaple-per-second) of earthquakes from the array are collected through Web site for source inversion of W phase and the results are compared to GCMT solutions of the same event. Some stations are eliminated with their data continually exhibit low quality (e.g., LYUB). We tested for six scenarios divided into two groups: using vertical component only and using all three ZNE components. In
6
each group, three sets are tried with different level of knowledge on earthquake parameters: (1) using the GCMT centroid parameters (not practical in real case), (2) using the hypocenter parameters (lon., lat., depth, origin time) reported by the PDE (Preliminary Determination of Epicenters) catalogue, and a centroid time, td, determined by grid search; the source half duration, th, is set equal to td, (3) the same as (2) except the centroid location (lon., lat.) determined by a 2-dimensional grid search (depth fixed at PDE’s). We present the results with gCMT location, td location, and (td+xy) location, respectively. The cutting distance – within which data are removed – is determined to be 1.5° by examining results as a function of cutting distance. The inversion is iterated three times with a higher threshold is assigned on each to keep data for inversion. An example of fitting between synthetic and observed waveforms of vertical component for the first shock of the Mw=7.0 Dec. 26, 2006, Pingtung earthquake is shown [Figure 6]. The frequency band used to filter seismic waveforms basically follows Table 1 of Hayes et al. (2009) except that for a few Mw~6.0 earthquakes, the band is fine-tuned to have better results.
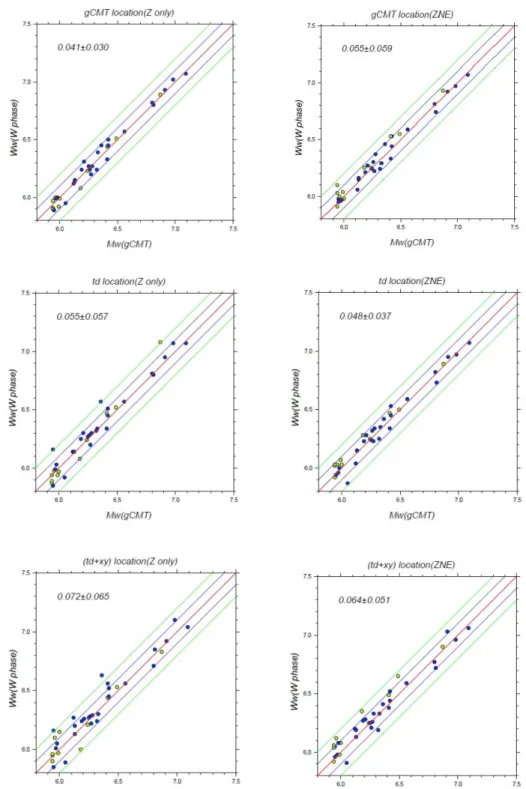
We present the comparisons of Mw (GCMT) and Mw (W phase) for each of six scenarios in Figure 7, with the mean values of absolute magnitude differences and their standard deviation shown. All mean values are less than 0.1 unit, validating the application of W phase inversion by extended BATS’ data to determine source parameters of SCS earthquakes as small as Mw ~ 5.9.
Column-wise, solutions of gCMT location exhibit least mean values of magnitude differences regardless vertical components only (left column) or ZNE three components (right column). However, the GCMT parameters are not available in real time application. Among the remaining four scenarios, the one with least value of magnitude difference is results of td location with three components (right column, middle). This implies that using PDE hypocenter and grid searching for td on ZNE three component data can serve as routine operational procedures for W phase inversion of SCS earthquakes. It is worth noting that solutions of td location tend to be closer in size to those of GCMT than solutions of (td+xy) locations. It is also interesting to note that results of three component data does not necessarily get closer in size to those of GCMT than results of only vertical component (e.g., solutions of gCMT location).
Finally, in all scenarios, solutions of far-group earthquakes tend to be more scatter than those of near-group earthquakes, presumably because most are BATS stations on the island of Taiwan.
7
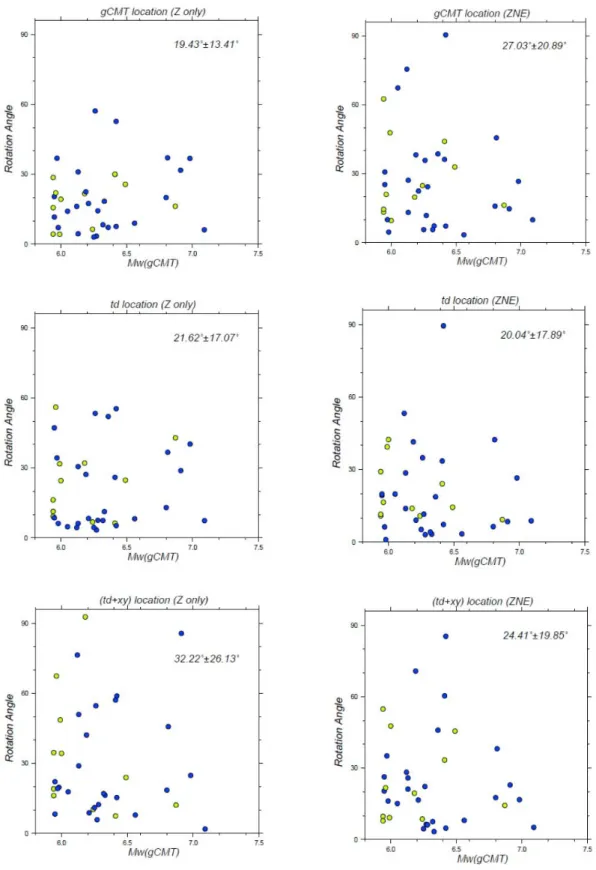
We also present Kagan rotation angle, which is the solid angle to rotate from one double couple to another (Kagan 1991), for results of the six scenarios in the same fashion as magnitude differences plot [Figure 8]. The smaller the rotation angles, the more the double-couple geometries of W inversion resemble those of GCMT solutions. The averages and standard deviations of rotation angles for each scenario are also indicated. They exhibit a pattern similar to previous one that column-wise, the mean rotation angles for solutions of gCMT location are least among other locations, regardless of vertical components only (left column) or of ZNE three components (right column). The similar pattern comes with no surprise because magnitude and source geometry are closely related in the inversion. Again, for real-time application purposes, the optimal option is still the one using PDE hypocenter and grid searching for td.
3.2 Database of Unit Tsunamis
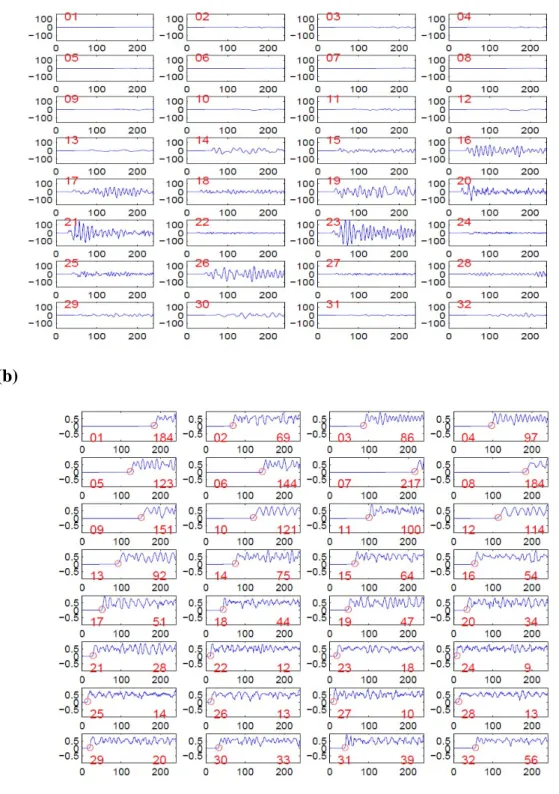
We have done the calculations for all 14×10 unit sources and the resulting tsunami waves on the 32 virtual stations are the corresponding unit tsunamis. The stations are sorted and numbered in a counterclockwise fashion starting from north [Figure 9]. Figure 10(a) shows the unit tsunamis of the 32 virtual stations for the unit source in Figure 4(a). A total of 14×10×32 unit tsunamis are stored in database.
What is also stored in the database is the 14×10 arrival-time maps for the 32 stations of each unit source. The arrival times are determined by applying STA/LTA schemes on the unit tsunamis [Figure 10(b)]. The arrival times thus determined can be shown on the corresponding stations to create an arrival-time map for the unit source. Figure 11 shows examples for four arrival-time maps.
These arrival-time maps are readily available for predicting the arrival times of tsunami waves on various coasts in Taiwan given the epicenter of a tsunamigenic earthquake.
We test with a scenario Mw 9.0 earthquake in the Manila subduction zone to assess the applicability of predicting maximum amplitudes of tsunami waves using unit tsunami method. The vertical seafloor displacements caused by the scenario earthquake are calculated using Okada(1985)’s scheme [Figure 12(a)]. We first follow the conventional approach to simulate the propagation of the displacements, which takes time. Secondly, we derive the weighting factors of each unit source by averaging over the vertical displacements within each unit source [Figure 12(b)]. The tsunami waves are then synthesized by a linear combination of unit tsunamis – pulled from database – with corresponding weighting factors, which
8
can be done instantaneously. Figure 13 shows resulting tsunami waves of the two approaches for comparison. A maximum-amplitude map can also be created showing the magnitudes on the corresponding stations [Figure 14]. By comparing (a) and (b) of Figures 13 and 14, we conclude that the unit tsunami method can produce waveforms and maximum amplitudes similar to those of conventional simulation method, however, only a much less time is needed.
4. conclusions
In this study, we propose to combine W phase inversion and unit tsunami method to build a tsunami warning system in Taiwan for earthquakes in the SCS region.
The W phase inversion allows us to rapidly determine moment tensors of large earthquakes for the calculations of vertical seafloor displacements. The applicability of W phase inversion for SCS earthquakes using BATS stations and its extension has been tested and expect to be improved pending the future construction extended BATS. We have built a database of unit tsunamis for the source region of the Manila subduction zone and the prediction of arrival times is readily available once the epicenter of tsunamigenic earthquake is known. Upon assessment of a Mw9.0 scenario earthquake, the prediction of maximum amplitudes on various coasts in Taiwan using unit tsunami method is comparable with that of conventional simulation, but with a much less time needed.
5. References
Allen, R., 1982. Automatic phase pickers: their present use and future prospects. Bull.
Seismol. Soc. Am. 72(6), 225-242.
Dziewonski, A., M., Chou, T.-A., Woodhouse, J.H., 1981. Determination of earthquake source parameters from waveform data for studies of global and regional seismicity. J. geophys. Res., 86, 2825-2852.
Ekström, G., Dziewonski, A.M., Maternovskaya, N.N., Nettles, M., 2005. Global seismicity of 2003: centroid-moment-tensor solutions for 1087 earthquakes, Phys. Earth planet. Inter., 148(1-2), 327-351. Global CMT catalog; GCMT.
http://www.globalcmt.org.
Hayes, G.P., Rivera, L., Kanamori, H., 2009. Source inversion of the W-phase:
real-time implementation and extension to low magnitudes. Seismological Research Letters, 80(5), 817-822 doi: 10.1785/gssrl.80.5.817
Huang, B.-H., Le, T.S., Liu, C.-C., Toan, D.V., Huang, W.-G., Wu, Y.-M., Chen, Y.-G.,
9
Chang, W.-Y., 2009. Portable broadband seismic network in Vietnam for investigating tectonic deformation, the Earth’s interior, and early-warning systems for earthquakes and tsunamis. J. Asian Earth Sci., 36(1), 110-118.
Kao, H., Jian, P.R., Ma, K.F., Huang, B.S., Liu, C.C., 1998. Moment-tensor inversion for offshore earthquakes east of Taiwan and their implications to regional collision. Geophys. Res. Lett. 25, 3618-3622.
Kanamori, H., Rivera, L., 2008. Source inversion of W phase: speeding up seismic tsunami warning. Geophys. J. Int., 175, 222-238 doi:
10.1111/j.1365-246X.2008.03887.x
Kanamori, H., Rivera, L., 2009. Application of the W phase source inversion method to regional tsunami warning. In press.
Liu, P.L.-F., Woo, S.-B., Cho, Y.-S., 1998. Conputer Programs for Tsunami Propagation and Inundation. Technical Report, Cornell University.
Liu, P.L. –F., Wang, X., Salisbury, A. J., 2009. Tsunami hazard and early warning system in South China Sea, J. Asian Earth Sci., 36(1), 2-12.
Okada, M., 1985. Surface deformation due to shear and tensile faults in a half-space.
Bull. Seismol. Soc. Am. 75(4), 1135-1154.
Soloviev, S. L. and Ch. N. Go, 1974: A catalogue of tsunamis on the western shore of the Pacific Ocean (173-1968). Nauka Publishing House, Moscow, USSR, 310 pp. Can. Transl. Fish. Aquat. Sci. 5077, 1984.
10
Figures
Figure 1: Locations of historical tsunami hazards in Taiwan. Note the most distribute on North and SW Taiwan.
11
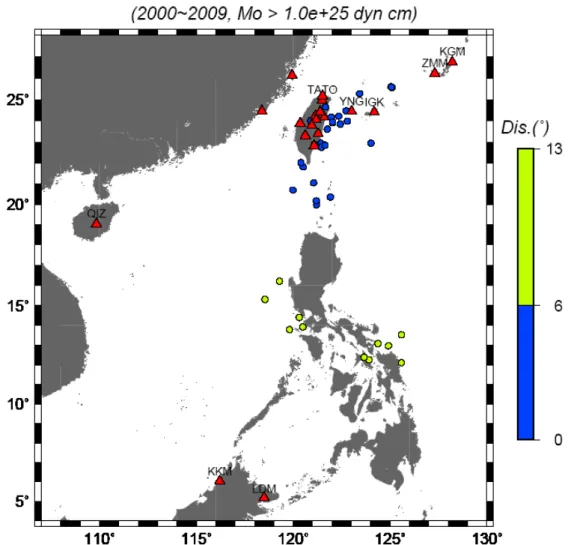
Figure 2: SCS earthquakes (circles) between 2000 and 2009 sorted out for W phase inversion. They are divided into near-group (blue) and far-group (green) according to epicentral distances relative to central Taiwan. Red triangles are stations where data are collected for W phase inversion.
12
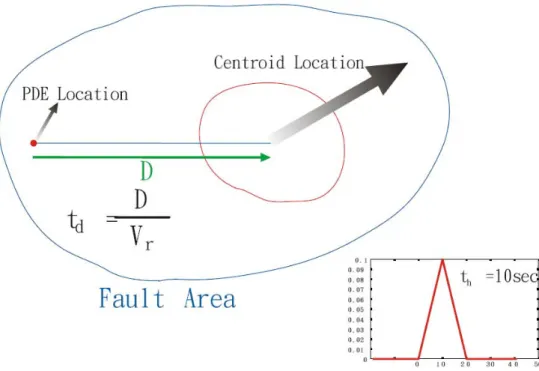
Figure 3: Illustration of the half duration th, and centroid delay td, schematically. The half duration is the half width of the triangular moment rate function, 10 sec in this example. The centroid delay is the temporal position of the centre of the triangle measured from the assumed origin time, which is the distance (D) between the initial rupture (PDE location) and the centroid location divided by the rupture velocity (Vr).
13
(a)
(b)
Figure 4: (a) Division of the source region of the Manila subduction zone into 14 (latitudinal) times 10 (longitudinal) subregions of squares. (b) The initial vertical sea level rise of an unit source.
14
(a) (b)
(c) (d)
Figure 5: Propagation of tsunami waves of an exemplary unit source. The triangles surrounding Taiwan are the existing CWB tidal stations where we set up virtual stations to record the unit tsunamis. (a) Location of the unit source. (b) After 48 min., note that the wave has reached Hualien on coast of eastern Taiwan, but only Kaohsiung on that of western Taiwan due to significantly bathymetric differences. (c) At 2 hours, the tsunami wave along eastern Taiwan has reached the majority of north Taiwan and note that northwest Taiwan coasts have the most warning time. (d) After three hours, almost all Taiwan coasts have been attacked by tsunamis.
15
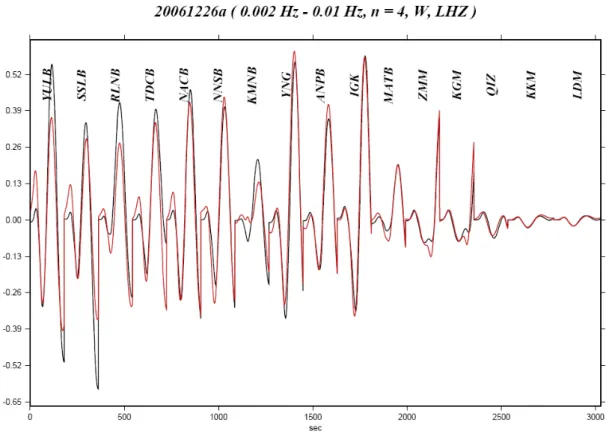
Figure 6: Observed (black) and synthetic (red) W phase for the first shock of the Mw7.0 Dec. 26, 2006, Pingtung earthquake. The W phase time window of each station is trimmed and concatenated for inversion. Labels are names of stations.
16
Figure 7: Comparison of Mw (gCMT) and Mw (W phase) for earthquakes used in this study with blue for near group and green for far group. The left column is results of Z component and the right one ZNE components. Top to bottom represents three sets for different level of knowledge on earthquake parameters (see text). Numbers are mean values for differential Mw and standard deviation. The best result is those of gCMT location and the best implementable result is those of td location using ZNE components (middle right).
17
Figure 8: Rotation angle between source geometries of W phase and gCMT for six scenarios of inversion – blue for near group and green for far group. The relative goodness is similar to that of Figure 7. Again, the best scenario in real time application is td location (ZNE).
18
Figure 9: Locations of 32 CWB tidal stations where we set up virtual stations to record unit tsunamis. We number the stations from north and in a
counterclockwise sense surrounding Taiwan.
19
(a)
(b)
Figure 10: (a) Unit tsunamis of the 32 virtual stations for the unit source in Figure 4.
Red numbers indicate stations following Figure 9. Unit is minute for x-axis and cm for y-axis. (b) Results of STA/LTA scheme applying on the unit tsunamis. Note the sharp arrivals of tsunami waves make their picking confidence. Unit is minute for
20
x-axis and STA/LTA ratio for y-axis. The numbers to the right of each box is the picking arrival-time in minute.
(a) (b)
(C) (d)
Figure 11: The arrival time maps for different unit sources in minutes. (a) For the unit source in Figure 4(a). (b) For the unit source at the upper-right corner of Figure 4(a).
(c) For the unit source at the lower-left corner. (d) For the unit source at the lower-right corner.
21
(a)
(b)
Figure 12: (a) The vertical seafloor displacements of the Mw9.0 scenario earthquake.
(b) The weighting factors of each unit source corresponding to (a), determined by averaging over the displacements within the unit source.
22
(a)
(b)
Figure 13: (a) Tsunami waves on the 32 virtual stations of the Mw 9.0 scenario earthquake using simulation of wave propagations. Red circles mark the position of maximum amplitude. (b) Same results but using unit tsunami method. Note that the majority of stations bear similar waveforms.
23
(a)
(b)
Figure 14: (a) The maximum amplitudes in centimeter at the 32 virtual stations of the tsunami waves triggered by the Mw9.0 scenario earthquake using conventional simulation of tsunami wave propagation. (b) The same results as (a) but using the unit tsunami method. Note that the results are largely comparable between (a) and (b).