國立臺灣大學理學院化學系 博士論文
Department of Chemistry, College of Science
National Taiwan University Doctoral Dissertation
基質輔助雷射脫附游離法的機制及其應用 Mechanism of Matrix-Assisted Laser
Desorption/Ionization (MALDI) and Its Applications
李竹平 Chuping Lee
指導教授:李遠哲 博士 倪其焜 博士 Advisor: Yuan Tseh Lee, Ph.D.
Chi-Kung Ni, Ph.D.
中華民國 107 年 1 月
January 2018
“ ”
( ) (2,4,6-
) (
) 1%
55
(2,5- )
“ ”
(1) (2) (3) HgTe (4) 5- (MSA) (5) 2,5-
(DHBB) (6) (MAI)
( GD1a I-S )
Abstract
Matrix-assisted laser desorption/ionization (MALDI) is one of the important methods in mass analysis for biomolecules. To improve the application of MALDI in
bioanalysis, it is vital to understand the ionization mechanism. Here we study the three topics, which are the mechanism of protonated ion, the mechanism of
metal-related ion separately, and then we compare some softer ionization methods to find out the method soft enough for some fragile molecules in MALDI.
In the first topic of the protonated ion generation mechanism in MALDI, generating the first ions remains the most controversial part of the ionization mechanism. Several mechanisms have been proposed to explain the mechanism of ion generation in MALDI. However, the truthfulness of each mechanism in MALDI are difficult to determine because it is not easy to quantitatively measure the contributions of these mechanisms. The ionization mechanism of UV-MALDI was investigated by
measuring the total cation intensity (not including sodiated and potasiated ions) as a function of analyte concentration (arginine, histidine, and glycine) in matrix of
2,4,6-trihydroxyacetophenone (THAP) using time-of-flight (TOF) mass spectrometer.
The total ion intensity increased up to 55 times near the laser fluence threshold as the arginine concentration increased from 0% to 1%. The increscent were small for the case of histidine, and almost no increase occurred regarding for glycine. The increases became small for all analytes mentioned at high laser fluence. Here, thermal proton transfer model was used to predict the ion intensity as a function of analyte
concentration. The increase of ion intensity can be explained by the thermal proton transfer model in the primary ion generation in MALDI.
In the second topic of the metal-related ion generation mechanism in MALDI, preformed ions are generally accepted as a unspoken mechanism. Three separate
significant contribution in metal ion generation in MALDI. In the first experiment, ion intensities from two different types of samples were measured. Several single crystals were grown from the solution containing 2,5-DHB matrix and salt (LiCl and NaCl).
One group of crystals was washed by deionized water before sending into mass spectrometer. The other group of crystals was used directly. The intensities of metal ion and metal adducts of the matrix ion obtained from unwashed crystals were higher than those from crystals washed with deionized water, indicating that metal ion and metal adducts of the matrix ion mainly generated from the surface, not inside the 2,5-DHB crystal. The contributions of preformed metal ions and metal adducts of the matrix ions inside the matrix crystals were minor.
In the second experiment, mass spectra of MALDI from two groups of samples were measured for comparison. One group of samples was the mixture of dried matrix powder, salt (LiCl and NaCl) and analyte powder. No solvent was used in this sample preparation method. The other group of samples was powder from the crystal of dried droplet, which the solution of droplet contained matrix, salt and analyte. Metal
adducts of the matrix and analyte ion intensities generated from these two samples are similar, indicating that the contribution of the preformed metal adducts of the matrix and analyte ions were insignificant.
In the third experiment, the correlation between the metal-related ion intensity fluctuation and the protonated ion intensity fluctuation was observed, indicating that the generation mechanism of the metal-related ions is similar to that of the protonated ions. The thermally induced proton transfer model effectively describes the generation of the protonated ions; we suggest that metal-related ions are mainly generated from the salt dissolution in the matrix melted by the laser.
In the final topic, MALDI is one of the soft ionization methods in mass analysis for
sulfate and sialic acid during the ionization process. The intensity of intact ion is usually small, and sometime no intact ions are observed at all. In recent years, many studies purposed new matrices to reduce the in-source and post-source decays as well as to increase the sensitivity of intact molecules. These matrices include (1) frozen sample (2) trilayer sample (3) HgTe nanostructures (4) 5-methoxysalicylic acid (MSA) (5) 2,5-dihydroxybenzoic acid butylamine (DHBB) (6) matrix-assisted ionization (MAI). Because different analytes were used in these studies, it is difficult to compare the softness of ionization for these matrices. In this study, we used these matrices and several fragile analytes to investigate softness of these matrices in the ionization process. These analytes include heparin disaccharide I-S, ganglioside GD1a, pullulan and dextran. We proved that frozen sample provide soft ionization and enhanced ion intensity.
Keywords: matrix-assisted laser desorption/ionization (MALDI), ionization mechanism, thermal proton transfer, thermally induced dissolution of salt, thermal model, matrix-assisted ionization (MAI), soft ionization, frozen
……….i
Abstract……….………iii
………..……….vi
………..……….xi
………..………...xviii
1 ………..1
1.1 ………..………..1
1.2 ………2
1.3 ………3
1.4 ………4
1.5 (soft ionization) ……..………9
1.6 ………..………..9
1.7 ………..…………..…..10
2 ………..………..………13
2.1 ………..………..………..………..………..13
2.2 (ion-to-neutral ratio) ………..………..….…14
2.3 (thermal proton transfer model).…………....……..18
2.4 MALDI ? ………..………..….……22
2.5 2,5-DHB ………..………..………..22
2.5.1 ……….………..…………..25
2.5.2 ……….………..……….……26
2.5.3 ………27
2.5 2,5-DHB ………..…………..………..27
2.6 ………..………..………..………..………..29
2.7 ………..………..………..…………...…..……...29
3 …………..………..………..…………...…..…….32
3.1 (time-of-flight, TOF) ……….…..………...…….……32
3.1.1 …………..………..……….…………..…..32
3.1.2 …………..………..………..…………...………...…34
3.2 (modified cross beam) …………...…..………34
3.2.1 …………..………..…..………..…34
3.3 (linear ion trap, LIT) …………..………..………36
3.3.1 …………..………..………..…….….36
3.3.2 …………..………..………..…………...…..….…….37
3.4 …………..………..………..…………...…..……...38
4 - ……….……..39
4.1 ………..………..………..………..………..39
4.2 ……….….……41
4.3 ……….….42
4.4 ………..42
4.5 ………..……42
4.5.1 (total ion intensity ratio, γ) …………..………...…42
4.5.2 (thermal proton transfer model) ……..…………...40
4.5.3 (γ) …………..………..…...….48
4.6 ……….…….…52
4.7 ……….…….…52
5 (MALDI) - …….…….….54
5.1 ……….….54
5.2 ………..54
5.3.1 (single crystal) ……….……..…...55
5.3.2 ……….…...56
5.4 ………..57
5.5 ………..57
5.5.1 - (washed and unwashed crystal) ….…..57
5.5.2 - (dried-droplet powder, DDP) (dried powder mixture, DPM) ……….59
5.5.3 ………65
5.5.4 (thermally induced dissolution of salt) …………...…...68
5.6 ………..70
5.7 ………..70
6 ………..………..……72
6.1 ………..………72
6.1.1 MAI ………..………...…75
6.1.2 ………..……….………...…..77
6.2 ………..………78
6.3 ………..………78
6.4 ………..………79
6.4.1 …..………..………..….….79
6.4.2 MALDI MAI ………..…………79
6.4.3 …..………..…..………….….80
6.5 …..………..……….….80
6.5.1 ………..……….….80
6.5.2 MAI ………..……….….86
6.6 …..………..……….….…88
7 (soft ionization) ……….91
7.1 ………..91
7.1.1 (ganglioside) ……….…...94
7.1.2 (heparin) ……….…….…...96
7.1.3 ……….……..….98
7.2 ………..98
7.3 ………..99
7.3.1 (frozen) ……..………...99
7.3.2 MALDI ………..100
7.3.3 (ionic liquid) MALDI …..………...……...100
7.3.4 (trilayer) ……….…...101
7.3.5 (surface-assisted laser desorption/ionization, SALDI) ………..…..………..…..………..…..…………...101
7.3.6 (electrospray ionization, ESI) …..….………..102
7.6.7 (matrix-assisted ionization, MAI) …...102
7.3.8 (solvent-assisted ionization, SAI) ….…….102
7.4 ……….…….……..103
7.4.1 ……….……...………….……...…103
7.4.2 MALDI ……….………….……….…...103
7.4.3 ESI MAI ……….…..104
7.5 ……….……….……..104
7.5 (ganglioside) ……….….………104
7.5.1.1 (GD1a) ………..……….….………..….…104
7.5.1.2 (asialo GM1, GM1, GD1a, GT1b GQ1b) …..………110
7.5.2 (heparin I-S)...……….…….……….113
7.6 ………121 7.7 ……….……….……..122 8 ……….……….………..…..124
1-1 (a) (b)
2,5-dihydroxybenzoic acid (2,5-DHB) (c) α-cyano-4-hydroxycinnamic acid (CHCA) (d) 2′,4′,6′-trihydroxyacetophenone (THAP) ……….……….……….………3
1-2 (preformed ions model) ……….……….……….6
1-3 (thermal model) MALDI
……….………….…….….….………….……...7 1-4 (energy pooling model) ……….…….…. ….….…..………...8 1-5 (energy pooling model) ……….……….……….……….……8 2-1 2,5-DHB (ion-to-neutral ratio)
(bradykinin) (tryptophan, Try) (glycine, Gly) o 2,5-DHB
1/10000(96.7J/m2) ¡ 2,5-DHB
1/1000(116J/m2) r 2,5-DHB 1/1000(96.7J/m2)
2,5-DHB 1/50 (
) ……….……….……….……….……….……….……….……….……….……..17 2-2 (Boltzmann energy distribution)
(ion-to-neutral ratio) ……….……….……….………18 2-3 2,5-DHB (a) (b)Gibbs free energy ...……….……….……….20 2-4 CHCA, FA, SA 2,5-DHB
(ion-to-neutral ratio) ( ) ( ) ……….……….…….……...22 2-5 (a)THAP(b)2,5-DHB ……….……...….…….………24
2-6 (a) (b)
CHCA SA 2,5-DHB ...25
2-7 (a)DHB UV (b) DHB
DHB ([DHB+H]+) ……….……….……….……….……..……28
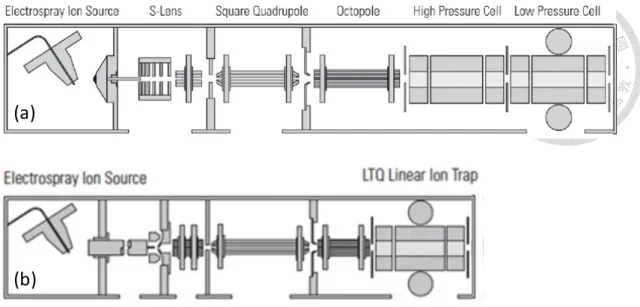
3-1 .……..… …………..………33
3-2 .… .……..……….……..………..……33
3-3 .………….……..…….……..…….……..……35 3-4 .……..……….……..…….……..…………..……36 3-5 .……..….……..…….……..…….………...……37 3-6 (a) LTQ velos (b) LTQ XL (Thermo Fisher) ………....……38
4-1 THAP (a) 1% Arg +
THAP (b) 1% His + THAP (c) 1% Gly + THAP ………..……….…..…..41
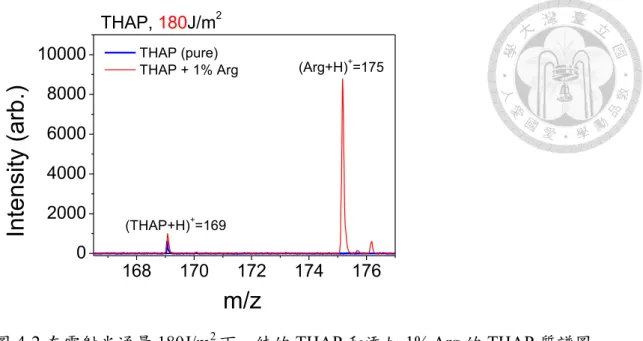
4-2 180J/m2 THAP 1%Arg THAP …43
4-3 (Arg, His Gly) THAP
(1~10 ) (a) 160 J/m2 (b) 280 J/m2
(11~20 ) (c) 160 J/m2 (d) 280 J/m2 ……..44
4-4 160J/m2 (1~10 )
THAP (a) Arg, (b) His (c) Gly
……….……….……….……….……….……….……….……….………45 5-1 (Prespotted Anchor Chip PAC 96 HCCA, Bruker Daltonik)(a) (b) ……….……….………....55
5-2 (a) (b) ...56
5-3 (a)(c) (a) 5% LiCl 2,5-DHB
(c) 5% NaCl 2,5-DHB (b) LiCl
2,5-DHB (d) NaCl DHB
……….……….………..……….……….……....59 5-4 (a)(b) ([Li]+=7, [THAP+Li]+=175, [2THAP+Li]+=343)
(c)(d) ([Na]+=23, [THAP+Na]+=191) (a)(c)
2 2
(dried powder mixture, DPM) THAP 1%LiCl NaCl
(dried-droplet powder, DDP)
THAP NaCl DPM w/o NaCl ……….…………..….60 5-5 1%NaCl THAP
……….……….……….……….…….….………….…...…….……….61
5-6 1%LiCl 0.5%
2,5-DHB (a) 2,5-DHB (b) (c)
1%LiCl 0.5% 2,5-DHB ……….……...62
5-7 (a) 1%NaCl 0.5%
2,5-DHB (c) 1%NaCl 0.05%
pullulan(6kDa) 2,5-DHB pullulan(6kDa) …….………..64 5-8 1%LiCl 0.5% 2,5-DHB (a) 1~20
(b)
1%NaCl 0.5% 2,5-DHB (c) 21~40
(d) …...…65
5-9 ….……….……….……….……….……..…….…………66
5-10 2,5-DHB (a)
(b) ( 10~15% )
1%NaCl+2,5-DHB (c)
(d) ( 10~15% )
…...…….…………..67 5-11 (thermally induced dissolution of salt) …….…..……….69 6-1 (a) (laserspray ionization inlet, LSII)
inlet, SAII)(b) (laserspray ionization vacuum, LSIV)
(matrix-assisted ionization vacuum, MAIV) …74
6-2 MAI …….……….……75
6-3 60 3NBN 3NBN (a)60
(b)100 (c)130
……….….…76 6-4
(a)MAI (b)LSI ……….….………...…77 6-5 Nd:YAG (Continuum Minilite, 266 nm)
(MALDI-TOF, autoflex III, Bruker Daltonik) ……….………..79 6-6 (bovine insulin) (amino acid sequence) chain A chain B
G F (-NH2) N A (-CO2) .…..….…..80 6-7 (a)200 J/m2, (b)250 J/m2, (c)290 J/m2, (d)355 J/m2, (e)550 J/m2 3NBN (bovine insulin) .…...81
6-8 (200 J/m2, 250 J/m2, 290 J/m2, 355 J/m2, 550 J/m2)
3NBN insulin insulin 6+, 5+, 4+, 3+, 2+, 1+ ([insulin + 6H]6+ =955, [insulin + 5H]5+ =1147, [insulin + 4H]4+ =1433, [insulin + 3H]3+ =1911, [insulin + 2H]2+ =2867, [insulin + H]+
=5734) ……….………...82
6-9 3NBN 3NBN insulin
3NBN 3NBN 3NBN 3NBN
(dimer) insulin ………….………….….……84
6-10 insulin insulin
5+ 4+ 3+
=1911, [insulin + 2H]2+ =2867, [insulin + H]+ =5734) 3NBN 2,5-DHB CHCA 2,5-DHAP 2-NPG (a) (3NBN: 170 J/m2, 25DHB: 170 J/m2, CHCA: 80 J/m2, 25DHAP: 155 J/m2, 2NPG: 80 J/m2) (b)
(3NBN: 340 J/m2, 25DHB: 350 J/m2, CHCA:
155 J/m2, 25DHAP: 300 J/m2, 2NPG: 155 J/m2) ……….………..86
6-11 insulin
3NBN 2,5-DHB CHCA 2,5-DHAP 2-NPG
……….……….……….87 6-12
insulin 3NBN 2,5-DHB
2,5-DHAP 2-NPG
……….………….88 7-1 (a) (b) (thin layer), (c)
(dried-droplet) (d) (trilayer) ……….……….……….……….……….…….92 7-2 GD1a 2,5-DHB MSA ……….……….……….……..….…………93
7-3 (a) (sphingolipid) (sphingosine) (fatty acid) (ceramide) (sphingomyelin) (glycosphingolipid) (b) (ganglioside) GM1, GD1a, GD1b, GT1b
GQ1b ……….……….……….95 7-4 (a) (proteoglycan) (glycosaminoglycan,
GAGs) (b) (core structure)
(c) (heparan sulfate, HS) chondroitin sulfate, CS) (dermantan sulfate, DS) (keratan sulfate, KS) (hyaluronic acid, HA) …. ……….………….97
(d) ……. ………….………….……….100
7-6 (a) (b) ………....……..…....103
7-7 GD1a (a) 2,5-DHB 37.5%
(b) DHBB (c) 2,5-DHB
(d) 2,5-DHB (e)MSA (f)HgTe GD1a 5 pmol/µL ……105
7-8 GD1a (a) 2,5-DHB 37.5%
(b) DHBB (c) 2,5-DHB
(d) 2,5-DHB (e)MSA (f)HgTe GD1a 5 pmol/µL ...107
7-9 (a) GD1a (1:1)
60°C (b) GD1a
3-NBN 60°C (c) 1,2-DCB 450°C
(d) GD1a 50% 1%
250°C (e) GD1a 50% 0.1%
250°C ……….……….…….…….109
7-10 GD1a
……….…110 7-11 (a)GT1b (a)GQ1b 2,5-DHB
37.5% GT1b GQ1b 1 pmol/µL ……….……….110 7-12 (asialo GM1,GM1, GD1a, GT1b GQ1b) (a) (b)
2,5-DHB ( 37.5% )
(c) (d) 2,5-DHB ( 37.5%
) 1 pmol/µL …….…….………….…….…111
7-13 GM1 GD1a, GT1b GQ1b
(GM1, GD1a, GT1b GQ1b) GM1, GD1a GT1b 1 pmol/µL GQ1b 0.5( ), 1( ), 5( ) 10 ( )
7-14 GQ1b (calibration curve) …….………..…113
7-15 heparin I-S 2,5-DHB (a)50%
1% (b)75% (c) DHBB (d) 2,5-DHB (e) 2,5-DHB (f)MSA (g)HgTe heparin I-S 5 pmol/µL ……….………..115 7-16 heparin I-S 2,5-DHB (a)37.5%
(b)75% (c) DHBB (d) 2,5-DHB
(e) 2,5-DHB (f)MSA (g)HgTe heparin I-S 5 pmol/µL ……….……….………..116
7-17 heparin I-S (1:1)
60°C (b) GD1a
3-NBN 60°C (c) 1,2-DCB 450°C
(d) GD1a 50% 1%
250°C ……….….……….….….118
7-18 heparin I-S
. ……….……….…….119
7-19 pullulan(9.6kDa) (a) MSA
(b) 2,5-DHB (c) 2,5-DHB (d)DHBB pullulan 5 pmol/µL ………..……….120
7-20 dextran(12kDa) (a) MSA
(b) 2,5-DHB (c) 2,5-DHB (d)DHBB dextran 5 pmol/µL ……….…121
1-1 ……….….…….….……....4
1-2 MALDI ……….………5
2-1 (ion-to-neutral ratio) . ……….…………..15
2-2 (ion-to-neutral ratio).. ……….…….…16
2-3 DHB . ………..……..28
4-1 THAP, Arg, His Gly ...50
4-2 Arg, His Gly ΔG3 ΔG6 . ………..….51
6-1 MAI LSI . ……….…..73
6-2 ΔG3NBN ………...83
6-3 insulin ΔGins ……….…...83
6-4 ( 5-5 5-6) ( 6-7) ………..85
第1章 序論 1.1 前言
質譜儀(mass spectrometry)是廣泛使用的微量分析儀器,可應用於環境分析,食 品安全,生化分子和高分子的分析。結構上主要分為五個部分:樣品導入系統 (inlet system)、離子源(ion source)、質量分析器(mass analyzer)、偵測器(detector) 和訊號處理系統(data analysis)。
對於生化分子的質譜分析,主要使用的離子化方法為基質輔助雷射脫附游離法 (matrix-assisted laser desorption/ionization, MALDI)和電噴灑法(electrospray ionization, ESI) [1],由於這兩種游離化方法的發明,Koichi Tanaka 和 John B. Fenn 在 2002 年得到諾貝爾化學獎。
1987 年 Koichi Tanaka 發表了混合鈷(cobalt, Co)奈米粒子、甘油和蛋白質製備樣 品,測到羧基肽酶 A (carboxypeptidase A, 34472 Da),是第一個在質譜看到大分 子蛋白質訊號的人,此方法稱為軟雷射游離法(soft laser ionization, SLI) [2]。1985 年 Franz Hillenkamp 和 Michael Karas 使用 266nm 的雷射,將吸收光的色氨酸 (tryptophan,Trp, 204Da)和不吸收光的丙胺酸(alanine, Ala, 89Da)以 1:1 混合製備成 樣品,能提升 Ala 的訊號[3, 4]。而後他們在 1988 年用菸鹼酸(nicotinic acid)作為 基質製備成樣品,看到更大的蛋白質訊號,測到牛血清蛋白(bovine serum albumin, BSA, 66kDa)[5],此方法為現在常用的基質輔助雷射脫附游離法(matrix-assisted laser desorption/ionization, MALDI)。雖然 MALDI 是現今常用的方法,但 Koichi Tanaka 是第一個用質譜看到大分子訊號的人,因此他拿到了諾貝爾獎。
在基質輔助雷射脫附游離法(MALDI)發展二十五年後,2010 年 Sarah Trimpin 發 現了 3-硝基苯腈(3-nitrobenzonitrile, 3-NBN)作為基質時,樣品不需要使用雷射,
也不需要施加電壓,就可以輔助蛋白質游離,而且產生的訊號是和 ESI 相似的多 電荷離子(multiply charged ion),像是牛血清蛋白(bovine serum albumin, BSA, 66kDa)[6],其訊號最多帶有 67 價電荷,此方法稱之為基質輔助游離法
因為質譜分析技術的進步,提供精確和靈敏的技術平台,加速了蛋白質體學 (proteomics)、醣質體學(glycomics)、代謝質體學(metabolomics)和基因質體學 (genomics)的發展。其中醣質體學(glycomics)主要分析複合醣類(glycoconjugate),
像是醣蛋白(glycoprotein)、醣脂(glycolipid)和蛋白聚醣(proteoglycan),研究生物 體內醣基的結構及其功能,醣類具有各種的功能,例如細胞間相互作用(cell-cell interaction),自身和非自身識別(self / non-self recognition)和細胞的訊號傳遞(cell signals)等[7]。醣蛋白是蛋白質經由醣化(glycosylation)而成,是最常見的轉譯後 修飾(post-translational modification, PTM),在哺乳類中,大多數蛋白質皆經由轉 譯後修飾,因此醣類結構的分析是很重要的[8]。在生物體中,基因轉錄
(transcription)或蛋白質轉譯(translation)是可被預測其合成的序列(sequence),然而 醣類的是無法被預測的,而且其結構比去氧核醣核酸(DNA)和蛋白質一級結構更 複雜,使醣類結構的分析更為困難,其結構的複雜性包含:單醣組成
(monosaccharide composition)、序列(sequence)、鍵結(linkage)、分支(branch)和旋 變異構(anomeric configuration) [9]。
1.2 基質輔助雷射脫附游離法的樣品製備
基質輔助雷射脫附游離法是以小分子有機酸作為基質,將蛋白質等生化分子加入 其中,製備成待測物,再用紫外光脈衝雷射(UV pulsed laser)照射,常用的雷射為 氮氣雷射(nitrogen laser)和三倍頻釹:釔鋁石榴石雷射(neodymium-doped yttrium aluminium garnet laser, Nd:YAG laser),其波長分別為 337 nm 和 355 nm[1],基質 對雷射光會有很強的吸收係數,大部份的光能轉換成熱能,使分子汽化並脫附,
脫附的氣體中包含正離子、負離子、電子和電中性分子(neutral) (如圖 1-1a)。脫 附的氣體中主要是電中性分子,只有少部份被離子化,離子可被質譜儀偵測。常 用於紫外光基質輔助雷射脫附游離法(UV-MALDI)的基質有 2,5-dihydroxybenzoic acid (2,5-DHB) (如圖 1-1b),α-cyano-4-hydroxycinnamic acid (CHCA) (如圖 1-1c)
圖 1-1 (a) 基質輔助雷射脫附游離法示意圖以及常用的基質(b)
2,5-dihydroxybenzoic acid (2,5-DHB) (c) α-cyano-4-hydroxycinnamic acid (CHCA) (d) 2′,4′,6′-trihydroxyacetophenone (THAP)。
1.3 基質輔助雷射脫附游離法的特性
MALDI 能得到非揮發性(non-violet)分析物的質譜,其訊號大部分爲帶單電荷的 分子離子,且游離時碎片離子少,這種碎片少的游離法稱為軟游離(soft ionization)。
其他的優點包括,對於混合物的分析,不需要預分離(pre-separation),樣品的需 求量小,偵測快速和方便。由於上述的特性,MALDI 非常適用於生物大分子的 質譜分析,另外 MALDI 的樣品不需要經繁複的前處理即可進行質譜分析,因此 能 夠 直 接 偵 測 組 織 切 片 , 得 到 基 質 輔 助 雷 射 脫 附 游 離 影 像 質 譜 (MALDI imaging)。
雖然 MALDI 在蛋白質體學上的應用已經相當廣泛,但有三個非常需要解決的問 題:
1. 對於醣類靈敏度(sensitivity)低,MALDI 用於蛋白質偵測的靈敏度最好可到
10-15莫耳(femtomole) [10],而醣類偵測的靈敏度比蛋白質低約 1000 倍。
2. 對基質的選擇只能用嘗試錯誤法(trial and error),許多分析物找不到適合的 基質,而好的基質對分析物是很重要的,表 1-1 整理了常用基質及適用的分 析物。
3. 訊號的再現性(reproducibility)差,每一發雷射得到的訊號,以及不同位置得 到的訊號,差異性很大,這種現象稱為甜蜜效應(sweet spot),因此不適合用 於定量分析。
基質 結構 波長 應用的分析
物 菸鹼酸(nicotinic acisd) 紫外光(UV)
266nm
蛋白質和胜 肽
2,5-dihydroxybenzoic acid (2,5-DHB)
紫外光(UV) 337, 355nm
蛋白質,胜 肽,醣類和 合成高分子 Sinapinic acid (SA) 紫外光(UV)
337, 355nm
蛋白質和胜 肽
α-cyano-4-hydroxycinnamic acid (CHCA)
紫外光(UV) 337, 355nm
蛋白質和胜 肽
3-hydroxypicolinic acid (3-HPA)
紫外光(UV) 337, 355nm
核酸(nucleic acid)
甘油(glycerol) (液態基質)
紅外光(IR) 2.94, 2.79μm
蛋白質和胜 肽
表 1-1 常用的基質[1]。
1.4 基質輔助雷射脫附游離法的機制
要是能瞭解 MALDI 的機制,對於解決以上的幾個問題將能有所幫助。MALDI
的機制主要牽涉到兩個部分:
1. 分子的脫附(desorption):目前大部分的科學家認為雷射照射到樣品時,基質 會吸收光子產生瞬間高溫,導致基質汽化(evaporation)和噴發(explosion),此 時一併將分析物帶到氣態。
2. 電中性分子的離子化(ionization):當樣品被雷射照到後,經過最初的反應 (primary reaction)後,產生一次離子(primary ion),而此離子會和旁邊的分子 產生分子和離子反應(ion-molecule reaction),產生最後被偵測的離子。要是 能預測最初的反應,知道反應中起始的離子是什麼,就能設法增加離子的量,
進而提升訊號。在過去二十年來,對於 MALDI 的機制,很多科學家也相繼 提出了很多看法(如表 1-2)。
參考文獻 提出者 模型
[11] Hillenkamp F 直接多光子游離(direct multiphoton ionization) [12-14] Karas M 預形成離子模型(preformed ions model)
[15, 16] Allwood DA, Dyer PE, Dreyfus RW
光激發基質熱游離(thermal ionization of photoexcited matrices)
[17, 18] Knochenmuss R 能量集結模型(energy pooling model)
[19] Redmond RW 激發態質子轉移(excited state proton transfer) [20, 21] Chait BT 極性流體模型(polar fluid model)
[22] Lai YH, Lin SH, Wang YS
固態熱力學模型(solid-phase thermodynamic model)
[23-25] Lee YT, Ni CK 熱致游離/熱致質子轉移模型(thermal model /thermal proton transfer model)
表 1-2 各種 MALDI 的機制。
以下為現今最常被討論的三種離子形成機制:
1. 預形成離子模型(preformed ions model) [12, 14]:又叫做倖存離子模型(lucky
survivors model),或是稱為團簇模型(cluster ionization model),是由 Michael Karas 所提出。一般製備 MALDI 樣品時,會先把樣品配成溶液,將溶液滴 在樣品板上,待溶劑揮發後形成固態再進行測量。配成溶液時離子存在溶液 中,變成固體後因為正、負離子結合,離子數目會減少,但還是會有部份離 子存在固體中(如圖 1-2),當雷射照射後產生汽化,同時離子也會跑出來。
他們用酸鹼指示劑去實驗偵測固體中離子的存在[13],一般有機酸基質通是 酸性,在溶液中可以看到指示劑呈現不同顏色,就表示有機酸有解離,而變 成固體後指示劑依然呈現顏色變化,因此他們認為固體中還是有離子存在。
圖 1-2 預形成離子模型(preformed ions model)取自[18]。
2. 熱致游離模型(thermal model) [23, 24]:是由 Yuan Tseh Lee 和 Chi-Kung Ni 改進極性流體模型(polar fluid model)而提出。當分析物為蛋白質類時,熱致 游離模型(thermal model)提出固態樣品經雷射照射後,會變成像液體一樣的 熔融狀態,而後熔融狀態的樣品會產生(如圖 1-3)質子轉移(proton transfer),
熱致質子轉移的公式如式 1-1 到 1-3,M 為基質,A 為分析物。比較預形成 離子模型和熱致游離模型,其差別是離子的形成是在雷射照射前或是照射後。
預形成離子模型指出固體樣品中本來就有離子存在,只是後來被雷射脫附出 來。但熱致游離模型認為固體中本來的離子量非常少,離子的產生主要是來 自於高溫產生的質子轉移。因為質子轉移反應大部分是吸熱反應(式 1-1 到
1-3,反應向右),雷射照射產生很高的溫度,有利於質子轉移反應的發生,
並產生大量離子,這些離子量會多於原來在固體中的離子,又稱為熱致質子 轉移模型。若分析物為帶金屬離子時(如醣類),雷射照射後固態樣品後,基 質融化成像液體,分析物溶解在類似液態的基質中,此時鹽解離成離子,金 屬離子附著分析物上形成離子。塩是來自樣品中的雜質,大部分是鈉塩或是 鉀塩,大部分形成的是[M+Na]+,有時會出現少部分[M+K]+。
圖 1-3 熱致游離模型(thermal model)示意圖,雷射照射後固態 MALDI 樣品,因為 熱而變成像液體一樣的熔融狀態。
M + M ⇆ (𝑀 − 𝐻)−+ (𝑀 + 𝐻)+ (式 1-1) M + A ⇆ (𝑀 − 𝐻)−+ (𝐴 + 𝐻)+ (式 1-2) (𝑀 + 𝐻)++ A ⇆ M + (𝐴 + 𝐻)+ (式 1-3)
3. 能量集結模型(energy pooling model) [18]:有些科學家認為分析物離子的產 生需要兩個步驟(two step model),第一步是基質離子產生,第二步是基質離 子和分析物分子發生質子轉移,使分析物帶電。他們主要針對第一個步驟,
基質離子的產生提出離子化機制。早先提出的直接多光子游離模型(direct multi-photon ionization)被認為不太可能發生,原因是常用的 355nm
UV-MALDI 的光子能量為 3.5eV,2,5-DHB 的游離能(ionization potential)l 為 8.054eV[26],至少要 3 個光子才能游離,過程中游離截面積(ionization cross section)太低。因此 Richard Knochenmuss 提出能量傳遞模型(如圖 1-4),當分 子照光後,把分子從基態(S0) 激發到電子激發態(S1)。在 S1的電子可以做激
M
+M
-A
+A
-M
A
M M M
-A A
+M A
M M
M M A
M A
M M M
+LASER
子躍遷(exciton hoping),就是激發態可以由一個分子跳到另一個分子。如果 有兩個 S1分子位置剛好非常接近,可以進行光化學中稱為 S1- S1湮滅 (singlet-singlet annihilation),一個分子回到 S0,另一個分子得到能量被激發 到 Sn ,Sn和 S1再作一次能量傳遞而被游離。雖然能量傳被提出,但 Sn的 生命期(lifetime)太短,至今還無實驗證實 Sn和 S1能量傳遞的發生。而且此 機制只說明如何產生帶質子的離子[M+H]+,並無法說明帶金屬離子的現象,
像是[M+Na]+或是 [M+K]+。
圖 1-4 能量傳遞模型(energy Pooling Model) 取自[18]。
1.5 軟游離法(Soft ionization)應用於醣類分析
基質輔助雷射脫附游離法(MALDI)比起傳統的游離化方法,像是電子撞擊游離法 (electron impact ionization, EI),更不容易在離子化的過程中產生碎片,更能看到 完整分子的訊號,這種方法稱為軟游離。雖然如此,對於一些脆弱的生化分子 (fragile biomolecule),在 MALDI 中仍然看不到完整的分子訊號,例如含有唾液 酸(sialic acid),磺酸根(sulfate group),磷酸根(phosphate group)的生化分子。唾液 酸常見於醣苷(glycan)的尾端,醣蛋白(glycoprotein)和醣脂(glycolipid)都是一種醣 苷,磺酸根和磷酸根常見於修飾在醣類,磷酸根也常見於修飾在蛋白質上。在 MALDI 質譜分析中,含有磺酸根和唾液酸的醣類,會在脫附和游離的過程中,
失去磺酸根和唾液酸,因此容易看到的訊號是失去磺酸根和唾液酸的碎片,而不 是完整醣類的訊號。
一般 UV-MALDI 常用的基質中,CHCA 被認為是比較”熱(hot)”的基質,2,5-DHB 被認為是比較”冷(cold)”的基質[27],當實驗需要使用軟游離通常是用 2,5-DHB 作為基質,但在偵測脆弱的分子時,仍然會容易產生碎片,不易看到完整的分子 訊號,因此有很多軟游離相關的研究,預期能看到待測物完整的資訊。
1.6 研究目的
在 MALDI 的實驗中,可以改變的實驗條件很多,像是雷射的能量,基質的選擇,
樣品製備的方式等,所以 MALDI 是一個複雜的過程。無法用單一的實驗證明其 確切的游離機制,MALDI 產生離子也可能不只有一個路徑,儘管如此,我們持 續努力找出主要發生的機制。第二章將先進行文獻回顧,探討各種機制的可能性,
其中熱致游離模型被認為發生的可能性最大,因此詳細說明此模型及其證據。
第三章和第四章的實驗為研究 MALDI 的機制,更進一步探討熱致游離模型的可 能性,第三章是研究蛋白質類的分析物游離機制,藉由質子轉移和離子強度的關 係去證明熱致質子轉移模型的重要性。在 MALDI 的正離子質譜中,蛋白質類的
號 [M+Na]+,而醣類通常是看到帶一個鈉離子的離子訊號 [M+Na]+,鈉存在於 生活環境中,藥品的不純物和樣品盤各處都有。第四章是研究分析物形成帶金屬 離子的游離機制,藉由三個實驗去證明,可能形成帶金屬離子的原因。
第五章的實驗為研究 MAI 的機制,以及說明多電荷離子產生的原因。以蛋白質 和胜肽為分析物,研究一系列 MALDI 和 MAI 常有用的基質,探討基質的質子 親力,影響蛋白質離子帶有的電荷數。並改變雷射能量,藉由離子量隨著雷射能 量增加的多寡,推測 MAI 的基質產生離子的主要機制,不同於 MALDI 的基質。
在質譜分析中,MALDI 被認為是軟游離法,但用於一些很脆弱的生化分子上,
還是不足以能看到完整的分子訊號,或是訊號很小。例如合成好的分子,不論是 高分子還是醣類等,欲使用質譜鑑定時,如果游離化的方法不夠軟性,將容易產 生碎片,不易看到完整分子,提升鑑定合成分子否為預期的產物的難度,因此軟 游離法在應用上是很重要的。第六章比較了各種游離方法和製備樣品方法,並找 出最軟性的游離方法,可應用於脆弱分子的偵測,更能確認待測物,增加質譜分 析可信度。
1.7 參考文獻
1. Hillenkamp, F. and M. Karas, The MALDI Process and Method, in MALDI MS.
2007, Wiley-VCH Verlag GmbH & Co. KGaA. p. 1-28.
2. Tanaka, K., et al., Protein and polymer analyses up to m/z 100 000 by laser ionization time‐of‐flight mass spectrometry. Rapid Communications in Mass Spectrometry, 1988. 2(8): p. 151-153.
3. Karas, M., D. Bachmann, and F. Hillenkamp, Influence of the Wavelength in High-Irradiance Ultraviolet Laser Desorption Mass Spectrometry of Organic Molecules. Analytical Chemistry, 1985. 57(14): p. 2935-2939.
4. Karas, M., et al., Matrix-assisted ultraviolet laser desorption of non-volatile compounds. International journal of mass spectrometry and ion processes, 1987. 78: p. 53-68.
5. Karas, M. and F. Hillenkamp, Laser desorption ionization of proteins with molecular masses exceeding 10,000 daltons. Analytical Chemistry, 1988.
60(20): p. 2299-2301.
6. Lietz, C.B., et al., Inlet ionization: protein analyses from the solid state without the use of a voltage or a laser producing up to 67 charges on the 66 kDa BSA protein. Rapid Communications in Mass Spectrometry, 2011.
25(22): p. 3453-3456.
7. Taylor, M.E. and K. Drickamer, Introduction to glycobiology. 2011: Oxford university press.
8. Varki, A., Biological roles of oligosaccharides: all of the theories are correct.
Glycobiology, 1993. 3(2): p. 97-130.
9. Obena, R.P., et al., UV-activated multilayer nanomatrix provides one-step tunable carbohydrate structural characterization in MALDI-MS. Chemical Science, 2015. 6(8): p. 4790-4800.
10. Tzeng, Y.-K., et al., Facile MALDI-MS analysis of neutral glycans in
NaOH-doped matrixes: microwave-assisted deglycosylation and one-step purification with diamond nanoparticles. Analytical chemistry, 2008.
80(17): p. 6809-6814.
11. Ehring, H., M. Karas, and F. Hillenkamp, Role of photoionization and photochemistry in ionization processes of organic molecules and relevance for matrix‐assisted laser desorption lonization mass spectrometry. Organic mass spectrometry, 1992. 27(4): p. 472-480.
12. Karas, M., M. Glückmann, and J. Schäfer, Ionization in matrix‐assisted laser desorption/ionization: singly charged molecular ions are the lucky survivors.
Journal of Mass Spectrometry, 2000. 35(1): p. 1-12.
13. Krüger, R., et al., Analyte incorporation and ionization in matrix-assisted laser desorption/ionization visualized by pH indicator molecular probes.
Analytical chemistry, 2001. 73(24): p. 5812-5821.
14. Karas, M. and R. Krüger, Ion formation in MALDI: the cluster ionization mechanism. Chemical reviews, 2003. 103(2): p. 427-440.
15. Allwood, D., P. Dyer, and R. Dreyfus, Ionization Modelling of Matrix
Molecules in Ultraviolet Matrix‐assisted Laser Desorption/Ionization. Rapid communications in mass spectrometry, 1997. 11(5): p. 499-503.
16. Allwood, D.A., et al., Plasma modelling of matrix assisted UV laser
desorption ionisation (MALDI). Applied Surface Science, 1997. 109–110: p.
616-620.
17. Knochenmuss, R., A quantitative model of ultraviolet matrix‐assisted laser desorption/ionization. Journal of mass spectrometry, 2002. 37(8): p.
867-877.
18. Knochenmuss, R., Ion formation mechanisms in UV-MALDI. Analyst, 2006.
131(9): p. 966-986.
19. Lüdemann, H.-C., F. Hillenkamp, and R.W. Redmond, Photoinduced
hydrogen atom transfer in salicylic acid derivatives used as matrix-assisted laser desorption/ionization (MALDI) matrices. The Journal of Physical Chemistry A, 2000. 104(17): p. 3884-3893.
20. Chen, X., J.A. Carroll, and R.C. Beavis, Near-ultraviolet-induced
matrix-assisted laser desorption/ionization as a function of wavelength.
Journal of the American Society for Mass Spectrometry, 1998. 9(9): p.
885-891.
21. Niu, S., W. Zhang, and B.T. Chait, Direct comparison of infrared and ultraviolet wavelength matrix-assisted laser desorption/ionization mass spectrometry of proteins. Journal of the American Society for Mass Spectrometry, 1998. 9(1): p. 1-7.
22. Lai, Y.-H., et al., Solid-phase thermodynamic interpretation of ion desorption in matrix-assisted laser desorption/ionization. The Journal of Physical Chemistry B, 2010. 114(43): p. 13847-13852.
23. Chu, K.Y., et al., Thermal proton transfer reactions in ultraviolet matrix-assisted laser desorption/ionization. Journal of The American Society for Mass Spectrometry, 2014. 25(3): p. 310-318.
24. Lu, I.-C., et al., Ion-to-Neutral Ratios and Thermal Proton Transfer in Matrix-Assisted Laser Desorption/Ionization. Journal of The American Society for Mass Spectrometry, 2015. 26(7): p. 1242-1251.
25. Lu, I.-C., et al., Ionization Mechanism of Matrix-Assisted Laser
Desorption/Ionization. Annual Review of Analytical Chemistry, 2015. 8(1):
p. 21-39.
26. Karbach, V. and R. Knochenmuss, Do single matrix molecules generate primary ions in ultraviolet matrix-assisted laser desorption/ionization.
Rapid communications in mass spectrometry, 1998. 12(14): p. 968-974.
27. Zaia, J., Mass spectrometry and glycomics. Omics: a journal of integrative biology, 2010. 14(4): p. 401-418.
第2章 基質輔助雷射脫附游離法(MALDI)之機制 2.1 前言
對於 MALDI 的機制,雖然有不同的機制相繼被提出,但是很少有明確的證據和 深入的討論。在討論 MALDI 機制的文獻中,常以離子產率(ion-to-neutral ratio) 去說明各模型的可能性,但一直以來都沒有清楚地指出其為基質的離子產率還是 分析物的離子產率,因而造成混淆,甚至引用錯誤的離子產率數值[1]。在第二 節的部分,首先會列出被報導過的離子產率數值,以及被引用錯誤的部分,過去 我們實驗室指出文獻的錯誤[2],並以實驗量測離子產率。在第三節中,將詳細 描述熱致質子轉移模型(thermal proton transfer model),用此模型預測的離子產率,
和實驗得到相近的數值[3-5]。
根據熱致質子轉移模型,影響 MALDI 游離的因素有吸收截面積(absorption cross section),螢光量子產率(fluorescence quantum efficiency),質子親和力(proton affinity),以及分子和離子的溶劑化能(solvation energy)。常用於 MALDI 的基質,
在適用的雷射波長下,有很高的吸收截面積,以及很低的螢光量子產率,因此基 質吸光後經由內轉換(internal conversion)而產生熱能,高溫使樣品的表面產生瞬 間熔融狀態,並提供能量,使基質與分析物在熔融狀態下進行質子轉移反應 (proton transfer reaction),進而產生離子。過去我們實驗室除了測量離子產率外,
也進行了其他實驗佐證熱致質子轉移模型,第六節為比較 DHB 異構物(isomers) 的實驗[6],說明基質吸收係數和質子親和力影響離子生成的效率。
回顧前幾年的文獻,比較多被討論到的是能量集結模型(energy pooling model) [7],
也有比較具體的模型去描述 MALDI 的機制,因此在各種機制都還不明確的情況 下,能量集結模型成為 MALDI 機制的主流說法,但文獻中沒有完整的實驗證據,
而且有上述引用錯誤的情況。第四節和第五節將回顧過去我們實驗室對於能量集 結模型的可能性,設計了時間解析螢光量子產率的實驗,證明 MALDI 是可以完 全不需能量集結[8, 9],另外我們也改變雷射脈衝寬度,排除多光子光游離的可
2.2 離子產率(ion-to-neutral ratio, ion yield, degree of ionization)的修正[2]
當雷射打到 MALDI 樣品時,大部分的分子會汽化,少部分形成離子,這些離 子和電中性分子的比例就稱作離子產率,描述什麼是基質離子產率,什麼是分 析物離子產率,將過去的文獻整理如表 2-1。第一篇[11]用的雷射波長是 308 nm,
光通量(fluence)為 300 J/m2,分析物的離子產率約 10-4。第二篇[12]用的雷射波 長是 248 nm,分析物的離子產率為 10-4~10-5,基質的離子產率比分析物的離子 產率小很多。第三篇[12, 13]用的雷射波長是 355 nm,這是比較常用的雷射波長,
在光通量為 100 J/m2下,基質的離子產率約 10-7,在光通量為 400 J/m2下,基 質的離子產率約 10-6。第四篇[14]用的雷射波長是 193 nm,這個波長很少在用,
193 nm 的光子能量很高,甚至高於一般金屬表面的功函數(work function),量測 出基質的離子產率約 10-4。而第五篇[15]並沒有提出離子產率的值。
和一般應用上的 MALDI 相比,大部份的文獻所用的雷射波長較短或是光通量 較大,而且在過去許多文獻常把分析物的離子產率和基質的離子產率混為一談 (表 2-1),其中有文獻[1]指出基質的離子產率為 10-4,但其數值是以 193nm 波長 實驗得到[14],這非一般 MALDI 所用的條件,因此不足以代表在 MALDI 真實 情況下之基質的離子產率。綜觀其他和 MALDI 實驗條件比較相似的文獻,分 析物的離子產率約 10-3~10-4,而基質的離子產率約 10-7~10-8。在過去二十年中,
所有的理論模型[1, 16]都把分析物的離子產率錯誤地當成基質的離子產率,這些 理論模型雖然宣稱模擬結果和理論數值相近,但因為錯誤引用數據,其實理論 模型和實驗數據相差非常大,因此有必要重新檢驗這些模型。
異於一般MALDI的條件 雷射波長308 nm,光通量 300 J/m2 雷射波長248 nm, 基質和 分析物的莫耳比為9:1 到 1:1 雷射波長193 nm, 雷射光 斑大小2.01.6 cm 表2-1 過去量測離子產率(ion-to-neutral ratio)的文獻取自[11-15]
離子產率 在分析物的閥值(2×10⁶ W/cm2 ) 分析物的離子產率2.5×10⁻⁴ 在分析物的閥值(2×10⁵ W/cm2 )分 析物的離子產率10-4 ~10-5 ,基質的 離子產率小於分析物的 基質的離子產率10-7 (100 J/m2 ) 和 5×10⁻⁶ (400 J/m2 ) 基質的離子產率1.410-4 (~230 J/m2 ) 沒有報導
樣品 0.1g/L insulin + 10g/L sinapinic acid (SA) dipentylamine + FA dipentylamine + SA ferulic acid (FA) 3-HPA BSA + 2,5-DHB 2,5-DHB
電中性分子偵測 從樣品(SA)移除的 體積 VUV游離/ TOF 石英晶體微量天 平(quartz crystal micro-balance)
吸收光譜
儀 248 nm游離/TOF 質譜儀
離子偵測 TOF質譜儀 TOF質譜儀 電荷積體電路 (charge-integrati on circuit)
離子探測
器(ion probe) TOF 質譜儀
雷射 308nm 284nm 355nm 193nm 337nm
文獻 [11] [12] [13] [14] [15]
有引用離子產率的文獻 被用於文獻中的離子產率 被引用的文獻
[17] 10
-4
無特別指基質或是分析物
[11, 12]
[16] 10
-4
無特別指基質或是分析物
[12]
[18] 10
-4
-10
-7
無特別指基質或是分析物
[12, 13]
[19] 10
-3
-10
-5
無特別指基質或是分析物
[12]
[7] 10
-3
-10
-4
無特別指基質或是分析物
[11-15]
[1] 10
-3
-10
-4
基質的離子產率
[14]
[20] 10
-3
-10
-4
無特別指基質或是分析物
[11]
表 2-2 在文獻中被引用的離子產率(ion-to-neutral ratio)取自[1, 7, 16-20]。
過去我們實驗室,除了釐清長久以來混淆的離子產率數值,也量測了分析物和基 質的離子產率,再次確認其數值的正確性,實驗結果(圖 2-1)得到分析物的離子 產率為 10-3~10-5,基質的離子產率為 10-7~10-8,和之前文獻的實驗值相近。
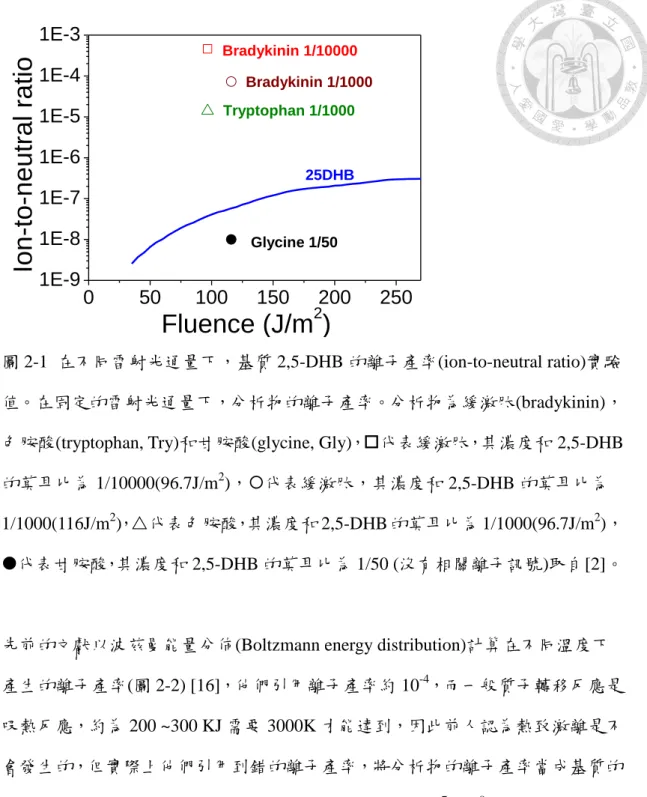
圖 2-1 可見緩激肽(bradykinin)的離子產率為 10-3~10-4,色胺酸(tryptophan, Try)的 離子產率約 10-5,而甘胺酸(glycine, Gly)沒有相關的離子訊號。根據熱致質子轉 移模型,能解釋不同的分析物,其離子產率的差異,由於分析物的質子親和力大 小會影響分析物離子生成的量,像是質子親和力小的甘胺酸,就看不到相關離子 的訊號。由於主要的中性分子和離子都是基質,因此在 MALDI 中,所有脫附分 子的離子產率是由基質決定的,實驗指出基質的離子產率約 10-7~10-8 [4, 5]。
圖 2-1 在不同雷射光通量下,基質 2,5-DHB 的離子產率(ion-to-neutral ratio)實驗 值。在固定的雷射光通量下,分析物的離子產率。分析物為緩激肽(bradykinin),
色胺酸(tryptophan, Try)和甘胺酸(glycine, Gly),代表緩激肽,其濃度和 2,5-DHB 的莫耳比為 1/10000(96.7J/m2),代表緩激肽,其濃度和 2,5-DHB 的莫耳比為 1/1000(116J/m2),代表色胺酸,其濃度和 2,5-DHB 的莫耳比為 1/1000(96.7J/m2),
代表甘胺酸,其濃度和 2,5-DHB 的莫耳比為 1/50 (沒有相關離子訊號)取自[2]。
先前的文獻以波茲曼能量分佈(Boltzmann energy distribution)計算在不同溫度下 產生的離子產率(圖 2-2) [16],他們引用離子產率約 10-4,而一般質子轉移反應是 吸熱反應,約為 200 ~300 KJ 需要 3000K 才能達到,因此前人認為熱致激離是不 會發生的,但實際上他們引用到錯的離子產率,將分析物的離子產率當成基質的 離子產率。但依照我們實驗的結果基質的離子產率約 10-7~10-8(圖 2-1),只要略 高於 1000K的溫度即可,因此熱致游離模型是可能發生的[2-5]。
0 50 100 150 200 250
1E-9 1E-8 1E-7 1E-6 1E-5 1E-4 1E-3
25DHB Tryptophan 1/1000
Glycine 1/50 Bradykinin 1/1000
Ion -to-n e u tral ra tio
Fluence (J/m
2)
Bradykinin 1/10000
圖 2-2 依照波茲曼能量分佈(Boltzmann energy distribution)作圖,不同雷射能量在 不同溫度下產生的離子產率(ion-to-neutral ratio)取自[16]。
2.3 熱致質子轉移模型(thermal proton transfer model)
離子產率可以用熱致游離模型來預測,在 MALDI 的樣品中不添加分析物,只有 基質時,反應可簡化成:
𝑀(𝑙)+ 𝑀(𝑙) ⇆ 𝑀𝐻+(𝑙) + (𝑀−𝐻)−(𝑙) (式 2-1)
在基質分子從表面脫附前,因爲密度太高,反應能夠達到平衡(反應式 2-1),可 將平衡係數寫成公式 2-2,移項後得到公式 2-3,實際上離子產率等於 K,只要 知道表面溫度 T 和吉布斯自由能 ΔG 即可算出離子產率。
RT G
M e
H M H
K M
1
2
] [
]
[
(式 2-2)
RT G
e neutral K
cation 2 1 (式 2-3) 計算表面溫度(temperature,T):
溫度可寫成熱方程式(heat equation) (公式 2-4)去描述對某物體加熱後,溫度會上
升多少,代表提供的能量有多少。
I t T
cp T 2 (1 )
0
(式 2-4) ρ0:質量密度(雷射照射前)
cp:比熱容量 κ:熱傳導率 α:吸收截面積 Φ:螢光量子產率 I:雷射強度
因為熱能被限制在雷射照射的區域,在短時間內式 2-4 的熱擴散率很小,可以視 0
/0cp2T
,將其簡化成公式 2-5,並得到其解公式 2-6 如下,描述在分子脫
附前,被雷射照射到的區域,溫度上升多少,雷射的光通量 F 是可以被量測的。
t I
cp T (1 )
0
(式 2-5) F ≡ ∫ 𝐼𝑑𝑡 =𝑡𝑡𝑓 𝛼(1−Φ)𝜌0
𝑖 ∫ 𝑐𝑇𝑇 𝑝(𝑇)𝑑𝑇
0 (式 2-6) T0:初始溫度
F:雷射光通量
ti和 tf:初始和結束的時間
固態樣品的溫度和熱容量有關,熱容量可用愛因斯坦模型(Einstein model)(公式 2-7)計算,並加入分子振動項和轉動項,修正後的愛因斯坦模型為公式 2-8,可 得到莫耳熱容量:
2 2
) 1 ( ) ( 3
kT hv kT hv
v
e e kT
R hv C
(式 2-7)
2 2
6 3
2 2
) 1 ( ) 2 (
3 ) 1 ( ) ( 3
kT hv kT hv m
N
i
i kT
hv kT hv
v i
i
e e kT
R hv R
e e kT
R hv C
(式 2-8)h:普朗克常數(Planck’s constant)
k:波茲曼常數(Boltzmann constant)
ν:分子間的振盪頻率(oscillator frequency) νi:基質的振動頻率(vibrational frequency)
公式 2-10 中的比熱容量 cp,和莫耳熱容量關係為 cp = Cp/Mw,Mw是分子量,
Cp =Cv+VTa2
b ,a 是熱膨脹係數,b 是絕熱壓縮係數。
由公式 2-6 算出在 2,5-DHB 分子脫附前,雷射光通量和樣品表面溫度的關係如圖 2-3a。先前有研究用時間解析黑體輻(time-resolved blackbody radiation)射量測溫 度[5],和實驗的結果也是符合(圖 2-3a)。
圖 2-3 計算 2,5-DHB (a)表面溫度(b) 吉布斯自由能(Gibbs free energy, ΔG)取自 [5]。
計算吉布斯自由能(Gibbs free energy, ΔG):
反應式 2-1 可寫成反應式 2-9~2-11,ΔG 可由 ΔG = ΔG1+ΔG2+ΔG3得到。
𝑀(𝑙)+ 𝑀(𝑙) ⇆ 𝑀(𝑔)+ 𝑀(𝑔) ΔG1 (式 2-9) 𝑀(𝑔)+ 𝑀(𝑔)⇆ 𝑀𝐻+(𝑔)+ (𝑀−𝐻)−(𝑔) ΔG2 (式 2-10) 𝑀𝐻+(𝑔)+ (𝑀−𝐻)−(𝑔) ⇆ 𝑀𝐻+(𝑙)+ (𝑀−𝐻)−(𝑙) ΔG3 (式 2-11)
反應式 2-10 可用量子化學初始(ab initio)計算出來,反應式 2-9 和 2-11 分別是分 子和離子的溶劑化(solvation),可用極化連續介質模型(polarizable continuum model , PCM)以電腦計算出溶劑化的能量(solvation energy)。介電常數 ε 可以用
Caillol et al.提出的介電常數的方法(公式 2-12)[21]:
2
3 4 3
) 1 2 )(
1 ( 3
) 1 2 )(
1
(
g
kT N
(式 2-12)
:高頻率介電常數(high-frequency dielectic constant)
N:密度
':立體極化度(steric polarizability) μ:偶極矩(dipole moment)
g: Kirkwood 相關係數(Kirkwood correlation factor)
高溫時可寫成近似 g=1,極化度(α’)和極距(μ ) 可用量子化學初始計算出來,計 算出 2,5-DHB 的極化度和極距分別為 α'=1.84 × 10⁻²³ cm3和μ = 2.8D[3]。室溫下 的密度由實驗量測得到,由一般液體的平均體積膨脹係數,得到體積熱膨脹係數 0.0008 (K-1),將密度寫成和溫度的關係是如下:
𝜌𝑁(𝑇) = (1+0.0008×∆𝑇)𝜌𝑁(𝑇=300𝐾) (式 2-13)
根據反應式 2-13,基質 M 為 2,5-DHB 時,吉布斯自由能(ΔG)和樣品表面溫度(T) 的關係如圖 2-3b。用上述公式計算得到最後的結果,離子產率約 10-7~10-8符合 實驗結果(圖 2-4),所以我們認為熱致游離模型是有可能發生的。在 MALDI 中,
分子要汽化必須要高溫,當溫度增加時,熱致質子轉移就會發生,除非是熱致質 子轉移反應的ΔG 太大,所以我們認為熱致質子轉移模型是一個主要的機制。
圖 2-4 在不同雷射光通量下,α-cyano-4-hydroxycinnamic acid (CHCA), ferulic acid (FA), sinapinic acid (SA)和 2,5-dihydroxybenzoic acid (2,5-DHB)的離子產率 (ion-to-neutral ratio)的實驗值(實線)和計算值(虛線)取自[4]。
2.4 在 MALDI 中能量集結是必要的嗎? [8-10]
目前探討 MALDI 機制的模型可分為兩大類,一個基態驅動模型(ground
state-driven model),指分子並未經過激發態就形成離子,像是熱致游離模型和極 性流體模型,另一個是激發態驅動模型(excited state-driven),指分子會先經過激 發態再形成離子,可描述為光致激發態而游離,能量集結為光致激發態而游離的 一種,其反應可寫成反應式 2-14~2-16,反應式 2-14 為基質分子從基態躍遷到激 發態,反應式 2-15 和 2-16 分別為兩階段的能量傳遞:
M(𝑆0) + ℎ𝜈 → M(𝑆1) (式 2-14) M(𝑆1) + M(𝑆1) → M(𝑆0) + M(𝑆𝑛) (式 2-15) M(𝑆1) + M(𝑆𝑛) → M(𝑆0) + 𝑀++ 𝑒− (式 2-16)
第一個階段為兩個 S1的能量傳遞,第二個階段為 S1和 Sn的能量傳遞。根據能量 集結模型,只考慮反應式 2-14 和 2-15,將基態(S0)和第一激發態(S1)的分子群體 (population)寫成速率方程式(rate equation):
2 1 2 1
1 1
0 0
0
0( )] ( ) [ ( )] ( ) [ ( )] [ ( )] [ ( )]
[ I t S t I t S t k S t k S t dt
t S d
s
(式 2-17)
2 1 2 1
1 1
1 1 1
0 0
0 1
)]
( [ 2 )]
( [ )]
( [ ) (
)]
( [ ) ( )]
( [ ) ( )]
( [ ) )] ( ( [
t S k t S k t S t I
t S t I t S t I t S t dt I
t S d
n s
s
(式 2-18)
α0:S0躍遷到 S1的吸收截面積(absorption cross section) α1:S1躍遷到 Sn的吸收截面積(absorption cross section)
α0S:S1躍遷到 S0的收激發射截面積(stimulated emission cross section) α1S:Sn躍遷到 S1的收激發射截面積(stimulated emission cross section) I(t):雷射強度為時間 t 的函數
k1:一級反應速率常數(first-order rate constant, e.g. photon emission, internal conversion)
k2:二級反應速率常數(second-order rate constant, e.g. singlet-singlet annihilation) 螢光量子產率(fluorescence quantum yield, Q)正比於 S1(t)的積分,S1(t)為時間函數,
積分由雷射脈衝起始(t = 0)到螢光完全衰減(t = t’),代表所有時間內放出的螢光,
C 為常數(proportional constant),如下:
'
0t 1( )
t
t S t dt
C
Q (式 2-19)
當激發用雷射的脈衝寬度(excitation laser pulse width)遠小於激發態的生命期 (excited lifetime),而且螢光強度的測量在激發雷射結束後,可用方程式 2-20 描 述螢光強度的衰減如下:
2 1 2 1
1
1( )] [ ( )] 2 [ ( )]
[ k S t k S t dt
t S
d (式 2-20)
量測基質螢光強度的實驗,使用的 355nm 雷射,脈衝寬度為 20ps,使用皮秒雷 射(picosecond laser)可使公式 2-18 簡化成公式 2-20。改變雷射光通量,觀察螢光 量子產率和生命期是否改變。當雷射光通量提高時,產生的 S1會增加,因此增 加兩個 S1靠近的機率,假設 S1-S1湮滅(S1-S1 annihilation)會發生(式 2-15),兩個 S1靠近時,就會進行 S1-S1湮滅,兩個 S1分別會回到 S0和被激發到 Sn,此時螢
目前證實並非所有基質都會發生 S1-S1湮滅的現象,研究了十二個基質[9],有七 個基質不會發生 S1-S1湮滅,實驗的結果可看到 THAP 並沒有此現象(圖 2-5a),
其他像是 ATT,FA 和 3-HPA 等常用的基質亦沒有此現象,其中有四種基質會發 生 S1-S1湮滅,像是 2,5-DHB 有此現象(圖 2-5b),另外 SA 因生命期太短,無法 決定是否有 S1-S1湮滅的現象。雖然目前第二個階段 Sn M+ (式 2-16)無法被證 實,但如果第一個階段 S1 +S1 S0 +Sn(式 2-15)就沒有發生,就可以說明在 MALDI 中,能量集結(energy pooling)不重要,也不是主要的機制。
圖 2-5 時間解析螢光光譜圖(a) 2′,4′,6′-trihydroxyacetophenone (THAP) (b) 2,5-dihydroxybenzoic acid (2,5-DHB)取自[8]。
2.5 雷射脈衝寬度(pulse width)對 MALDI 離子產生是否有影響?[10]
一般 UV-MALDI 所用的波長為 355 nm 和 337 nm,其脈衝寬度約為 10 ps 到 10 ns,
此實驗中所用的基質為 CHCA,SA 和 2,5-DHB,改變的脈衝寬度範圍由 170 ps 到 1.5 ns,由改裝後的交叉分子束量測離子產率(圖 2-6a),離子產率可代表離子 化的效率。圖 2-6b 顯示離子產率不受脈衝寬度影響,根據實驗結果,我們將討 論各個模型的可能性。
![圖 2-4 在不同雷射光通量下,α-cyano-4-hydroxycinnamic acid (CHCA), ferulic acid (FA), sinapinic acid (SA)和 2,5-dihydroxybenzoic acid (2,5-DHB)的離子產率 (ion-to-neutral ratio)的實驗值(實線)和計算值(虛線)取自[4]。 2.4 在 MALDI 中能量集結是必要的嗎? [8-10] 目前探討 MALDI 機制的模型可分為兩大類,一個基態驅動模型(groun](https://thumb-ap.123doks.com/thumbv2/9libinfo/9603963.630229/41.892.142.764.97.1171/在不同雷射光通量SA和DHB離子產率實驗值實線和計算值虛線取中能.webp)
![圖 2-5 時間解析螢光光譜圖(a) 2′,4′,6′-trihydroxyacetophenone (THAP) (b) 2,5-dihydroxybenzoic acid (2,5-DHB)取自[8]。](https://thumb-ap.123doks.com/thumbv2/9libinfo/9603963.630229/43.892.132.774.108.912/圖25時間解析螢光光譜圖a246trihydroxyacetophenoneTHAPb25dihydroxybenzoicacid25DHB取自8.webp)
![圖 2-6 (a)改裝後的交叉分子束,可同時量測離子和中性分子。(b)在不同雷射脈 衝寬度下,三種基質的相對離子產率。灰色:CHCA,橘色:SA,綠色: 2,5-DHB[10]。 2.5.1 多光子吸收而游離的可能性 為了檢驗多光子吸收而游離的可能性,利用改變雷射脈衝寬度,但雷射能量不改 變的情況下,如果離子化效率不變,就可以確認多光子吸收而游離並非 MALDI 離子產生的主因。其反應式和速率方程式如下: M(](https://thumb-ap.123doks.com/thumbv2/9libinfo/9603963.630229/44.892.137.785.113.518/改裝後的測離子和多光子多光子果離子多光子.webp)
![圖 3-1 飛行時間式質量分析器的時間延遲加速取自[1]。](https://thumb-ap.123doks.com/thumbv2/9libinfo/9603963.630229/52.892.142.777.119.677/圖31飛行時間式質量分析器的時間延遲加速取自1.webp)
![圖 3-3 交叉分子束偵測器的結構取自[2]。 電子撞擊電擊器使用的是 Brink 電離器,電子由高溫的電熱絲游離產生,產生的 電子被較高電位的柵極(grid)加速進入電離區,並來回在電離區震盪多次,增加 離子化的有效電流,產生的離子再經過離子透鏡(ion lens)拉出電離區,聚焦注入 質量分析器。四極柱質量分析器由四個平行的圓柱組成,相對的兩個電極相連, 供應電壓為 f(t) = U+Vcos(2πft),U 是直流電(DC),V 是無線電頻率(RF)的電壓, f 是頻率,另一對電極則供應大小相同的](https://thumb-ap.123doks.com/thumbv2/9libinfo/9603963.630229/54.892.140.782.121.635/交叉分子束偵測器結構取自電子撞擊電擊器使電離器電子由高過離子.webp)
![圖 3-4 四極柱質量分析器取自[3]。](https://thumb-ap.123doks.com/thumbv2/9libinfo/9603963.630229/55.892.136.572.282.598/圖34四極柱質量分析器取自3.webp)
![圖 3-5 線性離子阱質量分析器取自[1]。](https://thumb-ap.123doks.com/thumbv2/9libinfo/9603963.630229/56.892.146.565.391.723/圖35線性離子阱質量分析器取自1.webp)