R E S E A R C H Open Access
Reduction in antioxidant enzyme expression and
sustained inflammation enhance tissue damage
in the subacute phase of spinal cord contusive
injury
Chih-Yen Wang1, Jen-Kun Chen2, Yi-Ting Wu2, May-Jywan Tsai3, Song-Kun Shyue3, Chung-Shi Yang2,4*, Shun-Fen Tzeng1*
Abstract
Background: Traumatic spinal cord injury (SCI) forms a disadvantageous microenvironment for tissue repair at the lesion site. To consider an appropriate time window for giving a promising therapeutic treatment for subacute and chronic SCI, global changes of proteins in the injured center at the longer survival time points after SCI remains to be elucidated.
Methods: Through two-dimensional electrophoresis (2DE)-based proteome analysis and western blotting, we examined the differential expression of the soluble proteins isolated from the lesion center (LC) at day 1 (acute) and day 14 (subacute) after a severe contusive injury to the thoracic spinal cord at segment 10. In situ apoptotic analysis was used to examine cell apoptosis in injured spinal cord after adenoviral gene transfer of antioxidant enzymes. In addition, administration of chondroitinase ABC (chABC) was performed to analyze hindlimb locomotor recovery in rats with SCI using Basso, Beattie and Bresnahan (BBB) locomotor rating scale.
Results: Our results showed a decline in catalase (CAT) and Mn-superoxide dismutase (MnSOD) found at day 14 after SCI. Accordingly, gene transfer of SOD was introduced in the injured spinal cord and found to attenuate cell apoptosis. Galectin-3,b-actin, actin regulatory protein (CAPG), and F-actin-capping protein subunit b (CAPZB) at day 14 were increased when compared to that detected at day 1 after SCI or in sham-operated control. Indeed, the accumulation ofb-actin+immune cells was observed in the LC at day 14 post SCI, while most of reactive astrocytes were surrounding the lesion center. In addition, chondroitin sulfate proteoglycans (CSPG)-related proteins with 40-kDa was detected in the LC at day 3-14 post SCI. Delayed treatment with chondroitinase ABC (chABC) at day 3 post SCI improved the hindlimb locomotion in SCI rats.
Conclusions: Our findings demonstrate that the differential expression in proteins related to signal transduction, oxidoreduction and stress contribute to extensive inflammation, causing time-dependent spread of tissue damage after severe SCI. The interventions by supplement of anti-oxidant enzymes right after SCI or delayed administration with chABC can facilitate spinal neural cell survival and tissue repair.
* Correspondence: cyang@nhri.org.tw; stzeng@mail.ncku.edu.tw
1Department of Life Sciences, National Cheng Kung University, Tainan, Taiwan
2Center for Nanomedicine Research, National Health Research Institutes, Zhunan, Taiwan
Full list of author information is available at the end of the article
© 2011 Wang et al; licensee BioMed Central Ltd. This is an Open Access article distributed under the terms of the Creative Commons Attribution License (http://creativecommons.org/licenses/by/2.0), which permits unrestricted use, distribution, and reproduction in any medium, provided the original work is properly cited.
Background
Traumatic spinal cord injury (SCI) causes permanent paralysis in patients due to low regeneration of the CNS [1]. The events occurring immediately after SCI include neuronal fiber damage, mass ischemic neural cell necro- sis and apoptosis, metabolic disturbances, the destruction of microvasculature, inflammation, lipid peroxidation, free radical production, demyelination, and glial scar for- mation, leading to extensive secondary tissue injuries [1-3]. Robust cell death in the injured region happens from seconds to weeks after SCI, which results in the for- mation of the cavities or cysts that blockades the ascend- ing and descending neurotransmission [2,4]. In response to local inflammation after SCI, microglia, CNS-resident macrophages, are activated, which trigger inflammatory reaction in the injured center [2,5]. Accordingly, it is thought that the inflammatory reactions could take place over weeks after SCI, which induce the recruitment of neutrophils, macrophages and T cells from hours to weeks after injury [2,5-7]. In addition, astrocytes become reactivated with an increase in number and hypertrophy, a process so called as gliosis. The event forms glial scar to prevent the spread of injury factors and to inhibit the expansion of inflammatory reactions [1,8]. Although the degenerative axon of the uninjured cell body can be sti- mulated to be regenerative, the scar structure is extre- mely compact which creates a physical barrier to axon regeneration. Moreover, the scar tissue contains the inhi- bitors to axon outgrowth, producing a microenvironment that is not beneficial for tissue repair after SCI [1,9,10].
Recently, DNA microarray and proteome analysis have been used to understand SCI-induced pathophysiology and to find potential therapeutic targets. Several studies using genechip microarray have described gene expres- sion changes from impact to months after SCI. By using the technology, genes associated with transcription and inflammation have been found to be upregulated at the early stage (from minutes to weeks) after SCI, while the genes of structural proteins and genes encoding proteins involved in neurotransmission are downregulated [2,11,12]. Although an increased expression of growth factors, axonal guidance factors, extracellular matrix molecules and angiogenic factors can be observed in the chronic phase (days to years) following SCI, oxidative stress-related genes and proteases are still increased [2,13,14]. The proteomic profile has also shown that several proteins involved in neural function, cell adhe- sion/migration, stress/metabolism, and apoptosis were detected at day 1 post SCI [15]. Recent proteome-based studies have also reported dynamic protein change pro- file in the injured spinal cord which were collected from 2 cm length of the cord segment at 8 hour, day 1, day 3 and day 5 after moderate contusive injury [16].
A subacute time point (approximately 2 weeks) has been suggested to be an appropriate time window for treatment since it could be more favorable for axon regeneration and behavioral recovery than that carried out at the acute stage of SCI [17]. However, global changes of proteins in the injured epicenter at the suba- cute stage of SCI remain to be elucidated.
Since a contusive injury to the spinal cord is most similar to crush and fracture spinal cord injuries in human [18], a well-characterized NYU impactor device was used to induce severe spinal cord contusion.
Through proteomics-based analysis, the study was aimed at examining differential protein expression in the lesion center (LC) of the injured spinal cord isolated from rats at day 14 (subacute SCI) or from rats at day 1 (acute SCI) post SCI. Western blot analysis and immunofluorescence were also conducted to validate the proteome analysis by examining the expression pro- file of proteins identified in the LC at the different sur- vival time points after SCI. Our results provide target molecules for the potential treatments which can effi- ciently improve neural survival in the injured spinal cord and to enhance hindlimb recovery in rats with SCI.
Materials and methods Spinal cord injury
Female adult Sprague-Dawley rats (250 g ± 30; n = 45 rats) were anesthetized, and their spinal cords were exposed by laminectomy at the level of T9/T10. A 10-g rod was dropped onto the laminectomized cord from a height of 50 mm (severe) using a device developed at the New York University [19,20]. During surgery the rectal temperature was maintained at 37°C using a ther- mostatically regulated heating pad and bladder evacua- tion was then applied daily. Antibiotics (sodium ampicillin 80 mg/kg) were injected post surgery. Animal care was provided in accordance with the Laboratory Animal Welfare Act and Guide for the Care and Use of Laboratory Animals approved by Institutional Animal Care and Use Committee of National Cheng Kung University.
Sample preparation for 2-DE
The spinal segments (4-5 mm) containing the LC were isolated at day 1 and 14 post severe SCI (n = 10 rats).
The samples isolated from the injured spinal cord at the two time points (day 1 and 14) were prepared in parallel for 2-DE. In brief, the tissues were homogenized in 0.2 ml of cold detergent free lysis buffer consisting of 40 mM Tris, 40 mM sodium acetate and protease inhi- bitor cocktail for 30 min, followed by sonication. The homogenate was centrifuged at 10,000 g for 30 min at 4°C to remove insoluble debris. The proteins were then
precipitated by cold acetone with 10% trichloroacetic acid overnight. After centrifugation, the protein pellet was washed with cold acetone followed by air drying, and then resuspended in the rehydration buffer contain- ing 8 M urea, 4% CHAPS, 0.2% Bio-Lyte 3/10 (Bio-Rad, Hercules, CA) and 50 mM dithiothreitol (DTT) (Sigma, St. Louis, MO). Protein concentration was assessed using a Bio-Rad detergent compatible kit.
2-DE
For the first-dimension IEF, pH 3-10 non-linear range IPG strips (11 cm) were rehydrated with 200μl of solu- bilized sample (200μg protein amount) for 12 h before the sample was separated by IEF at 100 V for 0.5 h, 500 V for 0.5 h, 1000 V for 1 h, 5000 V for 1 h, and finally 8000 V for 3 h. Prior to the second dimension SDS-PAGE, the IPG strips were equilibrated with 2 ml of equilibration buffer consisting of 0.375 M Tris, 6 M urea, 2% SDS, 20% glycerol and 0.02 g/ml DTT at 25°C for 15 min followed by equilibration in 0.375 M Tris, 6 M urea, 2% SDS, 20% glycerol and 0.025 g/ml iodoaceta- mide (IAA) at 25°C for 15 min. The second dimensional SDS-PAGE used a 10% separating gel and was performed without a stacking gel. The equilibrated IPG gel strip was placed on top of the SDS-PAGE gel and was sealed with 0.5% low-melting temperature agarose with 0.01% bro- mophenol blue. Electrophoresis was carried out at 180 V until the tracking dye reached the bottom of the gel. The gel was subjected to silver staining according to the method described by Tsai et al. [21].
Quantitative analysis of the proteins in the 2-DE
Protein pattern images in 2-DE SDS-PAGE were obtained using a high-resolution scanner and the amount of protein in each spot was estimated using ImageMaster 2D Platnum software (v7.0, GE Healthcare Bio-Sciences AB, Uppsala, Sweden). The volume of a protein spot was defined as the sum of the intensities of the pixel units within the protein spot. To correct quan- titative variations in the intensity of protein spots, spot volumes were normalized as a percentage of the total volume of all the spots present in each gel.
Protein identification by mass spectrometer
The protein spots were manually excised from silver stained 2-DE gels, destained, washed and in-gel digested as follows. The gel pieces were transferred to the destain solution (0.1 g K3Fe(CN)6and 0.16 g Na2S2O3solved in 10 ml double deionized water) for another 10 minutes, reduced with 50 mM DTT in 25 mM ammonium bicar- bonate (pH 8.5) at 37°C for one hour, and then alkylated with 100 mM IAA in 25 mM ammonium bicarbonate (pH 8.5) at 37°C for one hour. After the gel pieces were dehydrated and dried by SpeedVac concentrator, the
dried gel pieces were rehydrated with 20 ng of modified trypsin (sequencing grade, Promega, Madison, WI, USA) in 25 mM ammonium bicarbonate (pH 8.5) at 37°C for 16 h. The tryptic peptide mixture was concentrated and immediately redissolved for protein identification.
Matrix assisted laser desorption ionization time-of-flight mass spectrometer (MALDI-TOF MS) (Autoflex III, Bruker Daltonics, Bremen, Germany) was employed for peptide mass fingerprinting (PMF) analysis. The MALDI-TOF MS operated with reflectron mode was externally calibrated with peptide calibration standard I (Bruker Daltonics) for each batch of samples and neigh- boring calibration with angiotensin II (1046.5418 m/z), [Glu]-fibrinopeptide B (1570.6774m/z), and ACTH frag- ment 18-39 (2465.1983m/z) for each sample to achieve 50 ppm or better of mass measurement accuracy in the range of 920-3500m/z. The mass spectra were acquired by flexControl software (v3.0, Bruker Daltonics) and processed by flexAnalysis software (v3.0, Bruker Dal- tonics). To generate peak lists from raw MS data, the sophisticated number assigned program (SNAP) peak detection algorithm was used, filtered with S/N >3, and then smoothed with SavitzkyGolay algorithm for 0.15 m/z peak width and 4 cycles. We subsequently searched all peak lists against Mascot engine with Swiss- Prot database (Release version 56.6 of 16-Dec-2008).
The search parameters allowed for one missed cleavage tryptic peptides, oxidation of methionine, carbamido- methylation of cysteine and at least 50 ppm mass accu- racy. The probability-based Mowse scores with the p value less than 0.05 were accepted for protein identification.
Western blotting
The protein extracts (30 μg/lane) used for 2-DE were separated on 10% SDS-PAGE and then transferred to a nitrocellulose membrane (Millipore, Billerica, MA). The membrane was then probed overnight at 4°C with pri- mary antibodies at the appropriate dilution, and then incubated with HRP-conjugated secondary antibodies (Jackson ImmunoResearch Laboratories, West Grove, PA, USA) for 1 h at room temperature. The detection was carried out by using ECL chemilluniscence (Amer- sham Pharmacia, Buckinghamshire, United Kingdom).
The antibodies used for this study are listed as follows:
anti-b-actin, anti-actin regulatory protein (CAPG) and anti-cathepsin D (CATD) antibodies (Santa Cruz Biotechnology, Santa Cruz, CA); anti-GFAP and anti-GAPDH antibodies (Chemicon, Temecula, CA);
anti-superoxide dismutase [Mn] (MnSOD) antibody (Stressgen, Ann Arbor, MI); anti-dihydropyrimidinase- related protein-2 (DPYL-2)/CRMP-2, DPYL-5, catalase (CAT), heat shock protein-60 (Hsp60), Hsp27, galectin- 3 (LEG3), latexin (LXN), peroxiredoxin-1 (Prx1), and
Prx6 antibodies (ABcam, Cambridge, MA); anti-extracel- lular signal-regulated kinase (ERK) antibody (Cell Sig- naling, Beverly, MA, USA);F-actin-capping protein subunitb (CAPZB) antibody (Everest biotech, UK); anti- Iba1 antibody (Wako Pure Chemical, Osaka, Japan).
Analysis of CSPG in the injured spinal cord tissues Spinal tissue blocks (approximately 4-5 mm thickness/
block) were collected from the LC and from rostral or caudal regions adjacent to the epicenter at the different survival time points after severe SCI. The tissues were homogenized in extraction solution containing 40 mM Tris, 40 mM sodium acetate and protease inhibitor cock- tail (Sigma) using the sonicator. Protein concentration was assayed using the Bio-Rad DC kit (Bio-Rad, Hercules, CA).
Protein extracts (30μg) were digested at 37°C for 3-5 h with 0.03 U of chondroitinase ABC (chABC; Sigma), loaded onto 10% SDS-PAGE, and then transferred to nitrocellulose membrane. The membrane was incubated with anti-chondroitin-4-sulfate antibody (Chemicon, Temecula, CA) overnight at 4°C and HRP-conjugated sec- ondary antibody for 1 h at room temperature. The detec- tion was carried out by using ECL chemilluniscence.
Immunohistochemistry
Animals were perfused intracardially with 0.9% cold NaCl, followed by 4% paraformaldehyde in 0.1 M phos- phate buffer. The spinal cords were removed, postfixed in 4% paraformaldehyde overnight, and then cryopro- tected in PBS containing 30% (w/v) sucrose for 3 days.
The cord (approximately 2 cm in length covering the epi- center) was excised, embedded in Tissue Tek OCT (Sakura Finetek, CA), and then longitudinally sectioned at 20μm thickness. Tissue sections were collected onto glass slides and dried at 37°C. The tissue sections were incubated with anti-b-actin, anti-GFAP (Chemicon), anti-CD11b (BD Biosciences, San Jose, CA, USA), and anti-CD49f (BD Biosciences) in PBS containing 5% horse serum overnight at 4°C in a humidified chamber, fol- lowed by biotinylated secondary antibodies for 1 hr and fluorescein-avidin D (Vector, Burlingame, CA, USA) or Cy3 anti-avidin (Vector) for 45 min at room temperature.
The nuclear staining was accessed using 1μg/ml DAPI (4’,6’-diamidino-2-phenylindole; Sigma) for 1 min. The staining was visualized using a Nikon E-800 microscope equipped with a cooling CCD system (Diagnostic Instru- ments Inc., Sterling Heights, MI), or under a confocal laser-scanning microscope (Leica TCS SPE).
Administration of recombinant adenovirus encoding human superoxide dismutase (hSOD), catalase (hCAT) and glutathione peroxidase (hGPx)
Human Cu, Zn-SOD, GPx, or CAT cDNA containing the entire coding sequence was subcloned into the
adenovirus shuttle plasmid vector, which contains a pro- moter of the human phosphoglycerate kinase (PGK) and a polyadenylation signal of bovine growth hormone [22].
Adenoviral administration was followed the procedure as reported previously [23]. Briefly, after the dorsal sur- face of the spinal cord was compressed by dropping a 10-gm rod from a height of 25 mm (moderate), a 5-μl Exmire microsyringe with a 31-gague needle was posi- tioned at the midline of the cords 2 mm rostral to the contusive center. PBS (no Ad; 2 μl/amimal; n = 3), con- trol Ad (1 × 10⁸ pfu/μl/animal; n = 3), rAd-SOD (1 × 10⁷pfu/animal; n = 3), rAd-CAT (8 × 10⁷ pfu/animal; n
= 3) or rAd-GPx (4 × 10⁷ pfu/animal; n = 3) was injected 0.8 mm into the dorsal column of the spinal cord within 20 min. Animals were anesthetized with deep pentobarbital, and then perfused with 4% parafor- maldehyde in 0.1 M phosphate buffer (pH 7.4). Spinal cords were removed, post-fixed in 4% paraformaldehyde for 3-4 days, and then cryoprotected in 30% w/v sucrose in PBS for 1 day. Approximately 3-4 mm length of the LC (2-3 mm) portion was cut. The tissue block was embedded in OCT medium, and then vertically sec- tioned at 12μm thickness. The tissue sections were sub- jected to in situ apoptotic analysis.
In situ apoptotic analysis
In situ DNA fragmentation detection kit was purchased from Oncogene (TdT-FragEL TM kit) to study apopto- tic cell death. In brief, tissue sections were warmed and dehydrated in PBS. Proteinase K was applied to the tis- sues followed by 3% H2O2 in methanol. Terminal deoxy- nucleotidyl transferase (TdT) was added to the tissues at 37°C for 1.5 hours. The stop solution was then added to terminate the reaction. The apoptotic cells (TdT-FragEL
+ cells) were visualized by incubating tissues with DAB, and counted per section.
Preparation of primary astrocytes and microglia
Media and antibiotics were purchased from Invitrogen (Carlsbad, CA, USA). Cell cultureware and Petri-dishes were obtained from BD Biosciences (San Jose, CA, USA). Fetal bovine serum (FBS) was the product of Hyclone Laboratories (Logan, UT, USA). Primary neuro- nal and mixed glial cultures were prepared as previously described [19]. In brief, cerebral cortices were removed from embryonic day 17-18 or 1-2-day-old Sprague- Dawley rat brains for neuronal and mixed glial cultures, respectively. The tissue was dissociated in 0.0025% tryp- sin/EDTA and passed through a 70-μm pore nylon mesh. After centrifugation, the cell pellet was resus- pended in DMEM/F-12 (D/F) containing 10% FBS, 50 U/ml penicillin and 50 mg/ml streptomycin. Mixed glial cells (107 cells/flask) were then plated onto poly-D- lysine-coated T75 tissue culture flasks. The medium was
renewed every 2-3 days. Eight days later, microglia were collected using shake-off method [20]. The majority of the remaining cells in the culture flask were astrocytes.
Astrocytes and microglia were treated with 20 ng/mL of tumor necrosis factor-a and interleukin 1b (T/I; R&D, Minneapolis, MN).
Injection of chondroitinase ABC (chABC)
The animals received severe SCI, and were treated with chABC (Sigma) right after injury or at day 3 post SCI.
The fluid containing 3 μl of PBS (vehicle; n = 4) or chABC (0.03 U/injection, 0.06/rat; n = 4, acute injection;
n = 4, delayed injection) were administered by intrasp- inal injection at the amount of 0.06 U/rat. Briefly, the fluid was injected into approximately 1 mm rostral and caudal to the lesion epicenter. After each injection, the 31-gauge needle was maintained in the spinal cord for an additional 2 min to reduce the possibility of the leak- age of the injected fluid from the site. The procedure of animal care was described as above.
Behavioral Analysis
As previously described [24], animals received either vehicle or chABC were weekly assessed for locomotor function by two blinded observers, using BBB hindlimb locomotor rating scale [20]. Locomotor activities were evaluated by placing animals for 4 min in the open-field with a molded plastic surface. Hindlimb locomotor recovery in animals was scored on the scale of 0 (no hindlimb movement) to 21 (normal mobility).
Statistical Analysis
The results showing the expression levels of the proteins are presented as mean ± SEM. The two tailed student’s t test and repeated measures analysis of variance were performed to evaluate the statistical significance of the results (p value < 0.05).
Results
Comparative protein expression between the acute and chronic injured spinal cord tissues
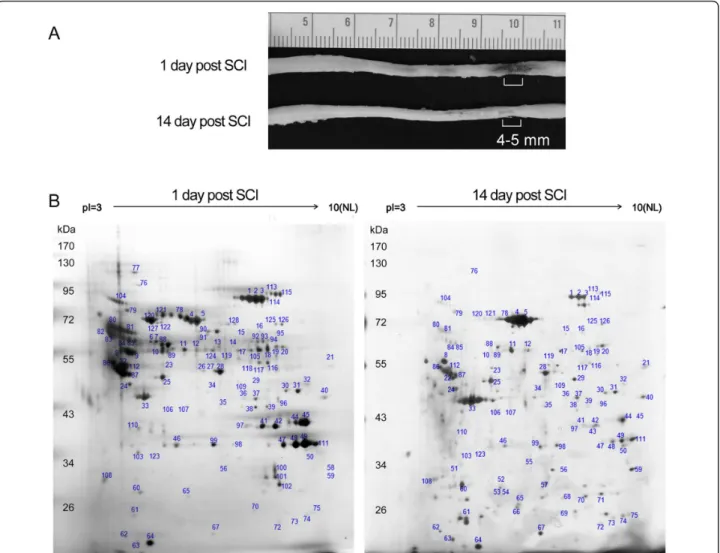
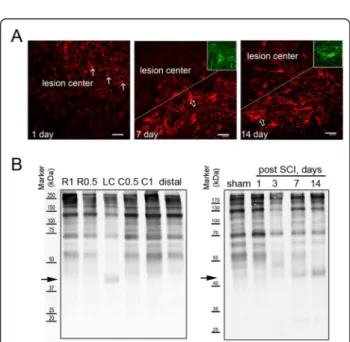
The spinal cord tissues were dissected from the LC at day 1 (acute) or day 14 (subacute) post SCI (Figure 1A).
Through 2-DE and subjected to MALDI-TOF analysis, we found that protein spots mainly appeared in the sec- tion of the pI values 3-10 and the molecular weight was approximately from 20-130 kDa (Figure 1B). An average of 222 protein spots were detected by Image Master 2D analysis software in the acute group and 238 protein spots in the subacute group (Figure 1B). Total 128 pro- teins were successfully identified through MALDI-TOF mass spectrometry and subsequent database searching (Tables 1, 2, 3 and 4). In comparison to the protein expression in the acute group, quantitative data
indicated that the expression intensity of 7 or 12 proteins was biostatistically decreased (Table 1) or increased (Table 2) at least by 1.5-fold in the subacute phase, respectively. However, 42 proteins were considered to have less difference in their expression between day 1 and 14 post SCI (Table 3).
Expression of oxidoreduction-related proteins in the injured spinal cord in the subacute phase
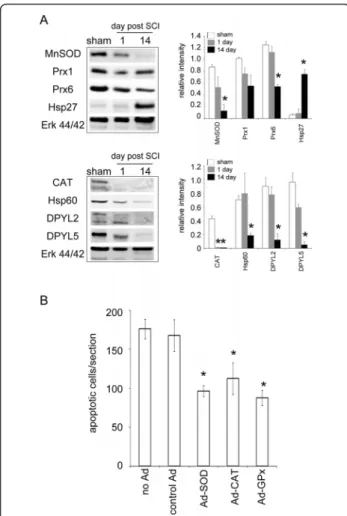
An increase in Hsp27 (HSPB1; spot 66) at day 14 after SCI was observed by proteomic analysis (Table 2) and western blotting (Figure 2A). As shown in Table 3, the proteomic analysis indicated that the expression of DPYL2 (spot 88, 90 and 91), DPYL5 (spot 92-94), and heat shock protein 60 (CH60/Hsp60; spot 6 and 7) in the LC at day 14 post SCI was reduced when compared to that detected at day 1. Although no significant differ- ence in the intensity of peroxiredoxin 1(Prx1; spot 73 and 75) and Prx6 (spot 65) was seen in the LC between day 1 and day 14 (Table 3), western blot analy- sis showed that these proteins were time-dependently reduced post SCI (Figure 2A).
The protein spot 74 in 2DE gel was identified as MnSOD. After normalization by the total volume of the protein spots indicated in 2DE gel, its relative intensity levels in the LC collected at day 14 post SCI was much higher than that measured at day 1 (Table 2). Western blot analysis was performed to ensure the levels of MnSOD in the LC at the two survival time points.
Unexpectedly, the levels of MnSOD were found to reduce at day 14 when compared to that seen in the sham control or injured tissue at day 1 post SCI (Figure 2A). The findings from western blotting showing a decreased level of MnSOD in the LC at day 14 were confirmed by immunofluorescence (see Additional File 1; Figure S1). We also noticed that the levels of Cu, Zn-SOD was reduced in the LC at day 14 post SCI, whereas GPx was expressed in the sham-operated and injured spinal cord (see Additional File 1; Figure S1). In comparison with that observed in the LC at day 1 post SCI, catalase (CAT; spot 95) had a decreased trend at day 14 (Table 3). The observation from the proteomic analy- sis was confirmed by western blot analysis (Figure 2A).
Given the fact that the reduction of the antioxidant enzymes in the LC at day 1 and day 14 post SCI com- pared to that in sham-operated tissues (Figure 2A), we examined whether the neural cell survival was increased after gene transfer of antioxidant enzymes (SOD, CAT, and GPx) via adenoviral vector right after SCI. In paral- lel, we conducted rAd-GFP gene transfer into the con- tused spinal cord to evaluate the efficacy of intraspinal injection of recombinant adenovirus. Most neural cells in the injured spinal cord were transduced by rAd-GFP (see Additional File 2; Figure S2). In situ apoptotic
analysis showed that rAd-SOD, rAd-CAT, and rAd-GPx, but not control Ad, significantly reduced the number of apoptotic cells in the injured spinal cord compared to those found in the injured spinal cord without any treat- ment (Figure 2B).
Extensive inflammation in the injured spinal cord in the subacute phase
We noticed thatb-actin (spot 33) and b-tubulin 5 (spot 22) was biostatistically increased in the LC at day 14, when compared to that detected at day 1 (Figure 1B and Table 2). The intensity of actin filament capping proteins, CAPG (spot 35) and CAPZB (spot 52), were
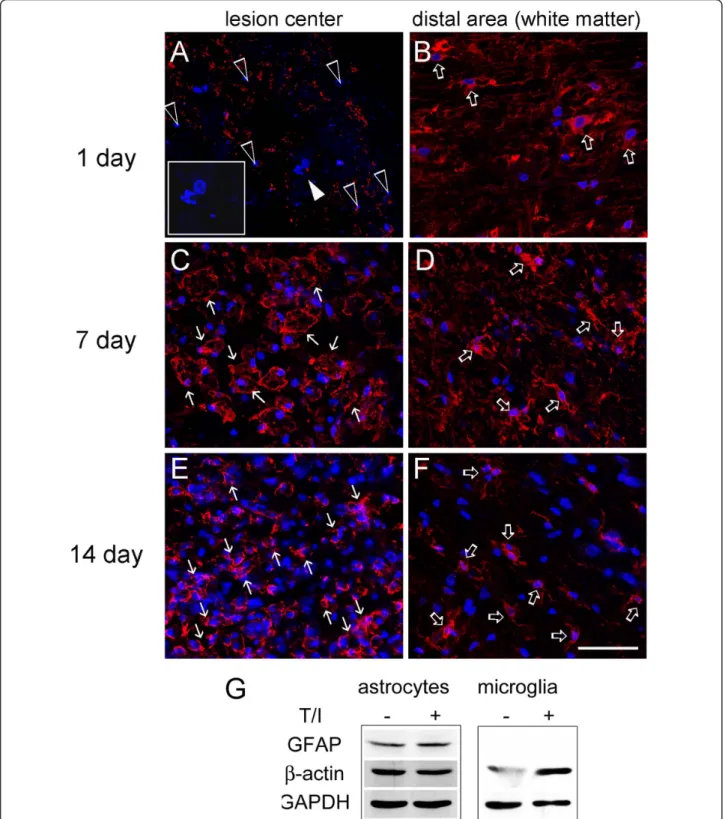
also found increased in 2-DE (Table 2). Western blot analysis also verified that b-actin, CAPG and CAPZB were dramatically increased in the LC at day 14 post SCI (Figure 3). Immunofluorescence also confirmed that b-actin+ cells with an irregular morphology accumulated exclusively in the LC at day 7 and 14 post SCI (Figure 4C, E), while b-actin+cell debris was detected in the LC at day 1 post SCI (Figure 4A). DAPI nuclei staining indicated that extensive cell death was observed at day 1 post SCI (Figure 4A). We also noticed that b-actin+ cells with a hypertrophic morphology were found at day 1 post SCI in the white matter of the spinal cord distal to the LC(Figure 4B), whereas ramified
Figure 1 Proteome analysis of the lesion center of the injured spinal cord. (A). The injured spinal cords were collected at day 1 (acute) and day 14 (subacute) after SCI. The lesion center (LC) with the length of 4-5 mm was dissected from the injured spinal cord tissues, and subjected to protein extraction for 2-DE. (B). Representative silver stained 2-DE gels show protein spots in the LC of the spinal cord derived from acute and subacute-SCI rats. Protein samples (200μg) were loaded onto IPG strips (pH 3-10 Non-Linear) and then separated by a 10% SDS-PAGE gel. The gel was stained with silver stain and analyzed. Similar patterns of protein spots on the 2-DE were observed in six independent gels from three different sets of experiments. The spots on the gels were excised, trypsinized, and analyzed by MALDI-TOF-MS as described in Materials and Methods. Protein identification was obtained for 128 protein spots. There were 7 proteins which were biostatistically reduced in the LC at day 14. 12 proteins were found to be significantly upregulated in the LC at day 14 when compared to that detected at day 1 post SCI. Their protein identification and fold change in their expression levels were shown in Table 1 and 2.
b-actin+ cells were observed at day 7 and day 14 post SCI (Figure 4D, F). Through proteomic approach, we found that the regulators of inflammation and carboxy- peptidase inhibitor, galectin-3 (LEG3; spot 58,59) and latexin (LXN; spot 54), were increased in the LC at day 14 post SCI (Table 2). By Western blot analysis, an increase in LEG3, but not LXN, was found along the longer survival time points (Figure 3). Cathepsin D (CATD), one of lysosomal enzymes enriched in macro- phages, was also increased in the LC at day 14 post SCI
(Table 2 and Figure 3). Furthermore, immuofluores- cence indicated that Iba-1+microglia were accumulated in the proximal site to the LC (Figure 5A). Moreover, CD11b (Mac-1) or CD49f-positive macrophages were observed in the LC (Figure 5B, C) and the proximal area to the LC at day 14 post SCI (data not shown).
Alternatively, in vitro study using primary rat glial cul- tures also showed that the proinflammatory cytokines, TNF-a and IL-1b (T/I), did increase the expression of b-actin protein levels in primary microglia (Figure 4G).
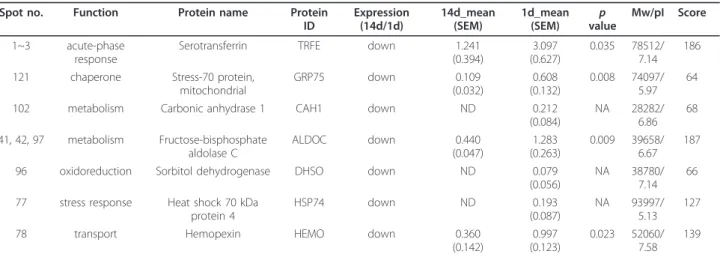
Table 1 List of proteins that were down-regulated in the lesion center at day 14 after SCI compared to 1 day after SCI
Spot no. Function Protein name Protein
ID
Expression (14d/1d)
14d_mean (SEM)
1d_mean
(SEM) p
value
Mw/pI Score
1~3 acute-phase response
Serotransferrin TRFE down 1.241
(0.394)
3.097 (0.627)
0.035 78512/
7.14 186
121 chaperone Stress-70 protein, mitochondrial
GRP75 down 0.109
(0.032)
0.608 (0.132)
0.008 74097/
5.97 64
102 metabolism Carbonic anhydrase 1 CAH1 down ND 0.212
(0.084)
NA 28282/
6.86 68
41, 42, 97 metabolism Fructose-bisphosphate aldolase C
ALDOC down 0.440
(0.047)
1.283 (0.263)
0.009 39658/
6.67 187
96 oxidoreduction Sorbitol dehydrogenase DHSO down ND 0.079
(0.056)
NA 38780/
7.14 66
77 stress response Heat shock 70 kDa protein 4
HSP74 down ND 0.193
(0.087)
NA 93997/
5.13 127
78 transport Hemopexin HEMO down 0.360
(0.142)
0.997 (0.123)
0.023 52060/
7.58 139 The proteins changed at least 1.5-fold were listed above. The proteins were downregulated with a p value < 0.05. NA, not applicable; ND, non-detectable.
Table 2 List of proteins that were up-regulated in the lesion center at day 14 after SCI compared to 1 day after SCI Spot
no.
Function Protein name Protein
ID
Expression (14d/1d)
14d_mean (SEM)
1d_mean
(SEM) p
value
Mw/pI Score
35 actin filament capping
Macrophage-capping protein, Actin regulatory protein CAP-G
CAPG up 0.239
(0.080)
0.022 (0.021)
0.050 39060/6.11 95
52 actin filament capping
F-actin-capping protein subunit beta CAPZB up 0.194 (0.041)
0.025 (0.025)
0.013 30952/5.69 67
110 acute inflammatory response
Haptoglobin HPT up 0.132
(0.028)
ND NA 39052/6.10 63
58,59 cell differentiation Galectin-3 LEG3 up 0.422
(0.091)
ND NA 27241/8.59 99
33 cytoskeleton Beta-actin ACTB up 4.016
(0.641)
1.630 (0.260)
0.017 42052/5.29 139
61 GTPase activation Rho GDP-dissociation inhibitor 1 GDIR1 up 0.486 (0.248)
ND NA 23450/5.12 106
60 metabolism Ubiquitin carboxyl-terminal hydrolase isozyme L1
UCHL1 up 1.106
(0.179)
0.393 (0.096)
0.014 25165/5.14 83
22 microtubule Tubulin beta-5 chain TBB5 up 0.763
(0.249)
ND NA 50095/4.78 83
69 oxidoreduction Flavin reductase BLVRB up 0.078
(0.025)
ND NA 22297/6.49 93
66 oxidoreduction Heat shock protein beta-1 HSPB1 up 0.201
(0.024)
0.025 (0.002)
0.010 22936/6.12 102
74 oxidoreduction Superoxide dismutase [Mn], mitochondrial
SODM up 0.300
(0.045)
0.105 (0.029)
0.020 24887/8.96 64
54 protease inhibitor Latexin, Endogenous carboxypeptidase inhibitor
LXN up 0.118
(0.020)
ND NA 25735/5.77 68
The proteins changed at least 1.5-fold were listed above. The proteins were upregulated with a p value < 0.05. NA, not applicable; ND, non-detectable.
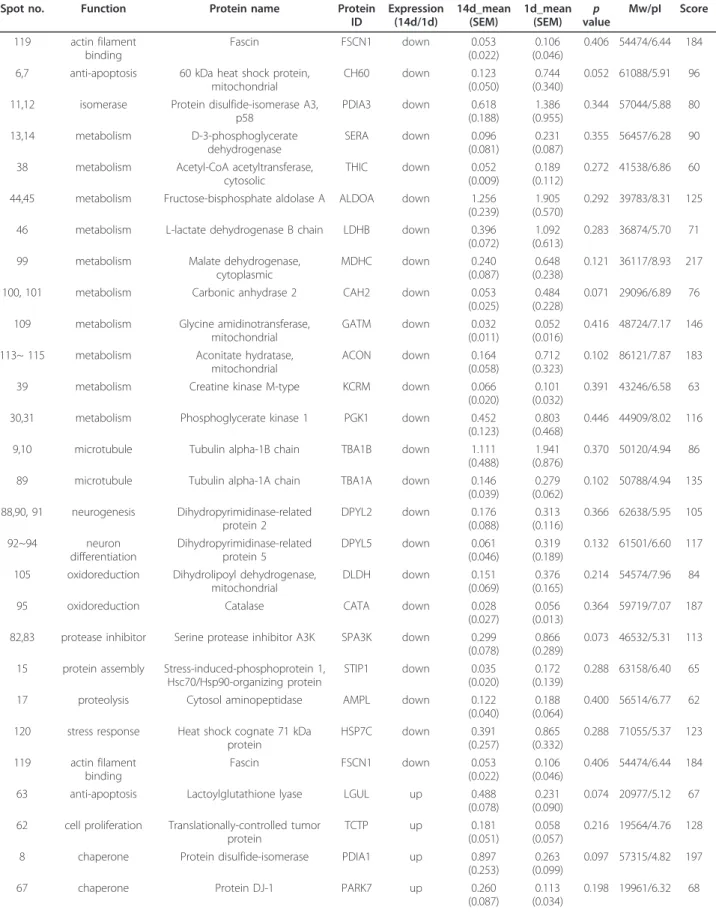
Table 3 List of proteins that showed a decreased (down) or an increased (up) trend (p > 0.05) in the lesion center of the injured spinal cord from the subacute (day 14) SCI group when compared to that detected in the acute (day 1) SCI group
Spot no. Function Protein name Protein
ID
Expression (14d/1d)
14d_mean (SEM)
1d_mean
(SEM) p
value
Mw/pI Score
119 actin filament binding
Fascin FSCN1 down 0.053
(0.022)
0.106 (0.046)
0.406 54474/6.44 184
6,7 anti-apoptosis 60 kDa heat shock protein, mitochondrial
CH60 down 0.123
(0.050)
0.744 (0.340)
0.052 61088/5.91 96
11,12 isomerase Protein disulfide-isomerase A3, p58
PDIA3 down 0.618
(0.188)
1.386 (0.955)
0.344 57044/5.88 80
13,14 metabolism D-3-phosphoglycerate
dehydrogenase
SERA down 0.096
(0.081)
0.231 (0.087)
0.355 56457/6.28 90
38 metabolism Acetyl-CoA acetyltransferase, cytosolic
THIC down 0.052
(0.009)
0.189 (0.112)
0.272 41538/6.86 60
44,45 metabolism Fructose-bisphosphate aldolase A ALDOA down 1.256 (0.239)
1.905 (0.570)
0.292 39783/8.31 125
46 metabolism L-lactate dehydrogenase B chain LDHB down 0.396
(0.072)
1.092 (0.613)
0.283 36874/5.70 71
99 metabolism Malate dehydrogenase,
cytoplasmic
MDHC down 0.240
(0.087)
0.648 (0.238)
0.121 36117/8.93 217
100, 101 metabolism Carbonic anhydrase 2 CAH2 down 0.053
(0.025)
0.484 (0.228)
0.071 29096/6.89 76
109 metabolism Glycine amidinotransferase, mitochondrial
GATM down 0.032
(0.011)
0.052 (0.016)
0.416 48724/7.17 146
113~ 115 metabolism Aconitate hydratase, mitochondrial
ACON down 0.164
(0.058)
0.712 (0.323)
0.102 86121/7.87 183
39 metabolism Creatine kinase M-type KCRM down 0.066
(0.020)
0.101 (0.032)
0.391 43246/6.58 63
30,31 metabolism Phosphoglycerate kinase 1 PGK1 down 0.452
(0.123)
0.803 (0.468)
0.446 44909/8.02 116
9,10 microtubule Tubulin alpha-1B chain TBA1B down 1.111
(0.488)
1.941 (0.876)
0.370 50120/4.94 86
89 microtubule Tubulin alpha-1A chain TBA1A down 0.146
(0.039)
0.279 (0.062)
0.102 50788/4.94 135
88,90, 91 neurogenesis Dihydropyrimidinase-related protein 2
DPYL2 down 0.176
(0.088)
0.313 (0.116)
0.366 62638/5.95 105
92~94 neuron
differentiation
Dihydropyrimidinase-related protein 5
DPYL5 down 0.061
(0.046)
0.319 (0.189)
0.132 61501/6.60 117
105 oxidoreduction Dihydrolipoyl dehydrogenase, mitochondrial
DLDH down 0.151
(0.069)
0.376 (0.165)
0.214 54574/7.96 84
95 oxidoreduction Catalase CATA down 0.028
(0.027)
0.056 (0.013)
0.364 59719/7.07 187
82,83 protease inhibitor Serine protease inhibitor A3K SPA3K down 0.299 (0.078)
0.866 (0.289)
0.073 46532/5.31 113
15 protein assembly Stress-induced-phosphoprotein 1, Hsc70/Hsp90-organizing protein
STIP1 down 0.035
(0.020)
0.172 (0.139)
0.288 63158/6.40 65
17 proteolysis Cytosol aminopeptidase AMPL down 0.122
(0.040)
0.188 (0.064)
0.400 56514/6.77 62
120 stress response Heat shock cognate 71 kDa protein
HSP7C down 0.391
(0.257)
0.865 (0.332)
0.288 71055/5.37 123
119 actin filament binding
Fascin FSCN1 down 0.053
(0.022)
0.106 (0.046)
0.406 54474/6.44 184
63 anti-apoptosis Lactoylglutathione lyase LGUL up 0.488
(0.078)
0.231 (0.090)
0.074 20977/5.12 67
62 cell proliferation Translationally-controlled tumor protein
TCTP up 0.181
(0.051)
0.058 (0.057)
0.216 19564/4.76 128
8 chaperone Protein disulfide-isomerase PDIA1 up 0.897
(0.253)
0.263 (0.099)
0.097 57315/4.82 197
67 chaperone Protein DJ-1 PARK7 up 0.260
(0.087)
0.113 (0.034)
0.198 19961/6.32 68
However, only a slight change was detected in the expression ofb-actin protein levels in primary microglia with or without T/I treatment. Thus, theb-actin+ cells detected in the LC could be mainly inflammatory cells either derived from resident microglia or infiltrating monocytes/leukocytes from the periphery blood, and they could produce proinflammatory cytokines to increase theb-actin protein levels in glial cells (such as astrocytes) in the injury penumbra.
Delayed treatment with chondroitinase ABC in hindlimb locomotion recovery after SCI
We noticed no change in the levels of astrocytic pro- teins, GS (spot 36 and 37) and GFAP (spot 87) in the LC at day 1 and 14 post SCI (Table 4). Immunofluores- cence indicated that GFAP+ cell fragments were observed at the lesion site at day 1 post SCI (Figure 6A), while GFAP+ hypertrophic astrocytes were detected in the injury penumbra at day 7 and 14 post SCI. These GFAP+ cells were also colocalized tob-actin
+ cells (Figure 6A, insets). In addition, we observed that few GFAP+ astrocytic processes invaded to the LC (Figure 6A) at day 14 post SCI. The results from immu- nofluorescence explain that comparable GFAP detected
by proteome analysis in the LC at day 14 was derived from invading astrocytes, which is the pathophysiologi- cal event proposed in SCI [1]. Given the fact that glial scar is mainly formed by chondroitin sulfate proteogly- cans (CSPGs) primarily produced by reactive astrocytes, the production of CSPGs at the different spinal cord tis- sue blocks was examined at day 31 after SCI. As shown in Figure 6B, there were differential levels of CSPGs detected in the spinal cord tissues rostral and caudal to the lesion center. However, CSPGs approximately corre- sponding to 40- kDa were only present in the LC. In addition, the 40-kDa CSPGs were initially detected in the LC at day 3, continued to be seen at day 7 and 14 post SCI (Figure 6B). Based on the spatial and tem- poral levels of 40-kDa CSPGs in the injured spinal cord, injection into the injured spinal cord with chABC at the different time points post SCI was performed. The hin- dlimb locomotor function was assessed every 2-3 days up to 31 days using BBB locomotor rating scale.
Through the evaluation of behavior analysis, we found that administration of chABC right after SCI or at day 3 post SCI enhanced the hindlimb locomotion in rats with SCI (Figure 7A). However, at day 31 after SCI, BBB scores in rats receiving delayed treatment with chABC Table 3 List of proteins that showed a decreased (down) or an increased (up) trend (p > 0.05) in the lesion center of the injured spinal cord from the subacute (day 14) SCI group when compared to that detected in the acute (day 1) SCI group (Continued)
124 chaperone T-complex protein 1 subunit beta TCPB up 0.078
(0.015)
0.031 (0.030)
0.190 57422/6.01 76
21 metabolism Elongation factor 1-alpha 1 EF1A1 up 0.631
(0.273)
0.160 (0.055)
0.142 50424/9.10 77
29 metabolism Isocitrate dehydrogenase [NADP] IDHC up 0.113
(0.111)
0.056 (0.044)
0.679 47047/6.53 108
50 metabolism L-lactate dehydrogenase A chain LDHA up 0.209
(0.045)
0.080 (0.028)
0.058 36712/8.45 64
53 metabolism Dimethylarginine
dimethylaminohydrolase 2
DDAH2 up 0.118
(0.044)
0.015 (0.014)
0.158 30011/5.66 116
73,75 oxidoreduction Peroxiredoxin-1 PRDX1 up 0.684
(0.378)
0.076 (0.036)
0.158 22323/8.27 91
65 oxidoreduction Peroxiredoxin-6 PRDX6 up 0.199
(0.104)
0.074 (0.023)
0.359 24860/5.64 74
79 protein assembly 78 kDa glucose-regulated protein GRP78 up 0.323 (0.116)
0.136 (0.045)
0.245 72473/5.07 285
51 proteolysis Cathepsin B CATB up 0.245
(0.081)
0.159 (0,158)
0.619 38358/5.36 72
106, 107 proteolysis Cathepsin D CATD up 0.840
(0.373)
0.036 (0.026)
0.075 45165/6.66 132
64 signal transduction Phosphatidylethanolamine- binding protein 1
PEBP1 up 1.539
(0.440)
0.910 (0.214)
0.277 20902/5.48 82
72 signal transduction GTP-binding nuclear protein Ran RAN up 0.184 (0.090)
0.116 (0.055)
0.606 46532/5.31 113
57 stress response Endoplasmic reticulum protein ERp29
ERP29 up 0.118
(0.091)
0.029 (0.029)
0.513 28614/6.23 63
56 ubiquitin-dependent protein catabolism
Proteasome subunit alpha type-1 PSA1 up 0.177 (0.038)
0.091 (0.027)
0.162 29784/6.15 64
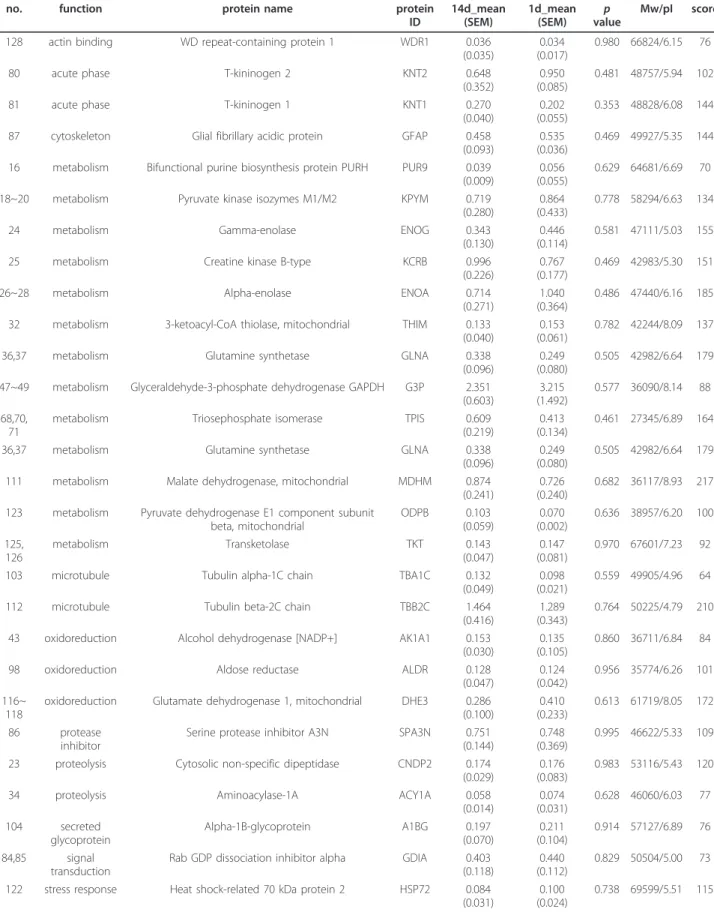
Table 4 List of proteins that were changed less than 1.5-fold in the lesion center of the injured spinal cord from the subacute (day 14) SCI group when compared to that detected in the acute (day 1) SCI group
no. function protein name protein
ID
14d_mean (SEM)
1d_mean
(SEM) p
value
Mw/pI score
128 actin binding WD repeat-containing protein 1 WDR1 0.036
(0.035)
0.034 (0.017)
0.980 66824/6.15 76
80 acute phase T-kininogen 2 KNT2 0.648
(0.352)
0.950 (0.085)
0.481 48757/5.94 102
81 acute phase T-kininogen 1 KNT1 0.270
(0.040)
0.202 (0.055)
0.353 48828/6.08 144
87 cytoskeleton Glial fibrillary acidic protein GFAP 0.458
(0.093)
0.535 (0.036)
0.469 49927/5.35 144
16 metabolism Bifunctional purine biosynthesis protein PURH PUR9 0.039 (0.009)
0.056 (0.055)
0.629 64681/6.69 70
18~20 metabolism Pyruvate kinase isozymes M1/M2 KPYM 0.719
(0.280)
0.864 (0.433)
0.778 58294/6.63 134
24 metabolism Gamma-enolase ENOG 0.343
(0.130)
0.446 (0.114)
0.581 47111/5.03 155
25 metabolism Creatine kinase B-type KCRB 0.996
(0.226)
0.767 (0.177)
0.469 42983/5.30 151
26~28 metabolism Alpha-enolase ENOA 0.714
(0.271)
1.040 (0.364)
0.486 47440/6.16 185
32 metabolism 3-ketoacyl-CoA thiolase, mitochondrial THIM 0.133
(0.040)
0.153 (0.061)
0.782 42244/8.09 137
36,37 metabolism Glutamine synthetase GLNA 0.338
(0.096)
0.249 (0.080)
0.505 42982/6.64 179
47~49 metabolism Glyceraldehyde-3-phosphate dehydrogenase GAPDH G3P 2.351 (0.603)
3.215 (1.492)
0.577 36090/8.14 88
68,70, 71
metabolism Triosephosphate isomerase TPIS 0.609
(0.219)
0.413 (0.134)
0.461 27345/6.89 164
36,37 metabolism Glutamine synthetase GLNA 0.338
(0.096)
0.249 (0.080)
0.505 42982/6.64 179
111 metabolism Malate dehydrogenase, mitochondrial MDHM 0.874
(0.241)
0.726 (0.240)
0.682 36117/8.93 217
123 metabolism Pyruvate dehydrogenase E1 component subunit beta, mitochondrial
ODPB 0.103
(0.059)
0.070 (0.002)
0.636 38957/6.20 100
125, 126
metabolism Transketolase TKT 0.143
(0.047)
0.147 (0.081)
0.970 67601/7.23 92
103 microtubule Tubulin alpha-1C chain TBA1C 0.132
(0.049)
0.098 (0.021)
0.559 49905/4.96 64
112 microtubule Tubulin beta-2C chain TBB2C 1.464
(0.416)
1.289 (0.343)
0.764 50225/4.79 210
43 oxidoreduction Alcohol dehydrogenase [NADP+] AK1A1 0.153
(0.030)
0.135 (0.105)
0.860 36711/6.84 84
98 oxidoreduction Aldose reductase ALDR 0.128
(0.047)
0.124 (0.042)
0.956 35774/6.26 101
116~
118
oxidoreduction Glutamate dehydrogenase 1, mitochondrial DHE3 0.286 (0.100)
0.410 (0.233)
0.613 61719/8.05 172
86 protease
inhibitor
Serine protease inhibitor A3N SPA3N 0.751 (0.144)
0.748 (0.369)
0.995 46622/5.33 109
23 proteolysis Cytosolic non-specific dipeptidase CNDP2 0.174
(0.029)
0.176 (0.083)
0.983 53116/5.43 120
34 proteolysis Aminoacylase-1A ACY1A 0.058
(0.014)
0.074 (0.031)
0.628 46060/6.03 77
104 secreted
glycoprotein
Alpha-1B-glycoprotein A1BG 0.197
(0.070)
0.211 (0.104)
0.914 57127/6.89 76
84,85 signal transduction
Rab GDP dissociation inhibitor alpha GDIA 0.403 (0.118)
0.440 (0.112)
0.829 50504/5.00 73
122 stress response Heat shock-related 70 kDa protein 2 HSP72 0.084 (0.031)
0.100 (0.024)
0.738 69599/5.51 115
were higher than that observed in animals with acute treatment with chABC. Immunofluorescence showed that there were numerous neuronal fiber bundles with GAP-43-positive staining in the injured spinal cord receiving chABC immediately after SCI or by delayed treatment with chABC (Figure 7B, arrows), whereas only numerous fine fragmented neuronal fibers remained in the injured spinal cord without treatment (Figure 7B, arrowheads). In addition, when compared to GAP- 43 immunostaining on the LC with acute chABC treat- ment, there was more elongated GAP-43-positivie neu- ronal fiber bundles present in the injured center of the spinal cord with delayed treatment by chABC (Figure 7B).
Discussion
Previous studies using genomics or proteomics approach have focused on changes in gene expression and protein production in the injured spinal cord within a week after SCI [2,15,16,21]. To comprehend pathophysiologi- cal changes at the longer survival time points after SCI, we examined protein expression changes in the LC at day 14 post severe SCI on spinal T9/10 segment. The genomic study indicates that inflammation-related tran- scription factors and cytokines were upregulated at the acute phase after SCI [2]. In the proteome-based study, Prx2, HspA1B, cytoskeleton reorganization-related pro- teins (such as neurofilament light chain, annexin 5, tubulin beta, peripherin, GFAP, septin 7) were increased during the first week after SCI when compared to sham-operated control [15,16]. Here, we demonstrate that oxidoreduction-related enzymes (Prx1, Prx6, MnSOD and CAT) and Hsp60 were reduced at day 14 post SCI, whileb-actin and actin-capping proteins (CAPG and CAPBZ) were increased. Similar to their expression levels found in the contused spinal cord within one week post SCI [16], Hsp27 and LEG3 were also increased in the LC at day 14.
An increase in the production of Prx1, Prx6 and MnSOD in the LC at day 14 was found by the proteo- mic analysis when compared to that at day 1 post SCI.
However, through western blot analysis, the levels of the three proteins were significantly reduced in the LC at day 14. The apparent differences between proteome data and western blot findings could be attributed to the following issues in the proteomic analysis. First, the protein samples isolated from tissues at day 1 and day 14 were electrophoresized in the separate gels.
Thus, the variation could occur during sliver staining process, although the intensity of a protein spot in 2D gel was normalized by the sum of the intensity of all the spots present in each gel. Second, it is known that there is the difficulty to obtain similar resolution in the alkaline ranges of IPGs [25,26]. As shown in Figure 1B, the poor focusing for the three protein spots in 2DE could gain inaccurate quantification of their spot intensity. Third, the three proteins could be modified in the LC under extensive oxidative stress at day 1 post SCI, since Prx1/6 and MnSOD have been known to be modified by phosporylation, oxidation, or nitration, respectively [27-31]. The protein modifica- tion would change their pI values and affect their mobility in the IPGs. Although the phosphorylated/oxi- dized form of Prx1/6 and the nitrated form of MnSOD in 2DE remain to be identified, the intensities of the three protein spots shown in 2DE would not be suffi- cient to indicate the exact production of the three proteins.
The upregulation of Hsp27 gene expression and pro- tein production at 24 h post SCI have been reported [21,32]. Through proteomic and western blot assays, we also found that Hsp27 was exclusively increased at day 14 post severe SCI (Table 2; Figure 2), indicating the involvement of Hsp27 in prolonged inflammation occur- ring in the late phase of SCI. Nevertheless, the exact role of Hsp27 in SCI-induced neuropathogenesis remains to be explored. On the other hand, western blotting indicated that the decline in the levels of MnSOD, CAT, Prx1 and Prx6 was observed at day 14 when compared to than those observed in the sham control and injured tissues collected at 1 day post SCI.
The observations demonstrate that the production of Table 4 List of proteins that were changed less than 1.5-fold in the lesion center of the injured spinal cord from the subacute (day 14) SCI group when compared to that detected in the acute (day 1) SCI group (Continued)
4,5 transport Serum albumin ALBU 3.629
(1.939)
4.722 (1.882)
0.722 70682/6.09 306
40 transport Aspartate aminotransferase AATM 0.246
(0.070)
0.165 (0.041)
0.387 47683/9.13 64
55 transport 3-mercaptopyruvate sulfurtransferase THTM 0.053
(0.014)
0.047 (0.046)
0.893 33205/5.88 75
108 transport Clathrin light chain B CLCB 0.310
(0.090)
0.324 (0.156)
0.953 25216/4.65 63
127 transport V-type proton ATPase catalytic subunit A VATA 0.056 (0.028)
0.057 (0.027)
0.982 68283/5.42 77
oxidoreduction-related enzymes was downregulated in the LC in the subacute phase post SCI. The reduction in these oxidoreduction-related proteins might be due to the extensive cell death occurring in the subacute phase. However, we could not rule out the possibility that the decline in the expression of oxidoreduction- related proteins described as above might lead to neural cell death exclusively occurred in the LC in the subacute phase.
LEG3, the regulator of inflammation, has been found to be induced in the contused spinal cord at 3 and 7 day after SCI, and in cultured microglia upon stimulation [33].
The molecule is considered to be involved in the phago- cytosis of degenerated myelin or other tissue debris in the injured CNS [34]. From our proteomic profile and western blot analysis, the expression of LEG3 was exclusively increased in the injured spinal cord at day 14 post SCI, implying that active phagocytosis takes place in the LC over two weeks post SCI. Under harmful conditions (such as oxidative stress and inflammation), the ubiquitin/pro- teasome pathway is required for removal of abnormal pro- teins in the cells to maintain neuronal homeostasis [35]. In addition, the upregulation of lysosomal cysteine proteases (such as cathepsins) are associated with various neurologi- cal disorders [36]. For instance, an increase in CATD has been shown in several neuropathological disorders, includ- ing amyotrophic lateral sclerosis [37], and autoimmune encephalomyelitis [38]. Recent study has also shown that CATD was found increased in the subacute phase after clip spinal cord compression injury [39]. The immunohis- tochemical observations suggest that CATD could play an
Figure 3 Expression of structure proteins and inflammatory regulator proteins in the lesion center. Western blot analysis showed time course change in the expression levels ofb-actin, CAPG, CAPZB, CATD, galectin-3 (LEG3) and LXN. The proteins extracted from the LC of the injured spinal cords at the different survival time points (day 1 and 14) after SCI or from sham control.
The same blot was stripped and reprobed with ant-ERK44/42 antibody as internal loading control. Relative intensity of the indicated protein level bands normalized to ERK 44 was measured.
Data are presented as means ± SEM from three separate experiments. *p < 0.05 versus sham control.
Figure 2 Expression of stress proteins and antioxidant enzymes in the lesion center. (A) Western blot analysis shows time course change in the expression levels of MnSOD, Prx1, Prx6, Hsp27, catalase (CAT), Hsp60, DPYL2 and DPYL5. The proteins extracted from the LC of the injured spinal cords at the different survival time points (day 1 and 14) after SCI or sham control. The same blot was stripped and reprobed with anti-ERK44/42 antibody as internal loading control. Relative intensity of the indicated protein level bands normalized to ERK 44 was measured. Data are presented as means ± SEM from three separate experiments. *p <
0.05 versus sham control. (B). The spinal cord was removed at day 8 post SCI from the rats without or receiving control Ad, rAd-SOD, rAd-calatase (CAT), rAd-GPx gene therapy. Horizontal spin cord tissue sections were subjected to in situ apoptosis analysis. Data represent the mean ± SEM. *p < 0.05 versus the control group without Ad injection.#p < 0.05 versus the group treated with control Ad.
Figure 4 Immunofluorescence forb-actin expression in injured spinal cord tissue sections. The injured spinal cord tissue sections were collected at day 1 (A,B), day 7(C,D), and day 14(E,F) after SCI, and then subjected to immunofluorescence forb-actin (red). The tissues were also subjected for nuclear staining using DAPI (blue). In general, cell debris withb-actin immunoreactivity (open arrowheads) and fragmented/
damaged nuclei (inset in A) were exclusively detected in the lesion center (LC) at 1 day post SCI. However, numerousb-actin+cells (arrows) were accumulated in the LC at day 7 and 14 post SCI. Noted thatb-actin+cells (open arrows) were detected in the distal area (white matter) to the LC at day 1, 7 and 14 post SCI. Scale bar in A-F, 50μm. (G) Primary astrocytes and microglia prepared from neonatal rat cortical tissues were treated for 24 hours with proinflammatory factor, TNF-a and IL-1b (T/I) at the doses of 20 ng/ml. The total proteins were extracted, separated by SDS-PAGE, and analyzed by western blotting with anti-b-actin, anti-GFAP.