Research Memorandum 06/2021 13 August 2021
EFFECT OF CLIMATE-RELATED RISK ON THE PRICING OF BANK LOANS: EVIDENCE FROM SYNDICATED LOAN MARKETS IN ASIA PACIFIC
Key points:
Climate change is being increasingly recognised as a major emerging risk to financial stability. For instance, a disorderly transition to a low-carbon economy could have a significant effect on the performance, future cash flows and thus the credit risk of banks’ corporate borrowers. Therefore, it is important to assess whether, and to what extent, banks have taken the climate-related risks, particularly the transition risk, into their loan pricing considerations.
Based on a sample of syndicated loans originated in the Asia Pacific region, our analysis shows that banks in the region have started to price-in climate transition risks for loans to emissions-intensive sectors since the Paris Agreement, probably reflecting increased global awareness of climate risks.
On average, banks are estimated to charge a higher lending spread to a high- emitting firm (i.e. “brown” firm) by 23 basis points (bps) as compared to that of a non-brown counterpart. This is economically significant as the transition risk premium is equivalent to a 14% rise in the average lending spread.
In addition, the environmental attitude of banks is found to be one key factor in determining the extent of transition risk premium in the loan pricing. Our estimation shows that a “green” bank would charge an additional loan spread of around 9 bps compared with other banks, on the same brown firm in the post-Paris Agreement period.
Overall, these findings provide supportive evidence that banks in the region have started to incorporate climate risk considerations into their existing risk management framework. Nevertheless, managing climate risks will remain a key challenge for banks due to the different nature from the
traditional risk types and data gaps. Banks should therefore keep abreast of the latest developments in climate risk management practices to adjust their own risk management approach.
Prepared by: Kelvin Ho and Andrew Wong*
Market Research Division, Research Department Hong Kong Monetary Authority
The views and analysis expressed in this paper are those of the authors, and do not necessarily represent the views of the Hong Kong Monetary Authority.
* The authors would like to thank Lillian Cheung and Eric Wong for their helpful comments and suggestions. A technical version of this paper can be found in the HKIMR Working Paper series (forthcoming).
- 2 -
I. INTRODUCTION
Climate change has been receiving increasing attention in recent years. Policymakers worldwide have shown strong commitment to tackling climate change. Most notably, the United Nations Framework Convention on Climate Change (UNFCCC) reached an agreement to adopt a legally binding international treaty on climate change at the 21st Conference of the Parties in Paris on 12 December 2015 (i.e. the Paris Agreement). The objective is to limit global warming to well below two degrees Celsius, preferably to 1.5 degrees.
To achieve this long-term temperature goal, participating countries agreed on the need to reach a global peak of greenhouse gas (GHG) emissions as soon as possible and, concurrently, working towards emissions reductions. The ambitious task of transitioning towards a low-carbon economy will likely have large financial implications for a wide range of industries, as their future business operations could be significantly affected by changes in climate policy and climate-related technology.
The transition towards a low-carbon economy could also have strong implications for banks. For example, carbon pricing may be adopted by governments to incentivise corporates to reduce GHG emissions. The future cash flows and valuation of banks’ corporate borrowers, particularly for those from the largest-emitting sectors could therefore fall significantly, which could in turn affect the credit risks for banks’ loan portfolios. Therefore, it is important to assess how far banks have taken the associated climate transition risks1, into their lending considerations.
This issue is also highly relevant to policymakers in the Asia Pacific region (APAC). From the financial stability perspective, given APAC hosts a number of the largest GHG emissions countries in the world (Chart 1), the potential adverse impact of climate transition risks on these banks could be significant as they are among the key funding providers for corporates in the region. On the other hand, from the perspective of promoting sustainable finance, a better understanding of this issue may help inform policymakers about potential action to foster more green financing by the banking sector.
However, empirical evidence remains rather limited, probably due
1 Transition risk is a financial risk which can result from the process of adjustment towards a lower- carbon economy prompted by, for example, changes in climate policy, technological changes or a change in market sentiment. Throughout the paper, transition risk and climate transition risk are used interchangeably.
to the fact that granular information containing both firms’ GHG emission data and their loan terms with banks are generally scarce. While there are a few recent studies2 that address similar questions, they focus mainly on the US or global markets. By contrast, studies on APAC remain scant, if any. To the best of our knowledge, this is the first empirical study that focuses on the effect of climate transition risk on banks’ loan pricing in APAC.
Chart 1: Shares of the World’s GHG emissions in 2019 by geographical regions
Notes:
1. GHG emissions are defined as the annual production-based emissions of carbon dioxide (CO₂) by the continental regions in 2019, excluding the emissions from international transportation activities.
2. 13 APAC economies sampled included Australia, China, Hong Kong, Indonesia, Japan, Malaysia, New Zealand, Singapore, South Korea, Taiwan, Thailand, the Philippines and Vietnam.
Source: Global Carbon Project.
Against this background, this analysis sheds light on the issue by assessing whether banks in APAC have taken the associated transition risk into their loan pricing based on a sample of syndicated loans originated in the Asia Pacific market. Specifically, we aim to examine whether, and to what extent, banks price their corporate loans differently for corporates’ GHG emissions, after controlling for loan pricing determinants. In principle, highly emitting firms (i.e. “brown” firms) would be more exposed to the transition risk suggesting that their future cash flows and hence their debt repayment ability could be adversely affected in the event of a disorderly transition towards a low-carbon economy. If such a risk is considered by banks at the time of loan origination, a higher loan spread should be charged to compensate for the potential credit costs stemming
2 For instance, Kleimeier and Viehs, 2018; Degryse et al., 2020; Delis et al., 2021; Ehlers et al., 2021.
- 4 -
from the transition risk.
In addition, our analysis further examines whether banks’ attitude towards green initiatives matters in determining the extent of climate transition risk in loan pricing. Intuitively, a “green” bank should make a greater effort to internalise the potential negative impact on their operations arising from climate- related risk by charging a higher loan spread to a “brown” borrower relative to non-green banks. Therefore, we conjecture that green banks would tend to charge a higher loan spread to “brown” firms by a greater extent than other banks.
The rest of this analysis is organised as follows. Section II describes the data sources used in the analysis and also highlights some key observations from the data. Section III presents the empirical specifications and discusses the results. Section IV concludes.
II. DATA
To study the loan pricing of climate transition risk, this study compiles a novel dataset by combining multiple data sources to construct a sample of syndicated loans originated in the Asia Pacific market3, in which the corresponding financial and environmental characteristics of the borrowers and lenders are being matched. The data sources are briefly described below. A descriptive statistics table of the final sample of loans and the description of the variables used in the estimations are provided in Tables A1 and A2 of the Appendix respectively.
a. Syndicated loan and balance sheet data
Our analysis covers a sample of syndicated loans in major Asia Pacific markets (i.e. where the majority of funds were sourced to finance the loan) over the period 2010 to March 2021. The loan-level information was obtained from Thomson Reuters LPC DealScan database. Following the literature, our dependent variable is the loan spread4 which is measured by the
“All-in-drawn spread” in basis points (bps). In addition, the financial strength
3 13 APAC economies are included, namely Australia, China, Hong Kong, Indonesia, Japan, Malaysia, New Zealand, Singapore, South Korea, Taiwan, Thailand, the Philippines and Vietnam.
4 A broad range of loan reference rates, which are usually interbank rates employed as benchmarks for syndicated loans in the region, are considered in the sample. For details, please see the HKIMR working paper version.
and other characteristics of borrowers and lenders5 are obtained from S&P Capital IQ, and further merged with the syndicated loan data.
b. GHG emissions data
We gauge firms’ exposure to the transition risk by their GHG emissions. The GHG emission data of corporates are obtained from S&P Trucost. S&P Trucost provides annual corporate GHG emissions data between 2005 to 2019 for more than 17,000 companies globally (covering more than 90%
of global market capitalisations according to the S&P Global). Consistent with standards set out by the GHG Protocol6, three types of GHG emissions data of a corporate are available from S&P Trucost – namely scopes 1 to 3 emissions.
Scope 1 emissions cover direct emissions generated during fuel combustion activities by a firm, while scope 2 emissions cover indirect emissions relating to the purchase of energy. Scope 3 emissions include all other indirect emissions that occur in a company’s value chain. As the scope 3 emissions of firms are prone to a double-counting issue, and in line with the existing practice in other research studies, our analysis thus disregards firms’ scope 3 emissions.
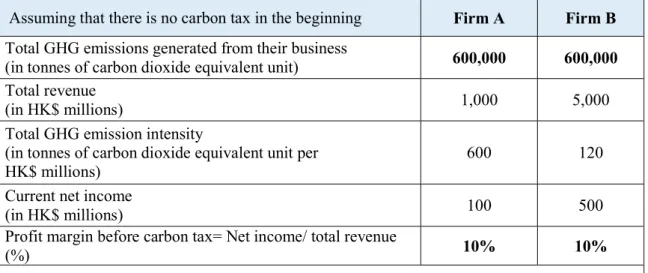
It is noteworthy that the absolute amount of GHG emissions is highly correlated with a firm’s size. To ensure comparability of GHG emissions across firms, the level of GHG emissions of a firm is scaled by its revenue (also referred to as GHG emission intensity). In addition, measuring a firm’s emissions relative to its revenue also helps capture the severity of the potential financial impact from a tightening of carbon pricing policy, such as an imposition of a carbon tax. For instance, among two firms which have the same amount of total emissions, the firm with a higher emission intensity will find the financial impact of a carbon tax more material compared to the other firm with a low emission intensity. This can be illustrated in a hypothetical example in Table 1 below.
To put this into context, we assume that a hypothetical carbon tax of HK$200 per each ton of emissions would be imposed on the two firms with the same level of emissions and profit margin, but with different emission intensity (see upper panel of Table 1). As shown in the lower panel of the table, the carbon tax would trigger a material additional compliance cost for Firm A given its high level of emission intensity (i.e. 600 tons per HK$ million),
5 We consider the lead arrangers to be the key lenders only throughout this analysis as they are liable to participant banks for the pricing of all relevant risks and effective screening and monitoring of borrowing firms, lead banks have strong incentives to price loans accurately (Delis et al., 2021).
6 The GHG Protocol is considered to be the most widely recognised international accounting tool for the measurement of GHG emissions.
- 6 -
resulting in a loss-making outcome. By contrast, Firm B with a lower emission intensity level would still remain profitable after the imposition of the carbon tax. This example indicates that the emission intensity of a firm, as opposed to its GHG emissions amount, would be a more useful indicator when assessing the potential transition risk to a firm.
Table 1: An illustrative example of the financial impacts of carbon tax on non-financial firms
Assuming that there is no carbon tax in the beginning Firm A Firm B Total GHG emissions generated from their business 600,000 600,000 (in tonnes of carbon dioxide equivalent unit)
Total revenue 1,000 5,000
(in HK$ millions)
Total GHG emission intensity
(in tonnes of carbon dioxide equivalent unit per 600 120
HK$ millions) Current net income
100 500
(in HK$ millions)
Profit margin before carbon tax= Net income/ total revenue
10% 10%
(%)
Assuming that a new carbon tax of HK$200 per each ton of GHG emissions would be applied instantly on all corporate emissions, and both firms would stick to their current business models given the insufficient time to adjust business strategy.
Additional compliance cost paid by the firm due to the new
120 120
carbon tax (in HK$ millions)
Net income after adjusting for the costs in carbon tax
-20 380
(in HK$ millions)
New profit margin after adjustment (%) -2% 8%
Note: The example is for illustrative purposes only. It does not take into account that implementing a new tax policy will usually take a lengthy time in consultation, drafting and finally legislation.
Therefore, in principle, firms could proactively adjust their business models to mitigate the adverse impacts from the imposition of a carbon taxation.
It is also noteworthy that the level of emission intensity generally varies across sectors. Chart 2 presents the average emission intensity of firms across economic sectors by the Global Industry Classification Standards (GICS).
As shown, mainly reflecting the nature of their business activities, “utilities”,
“materials” and “energy” sectors are the largest emitting sectors (denoted as emissions-intensive sectors hereafter). This observation, together with the above hypothetical example, leads us to investigate whether there could be a difference in the loan pricing of the transition risk between borrowers from the emissions- intensive sectors and those from other sectors, as the transition risk for the former may be much higher than the latter.
Chart 2: Average Scope 1 & 2 carbon emission intensity across economic sectors
0 500 1000 1500 2000 2500 3000 3500 4000
Tonnes of emission per US$ million revenue
Utilities
Materials Energy
2009 2010 2011 2012 2013 2014 2015 2016 2017 2018 2019
Note: Figures are calculated as the simple average of firms’ scope 1 & 2 carbon emission intensity (measured by tons of CO2e to revenues in US dollar millions) by GICS economic sectors. Other sectors include communication services, consumer discretionary, consumer staples, financials, health care, industrials, information technology, and real estates.
Source: Staff calculations based on data from S&P Trucost.
c. Overview of the final sample
By combining all relevant data from different sources described above and removing those loans with missing data, our final sample covers 2,842 loans for estimation which spans over 704 unique borrowing firms and 157 unique banking corporations. As seen in Chart 3, lending to borrowers from emissions-intensive sectors accounted for a tangible share (21%) of the total amount of sampled syndicated loans over the sample period, supporting the view that banks’ exposure to climate transition risk through their loan portfolio is indeed material and should not be ignored.
- 8 -
Chart 3: Distribution of sampled loans by sectors
8%
8%
5%
17%
17%
16%
10%
8%
7% 4%
Emissions-intensive sectors
Materials Energy Utilities
Industrials Real Estate Communication Services
Consumer Discretionary Information Technology Consumer Staples Health Care
Source: Staff calculation based on data obtained from S&P Capital IQ and S&P Trucost.
Regarding the market location in which the loans were syndicated, the left panel in Chart 4 displays the share of loans to all sectors by market of syndication, based on our loan sample. Largely reflecting the role of Hong Kong’s banking sector as a regional funding hub, a significant share of the syndicated loans for all industries is originated in Hong Kong. Japan and Australia also constitute a sizable share of the APAC syndicated loans market, given the prominent role of the banking sector in these economies.7 Among the loans syndicated to the emissions-intensive sectors, they were mostly syndicated in Australia, Hong Kong and Taiwan (right panel in Chart 4).
7 The relatively small share for South Korea in our loan sample is mainly driven by data quality issues.
Given loan pricing information must be presented for the quantitative analysis, we inevitably have to drop a substantial number of loan observations from South Korea as the availability of pricing information for loans syndicated in South Korea is comparatively limited based on LoanConnector.
Chart 4: Share of loans by market of syndication
Panel A: All sectors Panel B: Emissions-instensive sectors
0% 10% 20% 30% 40%
Hong Kong Australia Japan Taiwan Singapore Indonesia China Philippines Thailand Vietnam South Korea Malaysia
Notes:
1. Panel A displays the share of loans to all sectors by market of syndication based on our loan sample, while panel B presents the share of loan amount to emissions-intensive sectors only.
2. Market of syndication is defined as the place where the majority of funds are raised to finance the syndicated loans.
Source: Staff calculation based on data obtained from DealScan and S&P Capital IQ.
III. EMPIRICAL ANALYSIS AND BASELINE FINDINGS
III.1 Do banks charge a higher lending rate on “brown” firms than their non-“brown” industry peers?
To assess whether banks would impose a higher loan spread on firms with higher emission intensity, we compare the loan spread charged on a highly emitting firm with an otherwise similar firm in the same industry but with a lower emission intensity, after controlling for other relevant loan-level, borrower and lender characteristics. Specifically, the following regression model (1) is employed:
, = + , + ℎ_ 2, + ℎ_ 2, ∗ _ + (1)
_ + , + , + ,
The dependent variable ( , ) is the lending spread over reference rates in bps for loan i originated in year t. ℎ , is a dummy variable which takes a value of one if the borrower’s emission intensity is higher than its industry-average at year t-1. We classified this group of borrowers as “brown”
- 10 -
firms. Zi,t are vectors of loan-level, while Xi,t-1 are borrower and lender control variables. 8 We also include a vector of fixed effects ( , ) over various dimensions to control for unobserved differences in the cost of bank loans.9 The coefficient on ℎ_ 2, is our parameter of interest which captures the additional loan spread imposed on a “brown” borrower relative to its industry-peers.
Given the Paris Agreement in December 2015 is regarded as one key commitment by both developed and developing countries to set emissions- reduction pledges to slow temperature rises globally, the increased global awareness of climate-related risks since then may prompt banks to consider climate-related risks in their loan origination decisions. To investigate whether the Paris Agreement structurally affects the extent to which banks price-in the climate transition risk,10 a time dummy variable _ (i.e. equals one if loans are issued in and after 2016, and zero otherwise) and its associated interaction term with ℎ_ 2, are included in the regression.
The estimation results for specification (1) are presented in Chart 6.11 The bars in the chart represent the estimated difference in the loan spread charged on a brown borrower relative to its non-brown counterpart, after accounting for all relevant control variables. As mentioned, the regression model is separately run on firms from emissions-intensive sectors (i.e. blue bars) and those from other sectors (orange bars).
8 For loan-level controls, we include, among others, the loan size, tenor and number of lead arrangers in the syndicate. For borrower controls, the financial soundness indicators of the borrower (e.g. return on assets, leverage and asset size) are included. For lender controls, the average profitability, capital ratio and asset size of the lead arranger consortium are included. For details, see Appendix Table A2.
9 These, among others, include borrower’s country, sector, loan currency and time fixed effects.
10 In fact, several recent studies also find empirical evidence of the existence of a carbon premium only after the signing of the Paris Agreement. See Bolton and Kacperczyk (2020b); Ehlers et al. (2021) and Capasso et al. (2020).
11 The estimation results are based on firms’ scope 1 emission intensity. For the complete estimation results of regression (1), see Table A3 in the Appendix. The results also remain quantitatively robust and similar if firms’ scope 1 & 2 emission intensity is considered. For details, see the Appendix of the HKIMR Working Paper.
Chart 6: Estimated differences in loan spreads between brown and non- brown firms
Average difference between Brown and non-brown firms (bps)
Pre-Paris Agreement Post-Paris Agreement 30
20 10 0 -10 -20
-30 Notes:
7.1
2.5 Emissions- intensive sectors
Other sectors
-22.0*
22.6**
1. Each bar shows the estimated average loan rate charged on brown firms minus the estimated average loan rate charged on non-brown firms in the same sector.
2. ***, **, * denote statistical significance at 1, 5, 10% respectively.
3. A complete set of estimation coefficients is reported in Table A3 of the Appendix.
Source: Staff calculation.
Our results suggest there is a large difference in the loan pricing of transition risk across the two groups of borrowers. For loans extended to borrowers in emissions-intensive sectors (i.e. blue bars in chart 6), banks appear to underprice the transition risk for loans originated before the Paris Agreement, as brown firms are estimated to borrow at a cheaper term relative to their non- brown counterparts. However, probably reflecting the increased global awareness of climate-related risk since the Paris Agreement, banks, on average, have charged a higher lending rate to brown firms by 23 bps, as compared to that of non-brown firms in the post-Paris Agreement period. Importantly, the additional loan premium is not only statistically significant, but economically meaningful as well. Given the average loan spread over the reference rate in our sample is 166 bps, the estimated impact is equivalent to a 14% rise in the average loan spread.
By contrast, for loans extended to firms in other sectors (i.e. orange bars in Chart 6), there is no statistically significant difference in the loan spread with respective to firms’ carbon emission intensity both in the pre- and post-Paris Agreement periods. A plausible explanation is that given these firms generally have a relatively low level of emission intensity (see Chart 2), the associated
- 12 -
transition risk may be less significant. As such, the carbon emission intensity of these firms may not have been seen as an important determinant by banks in their loan pricing considerations. Instead, the loan spreads charged on these firms will largely be determined by their financial characteristics and the specific loan features as captured in the control variables.
III.2 Does the environmental attitude of banks play a role in determining the extent of loan pricing for climate transition risk?
Given the above findings, we took a further step to study whether banks’ attitude towards green initiatives matters in determining the extent of additional loan pricing on “brown” firms among the loans to the emissions- intensive sectors. 12 In order to separate the effect of banks’ environmental attitudes from other banks’ financial characteristics, we modify our empirical approach by further decomposing the loan-level observations into loan-lender level observations. In addition, we include a time-varying bank-level dummy variable (i.e. GreenBankb,t), which takes a value of one if the bank is classified as a green bank at time t, to capture the additional impact of the bank’s green attitude on loan spreads. Following the literature, we classify a bank is “green”
if it is a member of the United Nations Environment Programme Finance Initiative (UNEP FI) and is also regularly self-disclosing its GHG footprint at the same time.13
Specifically, we employ the modified regression model (2) on loans extended to borrowers in emissions-intensive sectors:
, , = + , , + ℎ_ 2, + , + (2)
ℎ_ 2, ∗ _ + ℎ_ 2, ∗ , +
, ∗ _ + ℎ_ 2, ∗ , ∗
_ + _ + , + , + , + ,
Other control variables included in the loan-lender regression specification are similar to those in the loan-level regression (1), except that we replace the
12 We do not find strong evidence for a pricing difference between green and non-green banks for the other sectors group. For details, see the HKIMR working paper version.
13 UNEP FI is a partnership between the United Nations and the financial sector to encourage private sector funding in financing sustainable development. Signatory banks inform the public and their investors that they are committed to working towards integrating environmental considerations into their operations and business decisions.
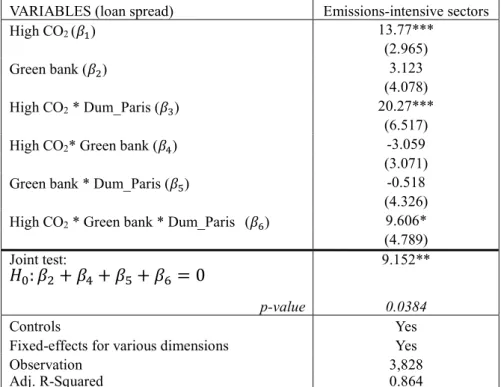
average value for the whole lending group by the individual lenders’ values for those lender control variables.14 The results are presented in Table 2.
Table 2: Estimation results for equation (2)
VARIABLES (loan spread) Emissions-intensive sectors
High CO2 ( ) 13.77***
(2.965)
Green bank ( ) 3.123
(4.078)
High CO2 * Dum_Paris ( ) 20.27***
(6.517)
High CO2* Green bank ( ) -3.059
(3.071)
Green bank * Dum_Paris ( ) -0.518
(4.326) High CO2 * Green bank * Dum_Paris ( ) 9.606*
(4.789)
Joint test: 9.152**
: + + + = 0
p-value 0.0384
Controls Yes
Fixed-effects for various dimensions Yes
Observation 3,828
Adj. R-Squared 0.864
Note: ***, **, and * indicate significance at the 1%, 5% and 10% levels respectively. Figures in the parentheses are the (robust) standard errors. A complete set of estimation results is presented in Table A4 of the Appendix.
Two key results are worth highlighting. First, the positive and statistically significant coefficient on the double interaction term ℎ_ 2, ∗ _ indicates the significant transition risk premium charged on brown firms in the post-Paris Agreement is not solely driven by loans extended by green banks, but also found in those extended by other banks.
Second, the positive and significant coefficient on the triple interaction term (i.e.
ℎ_ 2, ∗ , ∗ _ ) in the same table further implies that the change in the loan spread would be even larger if the “brown” firm borrows from a “green” bank compared with those borrowing from a non-green bank, after controlling for other key loan determinants.
14 In addition, the fixed effect term , , now includes borrower and lender fixed effects. In such case, the borrower industry and borrower country fixed effects are dropped to avoid multi-collinearity issues. It should also be emphasised that as the unit of observations in the empirical specification of (1) and (2) are different, the coefficient estimates from equation (2), notwithstanding that it shares many common variables with, and is intuitively similar to equation (1), are not directly comparable in quantitative terms with those from equation (1).
- 14 -
In addition, based on a statistical test for the cross-sectional difference 15 in the loan spread between the two abovementioned lending relationship pairs in the post-Paris Agreement period, we find that a “green” bank would charge an additional loan spread of around 9.2 bps compared with other banks, on the same “brown” firm. The magnitude is both statistically significant and also economically meaningful, as it implies that “green” banks will require an additional 5.5% carbon premium (relative to the average lending spread of 166 bps) in lending to the brown firm, compared with non-green banks. Overall, these results together suggest that the green attitude of banks does play a key role in determining the extent of the additional loan premium for the transition risk.
IV. CONCLUSION
Based on a novel sample of syndicated loans originated in the APAC region, our analysis suggests that banks in the region have started to price- in transition risks for loans to emissions-intensive sectors since the Paris Agreement. This probably reflects banks’ increased awareness of climate-related risks to those corporate borrowers that are more subject to the transition risk. The extent of the transition risk premium is also found to be dependent on the environmental attitude of banks. Specifically, “green” banks are found to charge a higher loan spread than other banks, when lending to the same brown firm in the post-Paris Agreement period. These findings together provide supportive evidence that banks in the region started to incorporate climate risk consideration into their existing risk management framework.
However, managing climate risks will remain a key challenge for banks due to the different nature from the traditional risk types16 and data gaps.
Banks should therefore keep abreast of the latest developments in climate risk management practices to adjust their own risk management approach. Therefore, policymakers in the region should proactively engage with the banking industry and help facilitate banks to incorporate climate risk management practices into their operations.
15 Based on equation (2), the cross-sectional difference in the loan spread between a “brown” firm borrowing from “green” bank and a “brown” firm borrowing from a non-“green” bank in the post-Paris
Agreement is determined by = 1, = 1, = 1 −
= 0, = 1, = 1 = + + + .
16 Compared to the traditional risk types, climate risks are more susceptible to non-linearity and fat- tailed distributions.
Indeed, the HKMA has been pushing ahead with its initiatives to address climate-related issues and promote green and sustainable banking. For instance, the HKMA published a White Paper on Green and Sustainable Banking in June 2020, which set out its initial thoughts on supervisory expectations for the management of climate risks. It has also issued a circular to provide greater detail on the relevant practices adopted by major and more advanced banks in managing such risks. The intention of the circular was to inspire rather than prescribe how banks should develop their approach to the management of climate risks. Furthermore, the HKMA has invited some banks to participate in a pilot climate stress testing exercise with a view to assessing the climate resilience of the banking sector as a whole.17 Looking ahead, the HKMA will continue to work closely with the Government, the financial sector and other key stakeholders to promote the development of green and sustainable banking in Hong Kong.
17 For more details and the latest updates on the HKMA’s works to promote green and sustainable banking in Hong Kong, we refer readers to the webpage: https://www.hkma.gov.hk/eng/key- functions/banking/banking-regulatory-and-supervisory-regime/green-and-sustainable-banking/.
- 16 -
REFERENCE
Basel Committee on Banking Supervision (BCBS) (2021b): Climate-related financial risks – measurement methodologies, April. (https://www.bis.org/bcbs/publ/d518.pdf) Bolton, P. and Kacperczyk, M., (2020a): “Do investors care about carbon risk?”, Journal of Financial Economics, forthcoming.
Bolton, P. and Kacperczyk, M., (2020b): “Global pricing of carbon-transition risk”, Working Paper, available at SSRN: http://dx.doi.org/10.2139/ssrn.3550233.
Busch, T., Johnson, M., and Pioch, T., (2020): “Corporate carbon performance data:
Quo vadis?”, Journal of Industrial Ecology, 2020:1-14.
Capasso, G., Gianfrate, G., and Spinelli, M., (2020): “Climate change and credit risk”, Journal of Cleaner Production, 266, 121634.
Ehlers, T., Packers, F., and de Greiff, K., (2021): “The pricing of carbon risk in syndicated loans: which risks are priced and why?”, BIS Working Papers, No.946.
Degryse, H., Goncharenko, R., Theunisz, C., and Vadasz, T., (2020): “When green meets green”, Working Paper Research, No. 392, National Bank of Belgium.
Delis, M.D., de Greiff, K., Iosifidi, M., and Ongena, S., (2021): “Being stranded with fossil fuel reserves? climate policy risk and the pricing of bank loans”, Swiss Finance Institute Research Paper, No. 18-10.
HKMA (2020): “White Paper on Green and Sustainable Banking”, HKMA publications, June 2020.
Ho, K., and Wong, A., (forthcoming): “Effect of climate-related risk on the pricing of bank loans: Evidence from syndicated loan markets in Asia Pacific”, HKIMR Working Paper Series.
Jondeau, E., Mojon, B., and Monnet, C., (2021): “Greening (runnable) brown assets with a liquidity backstop”, BIS Working Papers, No. 929, March 2021.
Kleimeier S., and Viehs, M., (2018): “Carbon disclosure, emission levels, and the cost of debts”, Working paper, available at SSRN: http://dx.doi.org/10.2139/ssrn.2719665.
APPENDIX
Table A1: Summary statistics
Panel A (loan-level / loan-lender level)
Variable names N mean sd min p25 p50 p75 max
loan spread 2842 166.17 106.35 0 95 145 215 900
loan tenor 2842 50.34 26.50 7 36 48 60 180
ln(loan size) 2842 18.91 1.29 12.77 18.07 18.98 19.76 23.45
dummy(covenant) 2842 0.13 0.34 0 0 0 0 1
dummy(secured) 2842 0.21 0.41 0 0 0 0 1
No. of lead arrangers 2842 5.88 4.85 1 2 5 8 32
dummy(after Paris Agreement) 2842 0.54 0.50 0 0 1 1 1
dummy(green bank) 16161 0.45 0.50 0 0 0 1 1
Panel B (unique borrower-year level)
Variable names N mean sd min p25 p50 p75 max
borrower's ROA 1462 3.67 2.72 -1.19 1.84 3.24 5.08 9.60
borrower's debt-to-asset 1462 32.61 13.78 9.10 22.78 31.56 42.33 61.70 borrower's ln(total asset) 1462 22.62 1.51 17.77 21.55 22.61 23.69 27.59
dummy(state ownership) 1462 0.07 0.26 0 0 0 0 1
Scope 1 emission intensity 1462 508.97 1973.0 0.00 13.58 31.38 157.87 28702 Scope 2 emission intensity 1462 77.34 219.5 0.02 14.55 36.21 62.20 5294 Scope 1&2 emission intensity 1462 586.30 2001.9 0.02 42.84 82.25 286.81 28703
Panel C (unique lender-year level)
Variable names N mean sd min p25 p50 p75 max
lender's ROA 1095 0.70 0.40 0.02 0.35 0.71 1.01 1.37
lender's log(total asset) 1095 26.41 1.41 24.45 25.00 26.54 27.57 28.63 lender's t1-capital ratio 1095 12.09 2.57 8.21 9.93 11.90 13.80 16.80 Note: Panel A reports summary statistics for the full sample at the loan-level, except for dummy(green bank) is reported at the loan-lender level. Panel B reports the relevant statistics at unique borrower-year level for loan-level regression, while panel C reports related statistics at unique lender-year level for the loan-lender level regression.
Control variables are winsorized at 5% level to deal with outliers unless otherwise specified.
- 1 -
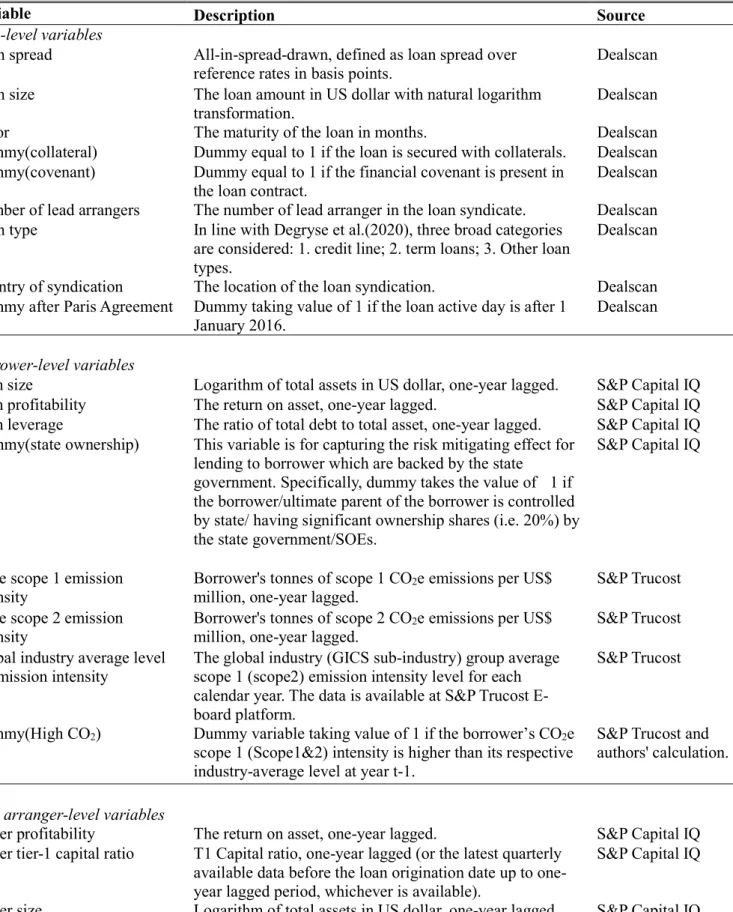
Table A2: Variable definitions and sources
Variable Description Source
loan-level variables Loan spread Loan size Tenor
Dummy(collateral) Dummy(covenant) Number of lead arrangers Loan type
Country of syndication Dummy after Paris Agreement
All-in-spread-drawn, defined as loan spread over reference rates in basis points.
The loan amount in US dollar with natural logarithm transformation.
The maturity of the loan in months.
Dummy equal to 1 if the loan is secured with collaterals.
Dummy equal to 1 if the financial covenant is present in the loan contract.
The number of lead arranger in the loan syndicate.
In line with Degryse et al.(2020), three broad categories are considered: 1. credit line; 2. term loans; 3. Other loan types.
The location of the loan syndication.
Dummy taking value of 1 if the loan active day is after 1 January 2016.
Dealscan Dealscan Dealscan Dealscan Dealscan Dealscan Dealscan
Dealscan Dealscan
borrower-level variables Firm size
Firm profitability Firm leverage
Dummy(state ownership)
CO2e scope 1 emission intensity
CO2e scope 2 emission intensity
Global industry average level of emission intensity
Dummy(High CO2)
Logarithm of total assets in US dollar, one-year lagged.
The return on asset, one-year lagged.
The ratio of total debt to total asset, one-year lagged.
This variable is for capturing the risk mitigating effect for lending to borrower which are backed by the state
government. Specifically, dummy takes the value of 1 if the borrower/ultimate parent of the borrower is controlled by state/ having significant ownership shares (i.e. 20%) by the state government/SOEs.
Borrower's tonnes of scope 1 CO2e emissions per US$
million, one-year lagged.
Borrower's tonnes of scope 2 CO2e emissions per US$
million, one-year lagged.
The global industry (GICS sub-industry) group average scope 1 (scope2) emission intensity level for each calendar year. The data is available at S&P Trucost E- board platform.
Dummy variable taking value of 1 if the borrower’s CO2e scope 1 (Scope1&2) intensity is higher than its respective industry-average level at year t-1.
S&P Capital IQ S&P Capital IQ S&P Capital IQ S&P Capital IQ
S&P Trucost S&P Trucost S&P Trucost
S&P Trucost and authors' calculation.
lead arranger-level variables lender profitability
lender tier-1 capital ratio
lender size
Dummy(Green bank')
The return on asset, one-year lagged.
T1 Capital ratio, one-year lagged (or the latest quarterly available data before the loan origination date up to one- year lagged period, whichever is available).
Logarithm of total assets in US dollar, one-year lagged.
This is a dummy taking value of 1 if as of the loan origination date, i.) the lead arranger has become a member of UNEP FI and ii.) the lead arranger (or its parent holding company is also regularly self-disclosing GHG footprint.
S&P Capital IQ S&P Capital IQ
S&P Capital IQ Website of UNEP FI
& S&P Trucost
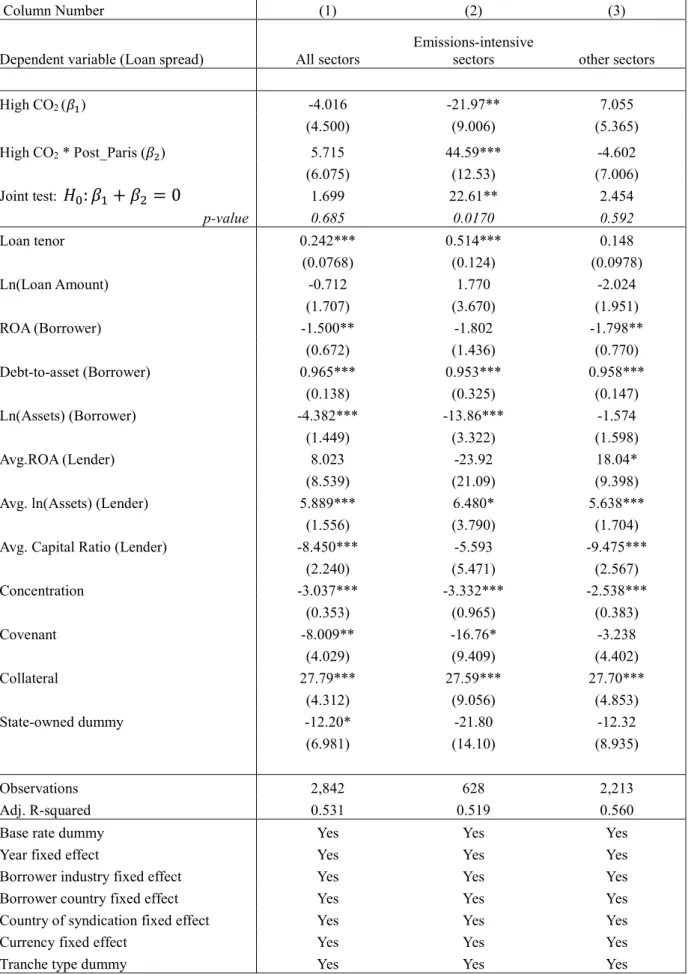
Table A3: Estimation results for equation (1) with the loan level observations
Column Number (1) (2) (3)
Dependent variable (Loan spread) All sectors
Emissions-intensive
sectors other sectors
High CO2 ( ) -4.016 -21.97** 7.055
(4.500) (9.006) (5.365)
High CO2 * Post_Paris ( ) 5.715 44.59*** -4.602
(6.075) (12.53) (7.006)
Joint test: : + = 0 1.699 22.61** 2.454
p-value 0.685 0.0170 0.592
Loan tenor 0.242*** 0.514*** 0.148
(0.0768) (0.124) (0.0978)
Ln(Loan Amount) -0.712 1.770 -2.024
(1.707) (3.670) (1.951)
ROA (Borrower) -1.500** -1.802 -1.798**
(0.672) (1.436) (0.770)
Debt-to-asset (Borrower) 0.965*** 0.953*** 0.958***
(0.138) (0.325) (0.147)
Ln(Assets) (Borrower) -4.382*** -13.86*** -1.574
(1.449) (3.322) (1.598)
Avg.ROA (Lender) 8.023 -23.92 18.04*
(8.539) (21.09) (9.398)
Avg. ln(Assets) (Lender) 5.889*** 6.480* 5.638***
(1.556) (3.790) (1.704)
Avg. Capital Ratio (Lender) -8.450*** -5.593 -9.475***
(2.240) (5.471) (2.567)
Concentration -3.037*** -3.332*** -2.538***
(0.353) (0.965) (0.383)
Covenant -8.009** -16.76* -3.238
(4.029) (9.409) (4.402)
Collateral 27.79*** 27.59*** 27.70***
(4.312) (9.056) (4.853)
State-owned dummy -12.20* -21.80 -12.32
(6.981) (14.10) (8.935)
Observations 2,842 628 2,213
Adj. R-squared 0.531 0.519 0.560
Base rate dummy Yes Yes Yes
Year fixed effect Yes Yes Yes
Borrower industry fixed effect Yes Yes Yes
Borrower country fixed effect Yes Yes Yes
Country of syndication fixed effect Yes Yes Yes
Currency fixed effect Yes Yes Yes
Tranche type dummy Yes Yes Yes
Note: ***, **, and * indicate significance at the 1%, 5% and 10% levels respectively. Figures in the parentheses are the (robust) standard errors.
- 3 -
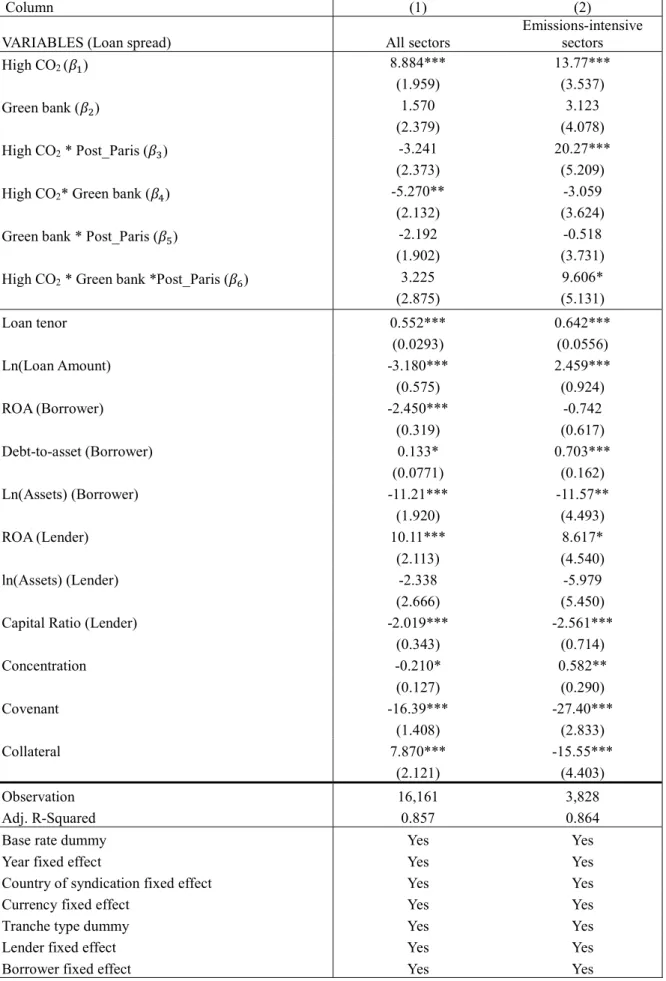
Table A4: Estimation results for equation (2) with the loan-lender level observations
Column (1) (2)
VARIABLES (Loan spread) All sectors Emissions-intensive
sectors
High CO2 ( ) 8.884*** 13.77***
(1.959) (3.537)
Green bank ( ) 1.570 3.123
(2.379) (4.078)
High CO2 * Post_Paris ( ) -3.241 20.27***
(2.373) (5.209)
High CO2* Green bank ( ) -5.270** -3.059
(2.132) (3.624)
Green bank * Post_Paris ( ) -2.192 -0.518
(1.902) (3.731)
High CO2 * Green bank *Post_Paris ( ) 3.225 9.606*
(2.875) (5.131)
Loan tenor 0.552*** 0.642***
(0.0293) (0.0556)
Ln(Loan Amount) -3.180*** 2.459***
(0.575) (0.924)
ROA (Borrower) -2.450*** -0.742
(0.319) (0.617)
Debt-to-asset (Borrower) 0.133* 0.703***
(0.0771) (0.162)
Ln(Assets) (Borrower) -11.21*** -11.57**
(1.920) (4.493)
ROA (Lender) 10.11*** 8.617*
(2.113) (4.540)
ln(Assets) (Lender) -2.338 -5.979
(2.666) (5.450)
Capital Ratio (Lender) -2.019*** -2.561***
(0.343) (0.714)
Concentration -0.210* 0.582**
(0.127) (0.290)
Covenant -16.39*** -27.40***
(1.408) (2.833)
Collateral 7.870*** -15.55***
(2.121) (4.403)
Observation 16,161 3,828
Adj. R-Squared 0.857 0.864
Base rate dummy Yes Yes
Year fixed effect Yes Yes
Country of syndication fixed effect Yes Yes
Currency fixed effect Yes Yes
Tranche type dummy Yes Yes
Lender fixed effect Yes Yes
Borrower fixed effect Yes Yes
Note: ***, **, and * indicate significance at the 1%, 5% and 10% levels respectively. Figures in the parentheses are the (robust) standard errors.