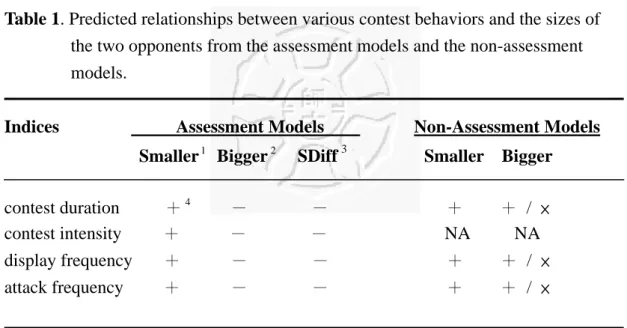
Table 1. Predicted relationships between various contest behaviors and the sizes of the two opponents from the assessment models and the non-assessment models.
Indices Assessment Models Non-Assessment Models Smaller
1Bigger
2SDiff
3Smaller Bigger
contest duration +
4- - + + / × contest intensity
+
- - NA NA display frequency
+
- - + + / × attack frequency
+
- - + + / ×
1
:size of the smaller opponents in this study, measured in body length
2
:size of the bigger opponents in this study, measured in body length
3
:Size Difference between opponents, the relative size difference between the two
opponents in this study=( 100
fish smaller of
size
fish smaller the
of size - fish bigger the
of
size × %)
4
:predicted relationships between sizes and contest behaviors.
+ positive relationship.
- negative relationship.
× no relationship
NA
no prediction from the models
Table 2. Factors examined in this study.
name of variables definition
C
1_HON9
I used four R. marmoratus clones for this study. By using the clone RHLC_VOL
as the the baseline group, I set up 3 dummy variables representing cloneC_SLC8E
HON9, VOL, and SLC8E for the regression model.LO
2_W
3I took the outcome of the pair’s last dyadic contest into consideration.
By using the loser pairs the baseline group, I set up a dummy variable representing the contests pairs having won their last dyadic contests.
S
4_BL
6The body length of the smaller opponent
B
5_BL
The body length of the bigger opponent1
:
C stands for Clone
2:
LO stands for Last Outcome of fighting.
3:
types of last fighting outcome, Winning or Losing
4:
S stands for Smaller fish
5:
B stands for Bigger fish
6:
BL stands for Body Length as the size measurement in the experiment.
Table 3. Results of multiple linear regression analysis on contest duration
1.
X factors
Radj2DF b SE F ratio p>F
Full Model
Overall test
20.03 6 1.41 0.22 C_HON9 0.57 0.44 1.73 0.19 C_VOL
-0.21 0.45 0.21 0.65 C_SLC8E
-0.05 0.43 0.01 0.91 LO_W 0.61 0.31 3.91 0.05 S_BL 0.19 0.39 0.23 0.64 B_BL -0.10 0.09 1.33 0.25
1
: contest duration is the period between 1
stdisplay and retreat of one contestant in
the dyadic contest
2
:the whole model test including all independent variables listed in Table 2
Table 4. Results of survival regression analysis on contest duration.
X factors DF b SE L-R χ
2p> χ
2Full Model
Overall test 6 9.83
0.13 C_HON9
-0.48 0.34 2.03 0.15 C_VOL -0.73 0.35 4.37 0.04 * C_SLC8E
-0.03 0.33 0.01 0.92 LO_W -0.25 0.25 1.02 0.31 S_BL -0.19 0.27 0.49 0.49 B_BL
0.13 0.07 3.30 0.07
* p<0.05
Table 5. Results of ordinal logistic regression on contest intensity.
X factors R DF b SE L-R
2χ
2p> χ
2Full Model
Overall test 0.10 6 18.71
0.005 C_HON9 0.12 0.62 0.04 0.84 C_VOL
0.17 0.64 0.07 0.80 C_SLC8E
0.05 0.62 0.01 0.94 LO_W
-1.31 0.46 8.38 0.004 **
S_BL
-1.24 0.58 4.54 0.03 * B_BL
0.35 0.13 7.00 0.008 **
Reduced Model I
Overall test 0.10 3 18.63 0.0003 LO_W
-1.32 0.46 8.70 0.003 **
S_BL
-1.24 0.56 4.78 0.03 * B_BL 0.36 0.13 8.01 0.005 **
Reduced Model II
Overall test 0.09 2 16.71 0.0002 LO_W
-1.32 0.46 8.75 0.003 **
RD
1_BL
0.09 0.03 11.37 0.0007 ***
1
:the relative difference of size between 2 contestants:
( 100
fish smaller of
BL
fish smaller the
of BL - fish bigger the
of
BL × %)
*** p<0.001
** p<0.01
* p<0.05
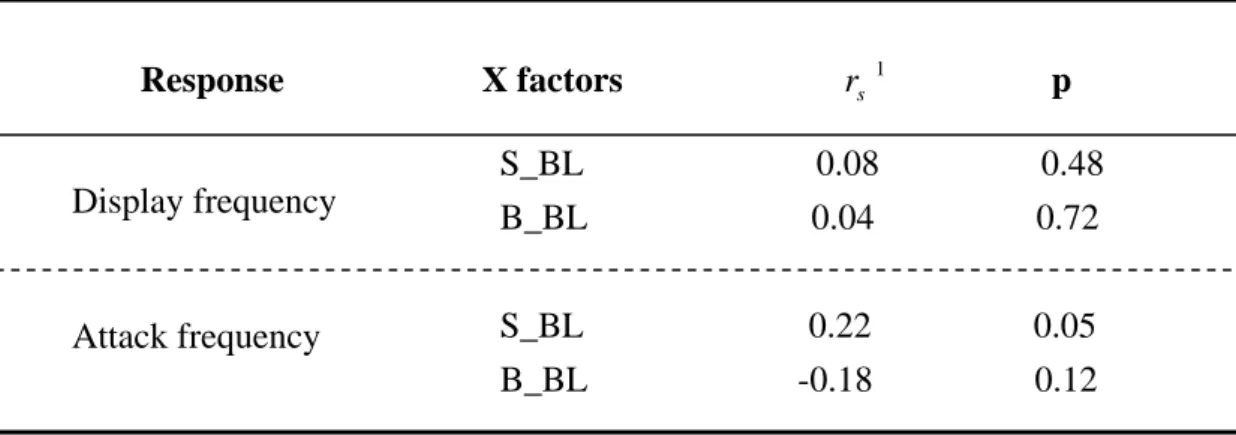
Table 6. Relationships between the sizes of the two contestants and the frequency of displays and attacks in the contests.
Response X factors r
s 1p S_BL 0.08 0.48
B_BL
0.04 0.72
S_BL
0.22 0.05 B_BL
-0.18 0.12
1
:Spearman Rank correlation
Table 7. Results of multiple logistic regression on the probability of the bigger opponents winning contests.
X factors R DF b SE L-R
2χ
2p> χ
2Full Model
Overall test 0.20 6 18.71 0.005 C_HON9
-0.75 0.77 0.96 0.33 C_VOL
0.33 0.29 0.16 0.69 C_SLC8E
0.71 0.85 0.71 0.40 LO_W 1.68 0.65 7.87 0.005 **
S_BL
-1.37 0.78 3.27 0.07 B_BL
0.28 0.18 2.48 0.12
Reduced Model
Overall test 0.09 1 8.25 0.004 LO_W 1.55 0.58 8.25 0.004 **
** p<0.01
Display frequency
Attack frequency
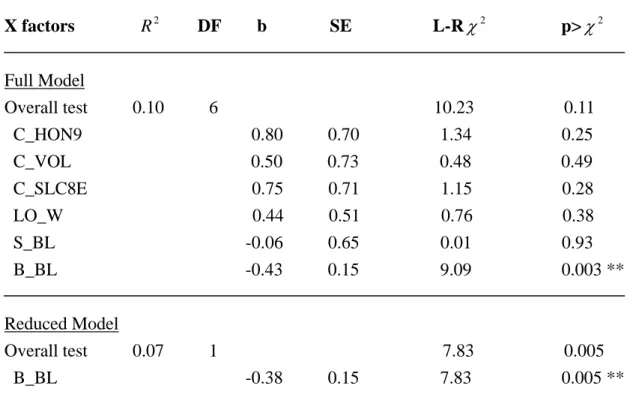
Table 8. Multiple logistic regression on the probability of the bigger contestants initiated displays.
X factors R DF b SE L-R
2χ
2p> χ
2Full Model
Overall test 0.10 6 10.23 0.11 C_HON9
0.80 0.70 1.34 0.25 C_VOL 0.50 0.73 0.48 0.49 C_SLC8E
0.75 0.71 1.15 0.28 LO_W 0.44 0.51 0.76 0.38 S_BL
-0.06 0.65 0.01 0.93 B_BL -0.43 0.15 9.09 0.003 **
Reduced Model
Overall test 0.07 1 7.83 0.005 B_BL -0.38 0.15 7.83 0.005 **
** p<0.01
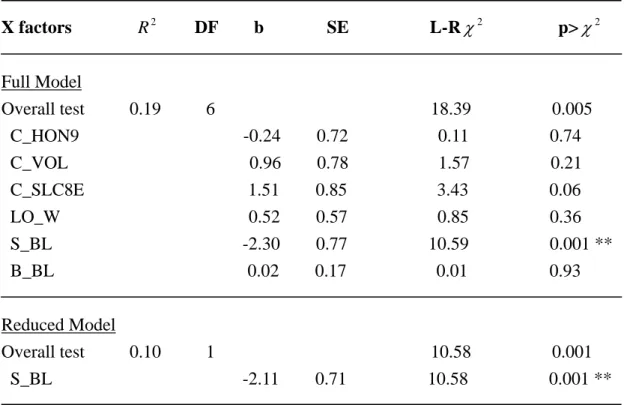
Table 9. Multiple logistic regression on the probability of the bigger contestants initiated attacks.
X factors R DF b SE L-R
2χ
2p> χ
2Full Model
Overall test 0.19 6 18.39 0.005 C_HON9
-0.24 0.72 0.11 0.74 C_VOL
0.96 0.78 1.57 0.21 C_SLC8E
1.51 0.85 3.43 0.06 LO_W 0.52 0.57 0.85 0.36 S_BL
-2.30 0.77 10.59 0.001 **
B_BL
0.02 0.17 0.01 0.93
Reduced Model
Overall test 0.10 1 10.58 0.001 S_BL
-2.11 0.71 10.58 0.001 **
** p<0.01
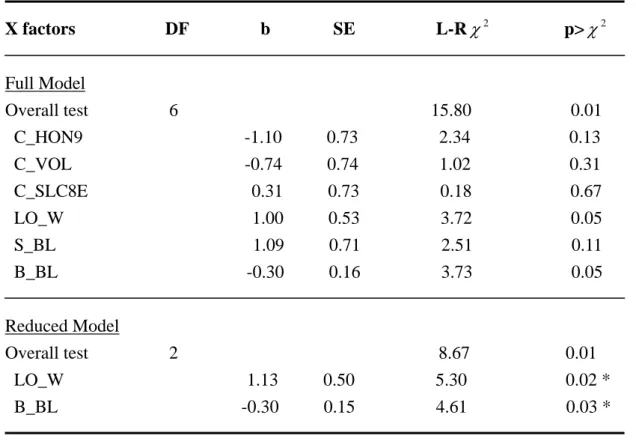
Table 10. Multiple logistic regression on the probability of escalation.
X factors DF b SE L-R χ
2p> χ
2Full Model
Overall test 6
15.80
0.01 C_HON9 -1.10 0.73 2.34 0.13 C_VOL
-0.74 0.74 1.02 0.31 C_SLC8E
0.31 0.73 0.18 0.67 LO_W 1.00 0.53 3.72 0.05 S_BL 1.09 0.71 2.51 0.11 B_BL -0.30 0.16 3.73 0.05
Reduced Model
Overall test 2 8.67
0.01 LO_W
1.13 0.50 5.30 0.02 * B_BL
-0.30 0.15 4.61 0.03 *
* p<0.05
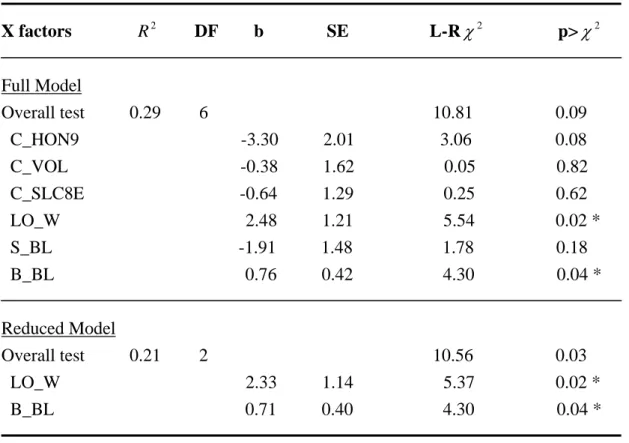
Table 11. Multiple logistic regression on the probability of the bigger contestants winning the escalations.
X factors R DF b SE L-R
2χ
2p> χ
2Full Model
Overall test 0.29
6 10.81
0.09 C_HON9 -3.30 2.01
3.06
0.08 C_VOL
-0.38 1.62 0.05 0.82 C_SLC8E
-0.64 1.29 0.25 0.62 LO_W
2.48 1.21 5.54 0.02 * S_BL
-1.91 1.48 1.78
0.18 B_BL
0.76 0.42 4.30
0.04 *
Reduced Model
Overall test 0.21
2 10.56
0.03 LO_W
2.33 1.14 5.37 0.02 * B_BL
0.71 0.40 4.30
0.04 *
* p<0.05
.
Table 12. Results of multiple linear regression on the latency to first attack
1(Ln transformed).
X factors
Radj2DF b SE F ratio p>F
Full Model
Overall test 0.03 6
1.33 0.26 C_HON9 -0.15 0.37 0.16 0.69 C_VOL
-0.19 0.38 0.23 0.63 C_SLC8E
-0.31 0.38 0.66 0.42 LO_W
-0.50 0.27 3.41 0.07 A
2_BL
0.11 0.08 2.05 0.16 R
3_BL
0.19 0.09 4.26 0.04 *
Reduced Model
Overall test 0.02 1
2.85 0.10 R_BL
0.12 0.07 2.85 0.10
1
:the latency to first attack is the period between 1
stdisplay of either one contestants and 1
stattack of the attacker in the dyadic contest
2
:A stands for Attacker
3
:R stands for Attack Receiver
* p<0.05
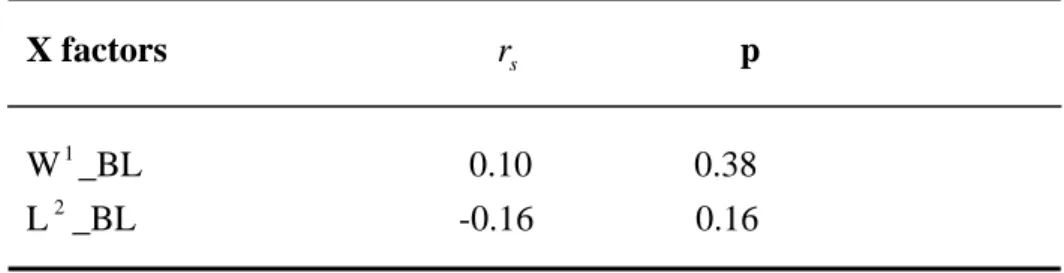
Table 13. Relationships between sizes and the attack rate by winner.
X factors r p
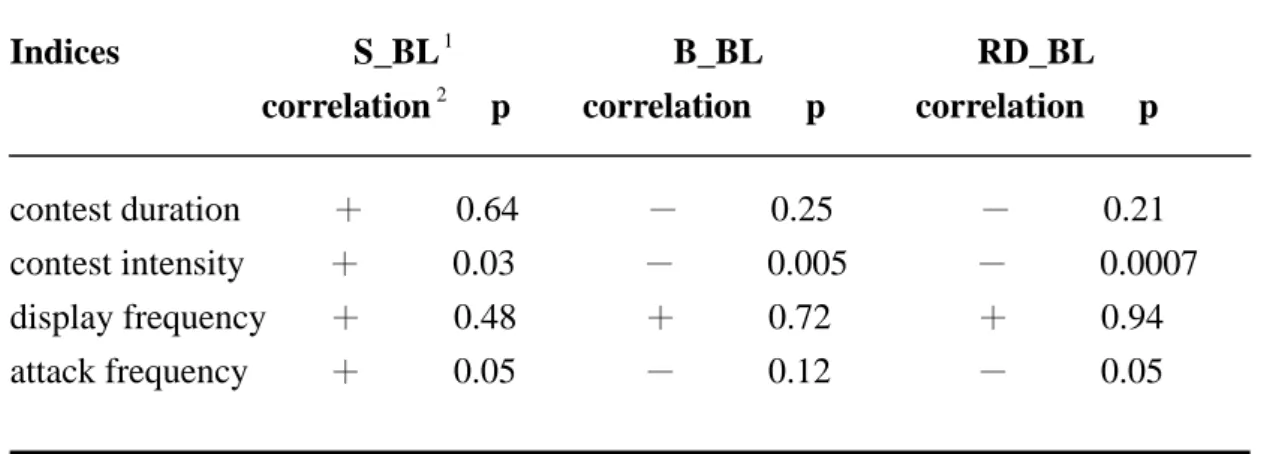
sTable 14. Effects of the body sizes of the two contestants on different assessment indices. Size effects on 3 indices(contest duration, contest intensity and attack frequency) have the same pattern as predicted in assessment models;
although some of them were insignificant.
Indices S_BL
1B_BL RD_BL correlation
2p correlation p correlation p
contest duration + 0.64 - 0.25 - 0.21 contest intensity
+ 0.03 - 0.005 - 0.0007 display frequency
+ 0.48 + 0.72 + 0.94 attack frequency
+ 0.05 - 0.12 - 0.05
1
:S stands for Smaller contestant, B stands for Bigger contestant and RD stands for Relative Size Difference between two contestants. BL stands for Body Length as size measurement.
2