國立臺灣大學生物資源暨農學院生物環境系統工程學系 博士論文
Department of Bioenvironmental Systems Engineering College of Bio-resources and Agriculture
National Taiwan University Doctoral Dissertation
同位素闡釋濁水溪沖積扇含砷地下水 氮化合物之來源及轉化
Isotopic evidence and simulation of nitrogen sources,
transformation, and transport in arsenic-contaminated groundwater of Choushui River alluvial fan
翁宗男
Tsung-Nan Weng
指導教授:劉振宇 博士 Advisor: Chen-Wuing Liu, Ph.D
中華民國 108 年 1 月 January 2019
摘要
本研究區域濁水溪沖積扇南端之淺層地下水含有高濃度砷,歷年研究報告指出 此區砷主要釋出機制為含砷之無晶型氧化鐵的還原溶解作用,另過去研究報告曾 探討濁水溪沖積扇沿海區域之鹽化地下水中硫的氧化還原循環對砷移動性之影響,
結果顯示高砷鹽化類地下水砷主要受硫歧化作用與含砷氫氧化鐵還原溶解影響,
高砷非鹽化類則顯示有人為抽水行為改變地下水氧化還原條件,促使含砷硫化物 再氧化,吸附於硫化物表面上的砷因而釋放至地下水中。除硫酸鹽類外,根據相關 化學反應式,氮的氧化還原循環亦可能影響地下水中砷的傳輸與宿命,惟其在砷的 生地化循環過程中所扮演的角色目前尚無人研究。
根據本研究結果,濁水溪沖積扇之扇頂區域之地下水含有高濃度硝酸鹽,扇尾
區域則普遍存在高濃度砷及氨氮,透過 δ15NNO3及 δ18ONO3繪圖,可得扇頂地下水
中硝酸鹽來源主要由含氮肥料、動物糞肥、及人類排泄物等所貢獻,扇央及扇尾地 下水中硝酸鹽則主要來自含氮肥料及海洋中硝酸鹽,並發現自扇頂至扇尾有脫硝 現象發生。氮循環系統方面,透過氮氧同位素化學反應方程式及其與硝酸鹽濃度之 繪圖,可得扇頂地下水有顯著硝化作用,扇央地下水中硝酸鹽之植物同化為硝酸鹽
削減之主要控制因子,惟脫硝現象並不顯著,而高濃度之砷、氨氮、鐵及δ15NNO3
之削減隱含著 feammox 作用的發生;扇尾地下水有顯著脫硝作用發生,並且可能 伴隨著植物同化、含氮物質礦化、硝酸鹽異化還原氨氮等作用,促成一個硝酸鹽削
減及氨氮增加的地下環境。δ15NNO3、δ18ONO3與砷濃度繪圖以及相關化學反應方程
式,指出扇央地下水之 feammox 作用及扇尾地下水的脫硝作用為導致含砷之鐵氫 氧化物還原溶解,並且釋出吸附砷至地下水的主要反應促使過程。
爾後,利用 PHREEQC 模擬軟體進行前述研究成果之模擬,除藉由現地環境氧 化還原狀態及實驗數據驗證模擬結果外,亦推估了未來反應終止之可能最終狀態,
以及可能傳輸情形,進一步瞭解濁水溪沖積扇地下水含氮化合物影響砷之生地化 循環過程。由 PHREEQC 模擬結果顯示,硝化或 feammox 主要發生在扇頂及扇央,
扇尾則無明顯此反應,而根據硝酸鹽從扇頂至扇尾的濃度空間分布,指出脫氮及硝 酸鹽異化還原氨氮從上游至下游漸序發生。依現地溶氧及氧化還原電位數據分析,
扇央及扇尾屬較還原狀態,可促使脫氮及硝酸鹽異化還原氨氮反應的發生。針對砷 的價態轉換模擬,扇頂三價砷減少而五價砷增加,扇央及扇尾,由溶氧及氧化還原
電位觀察結果,模擬砷由三價轉化為五價之狀況非常顯著。δ15N 的差異模擬結果,
在扇央及扇尾均顯示增加,符合現地採樣結果及理論依據,即脫氮反應發生時,
δ15N 將會增加。
一維傳輸結果,硝酸鹽同化作用發生在扇央,而氨氮硝化作用則發生在扇頂,
但不同年份模擬結果均有不同程度之時間位移。五價砷濃度於扇央開始增加,乃因 含砷之鐵氫氧化物還原溶解並使砷脫附所造成;三價砷濃度則在扇尾開始時增加,
主要由五價砷的還原轉換及持續性的鐵氫氧化物還原溶解所導致。二價及三價鐵 在扇央初期,因鐵氫氧化物還原溶解而使濃度增加,而三價鐵接著轉換為二價鐵。
二價鐵為主的環境,除了與地下水還原態環境有關外,也可能與 feammox 反應而 直接產生二價鐵有關。
關鍵詞:地下水、砷、氮同位素、生地化循環
Abstract
In this study, on the basis of physicochemical characteristics of groundwater and the
nitrogen and oxygen isotope composition of NO3−, it was inferred that the main sources
of NO3−
in the proximal fan of the Choushui River alluvial fan are likely to be ammonium
fertilizers, manure, and septic waste; that in the mid-fan and the distal fan, the possible
sources are nitrate fertilizers and marine nitrate. In the proximal fan, the oxidative state
obviously promotes microbial nitrification. High DO concentrations and relatively low
values of δ18ONO3 in the deeper aquifer of the proximal fan may be attributed to
unconfined granular nature and groundwater pumping by agricultural activities. In the
mid-fan, NO3− assimilation is the dominant response to NO3− attenuation, and
denitrification is insignificant; however, high concentrations of As, NH4+ and Fe and
depletion of δ15NNO3 imply the occurrence of feammox process. By contrast,
denitrification evidently occurs in the distal fan, through assimilation, mineralization, and
dissimilatory NO3− reduction to NH4+, resulting in depletion of NO3− and increase in NH4+
in groundwater. Feammox in the mid-fan and denitrification in the distal fan may be the
main processes leading to the release of As from As-bearing Fe oxyhydroxides into
groundwater.
The simulation result of nitrification shows that the nitrification and/or feammox
mostly occur in the proximal fan and mid-fan, whereas they slightly occur in the distal
fan. The concentrations of NO3− and NH4+ in the proximal fan evidently support the
occurrence of NH4+ nitrification. The spatial concentration distribution of NO3−
from the
proximal fan to the distal fan indicates the gradual occurrence of NO3− denitrification
and/or DNRA from upstream to downstream of the Choushui River alluvial fan. The mid-
fan and the distal fan were assessed on the basis of the local DO and ORP values to be in
relatively more reductive conditions, driving the occurrence of denitrification and/or
DNRA. In the proximal fan, As3+ decreased and As5+ increased, and this valence
transformation of As species and As concentration difference seem comprehensible. In
the mid-fan and the distal fan, the reductive state was observed base on the DO and ORP
data of the groundwater, and the circumstance of reduction from As5+ to As3+ was obvious.
The discrepancy of δ15N in NO3− in groundwater was simulated on the basis of the
influence of the reaction of NO3− denitrification. The values of δ15NNO3 increased in the
groundwater of the mid-fan and the distal fan; in theory, the denitrification increases δ15N
values of the residual NO3−.
The 1-D transport simulation result suggested that NO3− assimilation occur from the
mid-fan of the Choushui River Alluvial Fan to the distal fan, whereas NH4+ nitrification
is observed at the beginning of the proximal fan. The concentration of As5+increased at
the beginning of the mid-fan, which may be caused by the reductive dissolution of As-
bearing Fe oxyhydroxides and the desorption of adsorbed As. The concentration of As3+
increased obviously at the beginning of the distal fan, which may be related to the
transformation of As5+ to As3+ in the reductive environment, and the continuous
desorption of As from Fe oxyhydroxides simultaneously. Both the concentrations of Fe3+
and Fe2+ increased at the end of proximal, causing by the reductive dissolution of Fe
oxyhydroxides. The transformation of Fe3+ to Fe2+ occurred soon when the groundwater
reached the mid-fan. The increase in Fe2+ is not only related to the reductive environment,
but also attributed to the reaction of feammox, which Fe oxyhydroxides react with NH4+
and produce Fe2+ in the groundwater.
Keywords: Groundwater; Arsenic; Nitrogen isotope; Biogeochemical cycling
Contents
摘要 ... I
Abstract ... III
Contents ... VII
1. Introduction ... 1
2. Literature reviews ... 4
2.1 Hydrogeochemical characteristics of As in Choushui River Alluvial Fan ... 4
2.2 N-budget system and applications of nitrogen/oxygen isotope in nitrate ... 6
3. Study area ... 13
4. Materials and methods ... 22
4.1 Groundwater sampling and chemical analysis ... 22
4.2 Multiple stable isotopes analysis ... 23
4.3 Nitrogen cycling process simulations ... 25
5. Results and discussion ... 28
5.1 Mixing of groundwater and extrinsic influences on groundwater ... 28
5.2 Physicochemical characteristics of groundwater ... 37
5.3 Sources and transformation of nitrogen in groundwater ... 46
5.3.1 Probable sources of NO3−
... 46
5.3.2 Formation and attenuation of NO3− ... 50
5.4 As mobility in the N-budget system ... 55
5.5 The PHREEQC simulations of N cycling in As-rich groundwater ... 61
5.5.1 The NH4+ concentration differences after nitrification simulation ... 61
5.5.2 The NO3− concentration differences after denitrification simulation ... 66
5.5.3 The discrepancy of δ15NNO3 after denitrification simulation ... 71
5.5.4 The 1-D transport of N compounds in As-rich groundwater ... 73
6. Conclusions ... 79
References ... 85
List of Tables
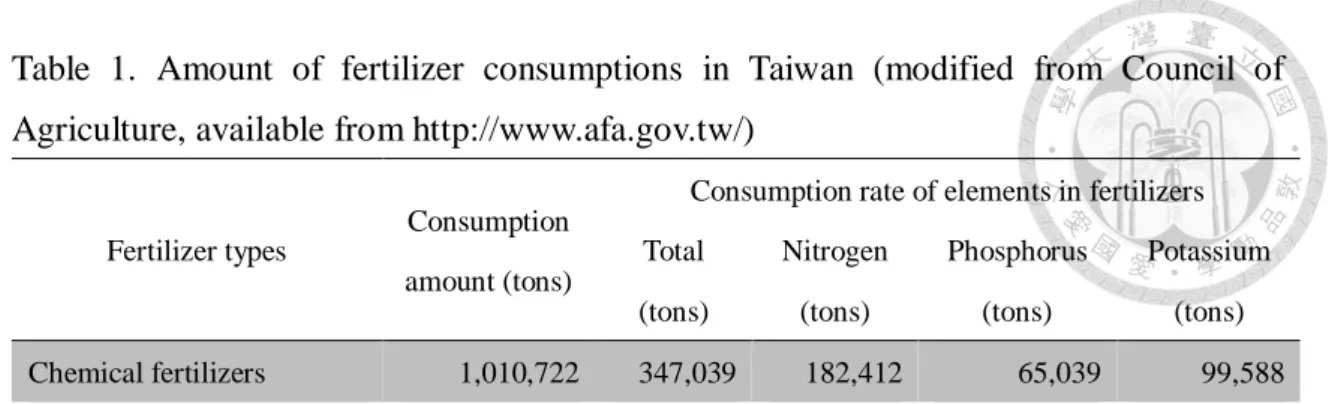
Table 1. Amount of fertilizer consumptions in Taiwan ... 19
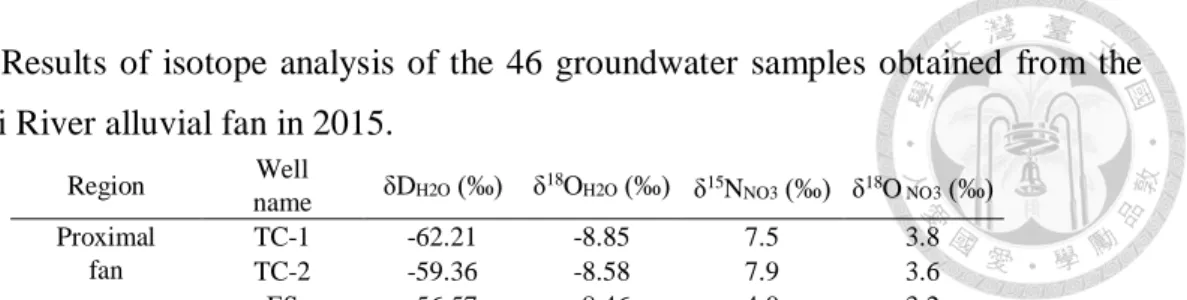
Table 2. Results of isotope analysis of the 46 groundwater samples obtained from the
Choushui River alluvial fan in 2015. ... 33
Table 3. Physical and chemical analysis results for the 46 groundwater samples
collected from the Choushui River alluvial fan in September 2015. ... 34
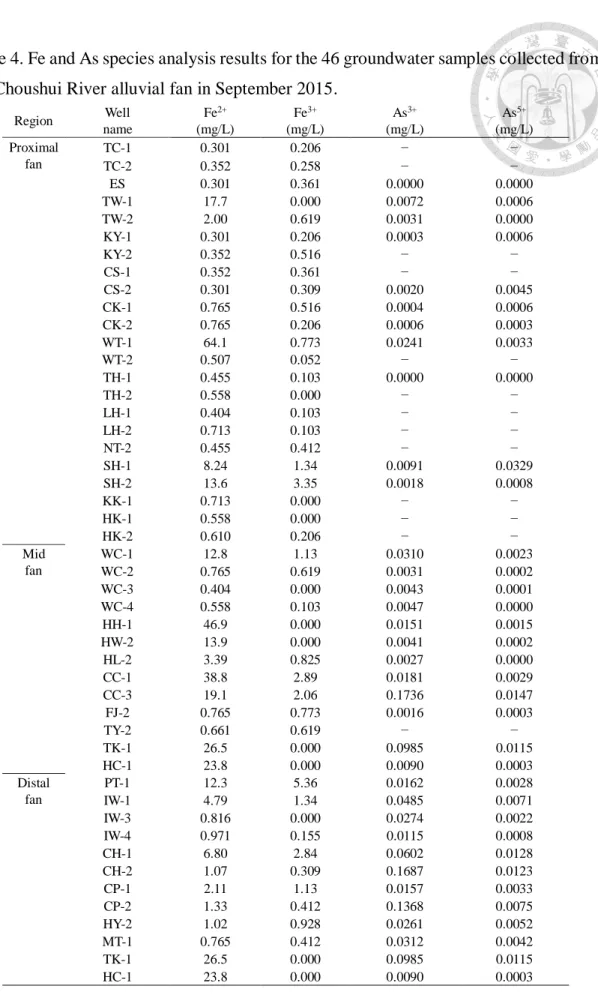
Table 4. Fe and As species analysis results for the 46 groundwater samples collected
from the Choushui River alluvial fan in September 2015. ... 44
Table 5. Correlations between the physical and chemical analysis results for the 46
groundwater samples of the Choushui River alluvial fan. ... 45
Table 6. Dominant N sources, N compounds and N redox reactions in the Choushui
River alluvial fan. ... 60
Table 7. Detailed NH4+ simulation results of nitrification in the groundwater samples
obtained from the Choushui River alluvial fan. ... 64
Table 8. Summary of NO3− and As simulation results of denitrification in the
groundwater samples obtained from the Choushui River alluvial fan. ... 68
Table 9. Detailed NO3− simulation results of denitrification in the groundwater samples
obtained from the Choushui River alluvial fan. ... 70
Table 10. Detailed δ15NNO3 simulation results of denitrification in the groundwater
samples obtained from the Choushui River alluvial fan in 2015. ... 72
List of Figures
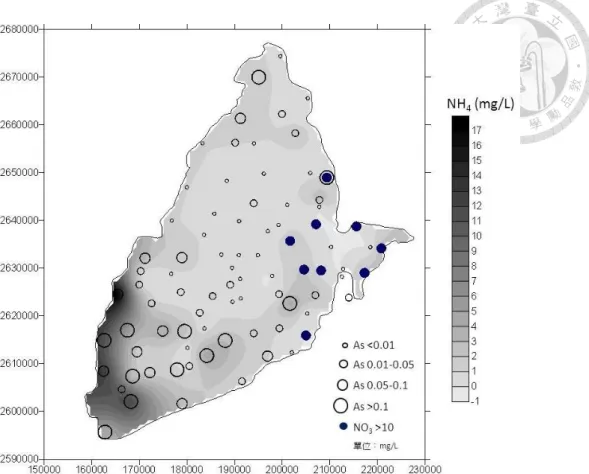
Fig. 1. Distribution of As, NH4+ and NO3- in groundwater of Choushui river alluvial fan.
... 4
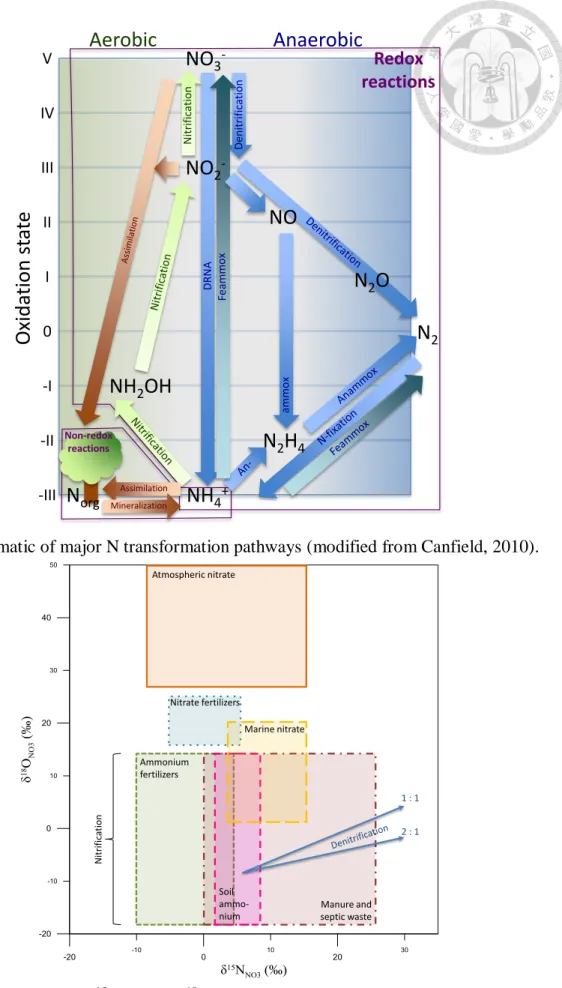
Fig. 2. Schematic of major N transformation pathways... 10
Fig. 3. Typical ranges of δ15NNO3 and δ18ONO3 values for various nitrate sources. ... 11
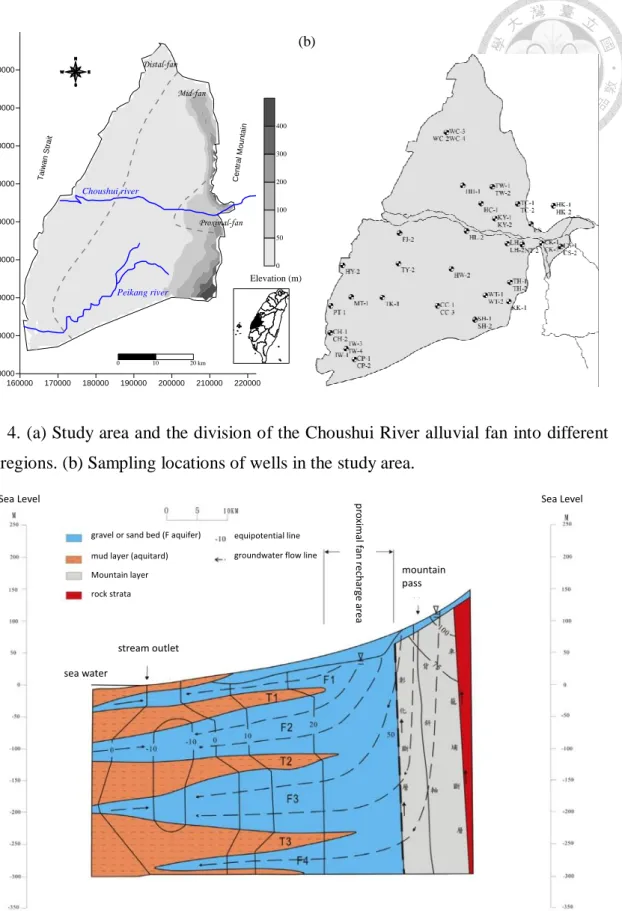
Fig. 4. (a) Study area and the division of the Choushui River alluvial fan into different
fan regions. (b) Sampling locations of wells in the study area. ... 20
Fig. 5. Conceptual hydrogeological profile of the aquifer system in the Choushui River
alluvial fan. ... 20
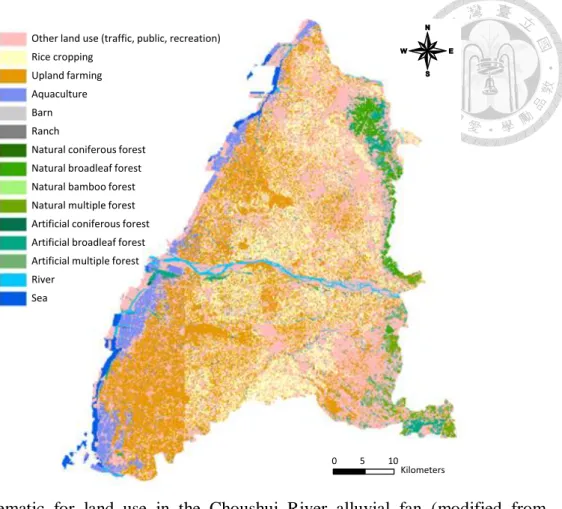
Fig. 6. Schematic for land use in the Choushui River alluvial fan. ... 21
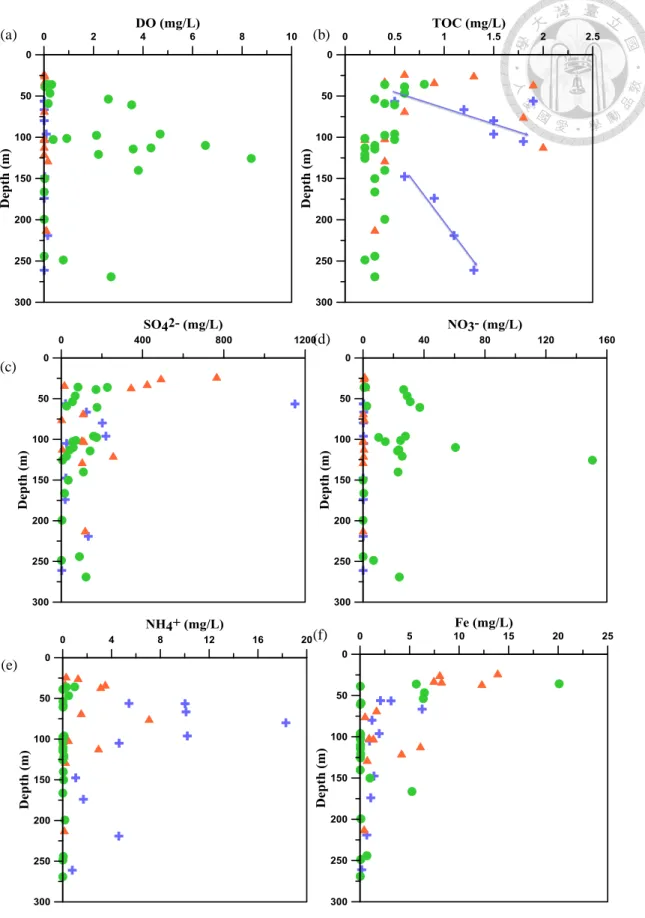
Fig. 8. Plots of depth versus water quality parameters and the relations between
parameters for the 46 groundwater samples.. ... 36
Fig. 9. Plots of spatial distribution of As, NH4+, and TOC for the 46 groundwater
samples. ... 43
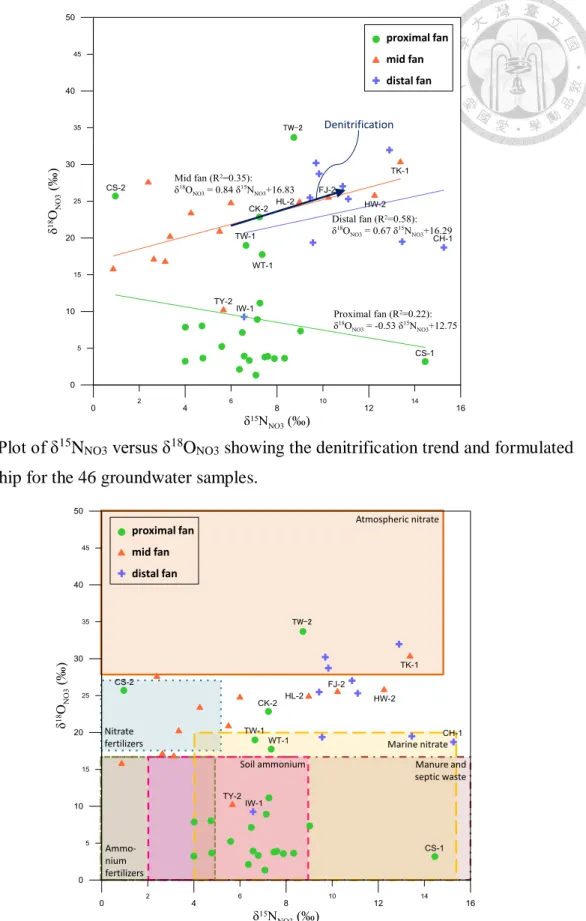
Fig. 10. Plot of δ15NNO3 versus δ18ONO3 showing the denitrification trend and formulated
relationship for the 46 groundwater samples... 49
Fig. 11. Schematic for source identification on the basis of δ15NNO3 and δ18ONO3 values
obtained for the 46 groundwater samples. ... 49
Fig. 12. Formulated relationship between δ15NNO3 and lnNO3− for the 46 groundwater
samples. ... 55
Fig. 13. Plot of As concentration on δ15NNO3 versus δ18ONO3 diagram for the 46
groundwater samples... 60
Fig. 14. The SCM of the sources and transformation of N-containing contaminants in
the arsenic contaminated groundwater of the Choushui River alluvial fan. ... 61
Fig. 15. The spatial divisions of 1-D transport in PHREEQC.. ... 76
Fig. 16. 1-D transport simulation result of different groundwater parameters from the
representative groundwater samples. ... 77
1. Introduction
Arsenic (As) is an ubiquitous trace metalloid found throughout the environment. The
occurrence of As contamination in groundwater varies greatly due to the heterogeneous
distribution of source materials and subsequent biogeochemical control on aqueous As
mobility in aquifers. The major factor controlling the fate of As is the site-specific
geochemical characteristics in different formation and the distribution of As is mostly
associated with geological settings of the As-affected areas.
A nationwide contamination of As in groundwater has been observed in shallow tube
wells in Bangladesh to depths of 15 to 30 m (Kinniburgh, 2001). Most wells of the
shallow aquifers in coastal region were affected by As contamination (McArthur et al.,
2001; Ravenscroft et al., 2001, 2005). Anawar et al. (2013) demonstrated that the As
concentrations in groundwater of the Ganges delta within the depths of 30-40 m were
strongly correlated with Holocene aquifer. Several release mechanisms of As have been
postulated, yet the reduction of Fe oxyhydroxide is regarded as the most possible
hypothesis (Eq. (1); Nickson et al., 1998; 2000). In Asia, high concentrations of naturally
occurring As are often found in young alluvial and deltaic deposits with large amounts of
fine grained detrital sediments together with fresh organic matter, except in mineralized
or mining areas (Plant et al., 2005; Mukherjee et al., 2006; Polizzotto et al., 2008). Besides,
some studies also indicated the phenomenon that the in-situ distribution of As in
groundwater accompanies with high NH4+-N concentration (Ravenscroft et al., 2005;
Kurosawa et al., 2008).
8FeOOH-As(s)+CH3COOH+14H2CO3→8Fe2+(aq)+As(d)+16HCO3-
(aq)+12H2O (1)
High concentrations of NH4+-N in groundwater, while not directly harmful to human
health, are often a sign of the groundwater being affected by anthropogenic activities,
such as spreading of fertilizers and manure or leaking sewage water (Vitòria et al., 2004;
Hosono et al., 2011). Stüben et al. (2003) suggested that the presence of NH4+ reflects the
reducing condition for release of As and Fe into groundwater. Kurosawa et al. (2008)
reported that the NH4+ concentration is correlated positively with As concentration and
negatively with oxidation reduction potential (ORP), thus the influence of N fertilizer
application on As contamination is caused by reducing condition. High concentrations of
NH4+ and As in shallow groundwater have also been simultaneously observed in the mid
and distal fan of Choushui river alluvial fan (Fig. 1) (Agricultural Engineering Research
Center, 2012). Therefore, NH4+ may be somehow correlated with As concentration in
groundwater of this area, yet there has been few published reports discussing the coupled
correlation and interaction betweeen them.
The spatial distributions of NO3-, NH4+ contamination and high As concentrations
occurred in Choushui river alluvial fan may not be effected by single occurrence. They
may be governed by multiple geochemical processes, including either co-precipitation or
adsorption of the reduction products, or both, that control the mobilization of As into the
reductive groundwater.
However, most of previous studies only concern about NO3- contamination in
groundwater by using N isotope as a single tracer. For example, stable N isotope has been
used to identify sources of NO3- in groundwater (Peng et al., 2004; Peng and Fan 2005).
Peng et al. (2012) reported that water mixing rather than isotopic fractionation processes
such as denitrification or assimilation is the major process affecting the concentration and
N isotope compositions of NO3- in trunk water. There has not yet been any published
report discussing a correlation between As and N in groundwater by using multiple
isotopes to identify the possible multiple redox processes of N regarding with As
mobilization.
Fig. 1. Distribution of As, NH4+ and NO3- in groundwater of Choushui river alluvial fan.
2. Literature reviews
2.1 Hydrogeochemical characteristics of As in Choushui River Alluvial Fan
Groundwater monitoring network in 10 groundwater divisions was established by
Taiwan government in order to monitor the groundwater quality and level since 1999.
Based on the groundwater monitoring network, Chianan Plain and Choushui river alluvial
fan in southwestern Taiwan and Lanyang Plain in northeastern Taiwan are the main As-
affected areas. In around 35 % of monitoring wells in Choushui river alluvial fan, As
concentrations exceed the World Health Organization (WHO) guideline of 0.01 mg/L
(Agricultural Engineering Research Center, 2012), and the highest As concentration is up
to 0.96 mg/L (Agricultural Engineering Research Center, 2010).
According to the detailed analyses of sediment (Liu et al., 2006), considerable As
contents enriched in the fine clay. Liu et al. (2006) showed that total As concentrations of
core samples from the mid and distal fan were mostly higher than the average As content
in crust (20 mg/kg). The highest As concentration of sediments in the shallow aquifer was
in the depth of ~50 m, with the deposits of the Holocene transgression. The data from the
accelerator mass spectrometry C14 dating of mollusk shells in the core samples of
Choushui river alluvial fan (Central Geological Survey, 1999) suggested that the geologic
ages of the core samples in distal fan to mid fan could be grouped as follows: 2,931 to
5,364 yr ago, 7,090 to 9,230 yr ago, and >36,400 yr ago. The first two intervals are
associated with the formation of marine sequence 1, and the third is associated with the
formation of marine sequence 2. The As concentrations of the core samples in the second
interval exceeded those in the other two intervals, and the highest As concentration was
51.35 mg/kg (Liu et al., 2006). Based on the classification of the sedimentation sequences
(Huang, 1996), the second interval corresponded to the bottom of marine sequence 1,
which was mainly formed by clayey sediment. Additionally, the distribution of clay in
marine sequence 1 was more extensive than that in marine sequence 2, causing
considerable As accumulation. As concentrations in shallow strata of this area originated
primarily from aquitard formations of marine sequences, associating with the occurrence
of high As groundwater in shallow aquifer. Lu et al. (2010) also indicated well
correlations between As, S, and Fe concentrations of sediment by the results of XRF data.
The sequential extraction further showed that the major sinks of As were Fe minerals and
As-bearing sulfides under different redox conditions. Although the probable mechanism
of As released to groundwater was the dissolution of Fe minerals under reducing
conditions, the influence of SO42-/S2- reformation cycling on As mobility in aquifers did
not address.
2.2 N-budget system and applications of nitrogen/oxygen isotope in nitrate
Although NO3− is the most common N compound in oxygenated groundwater, NH4+
can be the dominant form because groundwater is in a strongly reductive state
(Lindenbaum, 2012). The transformation processes among main N compounds (NO3−,
NO2−, N2O, NH4+, N2) include the cycling processes of nitrification, denitrification, N
fixation, assimilation, mineralization, anammox, and feammox (Fig. 2). Researchers
often use the N isotope to identify the causes of depletion of and increase in each N
compound and to distinguish between the sources of NO3− and NH4+ (Norrman et al.,
2015; Scheiber et al., 2016; Otero et al., 2008; Hosono et al., 2011).
Due to its relatively stable characteristics, stable isotopes such as 2H, 18O, 34S and
15N have been useful in tracing the origins of water, contaminants and the source of
dissolved constituents. Stable isotopes could be the fingerprints of the environment,
regardless of temporal and geographic scales. For more than a decade, researchers in
Taiwan have demonstrated considerable cases in evaluating the source of contaminants
in groundwater. With information from local spatial distribution, researchers can provide
strong and conclusive evidence about the source of contaminants, which is immediate
concern of the affected populace. As of, stable isotopes have been utilized to understand
the biogeochemical processes in groundwater systems as well (Kendall, 1998; Cook and
Herczeg, 2000; Kao et al., 2011).
Many investigators have successfully applied several isotopes in groundwater
environment studies, including δD and δ18O in H2O, δ34S and δ18O in SO42-, δ15N and
δ18O in NO3-. Briefly, δD and δ18O have commonly been used to understand the origin
and mixing of H2O in groundwater (Clark and Fritz, 1997; IAEA 1983). In Taiwan, the
stable isotopes δD and δ18O are regarded as applicable tracers for investigating hydrologic
relations between different water bodies (Liu 1984; Wang and Peng 2001; Peng et al.,
2007). δ34SSO4 and δ18OSO4 have been useful in determining the sulfur cycling that occurs
in the coastal aquifer. The origin of SO42- in groundwater is various, which may be derived
naturally during dissolution of gypsum or oxidation of S2-. δ34SSO4 and δ18OSO4 have been
used as tracers of (1) in different natural sources of SO42- (modern seawater, dissolution
of sulfate minerals, and soil sulfates) (Clark and Fritz, 1997; Krouse and Mauer, 2000);
(2) man-made SO42- (sewage, agrochemicals, detergents and SO42- of industrial origin)
(Torssander et al., 2006; Brenot et al., 2007; Otero et al., 2008); (3) S redox processes
(oxidation of S2- and reduction of SO42-) (Seiler et al., 2011; Kao et al., 2011). In addition,
many studies have been carried out using δ15NNO3 and δ18ONO3 in order to discriminate
between organic (e.g., human or animal manure) and inorganic (e.g., chemical fertilizers)
N contaminants in waters (Robinson and Bottrell, 1997; Otero et al., 2008; Hosono et al.,
2011).
Tracing of NO3- and SO42- sources/sinks by N and S isotope compositions,
respectively, is depending on kinetic and thermodynamic fractionation processes. The
NO3- contamination in shallow groundwater may suffer by the combined impact of
fertilizer and septic tank effluent. The jointed data of 15N and 18O provide an effective
tool to distinguish between NO3- of different origin and to evaluate the N-budget of a soil-
water system (Fig. 3). The organic N, which is originated from manure or fertilizers, can
be transformed back to NH4+ for recycling in the N-budget system, and that the
commercial urea fertilizers (NH2CONH2) decompose in groundwater to NH4+ may also
be subsequently oxidized by nitrification to NO3- (Fig. 2; Eq. (2)).
In proximal fan of Choushui river alluvial fan, NO3- is the most stable species in
oxidizing condition in groundwater, and the various sources of NO3- can be distinguished
by analyzing 15N and 18O. Next, a variable biological reaction requires anoxic conditions
and accessible organic substrates such as dissolved organic carbon (DOC) (Eq. (3)).
These principal N-transforming reactions are regarded as a crucial factor for the
distribution of isotopes in NO3- and NH4+ in groundwater. Kendall and Aravena (2000)
reported that the negative correlation of δ15NNO3 versus NO3- concentration showed that
the residual NO3- was enriched in 15N exponentially as NO3- concentration decreased,
which might be caused by denitrification process. The denitrification of a NO3- fertilizer
with an original δ15NNO3 value of +0 ‰ can yield residual δ15NNO3 value of +15 to +30
‰. However, it may be an obstacle in differentiating N sources, since the range is similar
with that being expected from manure or septic waste (Clark and Fritz, 1997).
The NO3− contamination of shallow groundwater may result from the combined
impact of fertilizer application and septic tank effluent leakage. The combination of
δ15NNO3 and δ18ONO3 data can be effectively used for distinguishing between NO3− from
different origins and for evaluating the N-budget of a soil-water system (Fig. 3).
Nitrification NH4++2O2→NO3-+2H++H2O (2)
Denitrification NO3-+5/4CH2O→1/2N2+5/4HCO3-+1/4H++1/2H2O (3)
Fig. 2. Schematic of major N transformation pathways (modified from Canfield, 2010).
Fig. 3. Typical ranges of δ15NNO3 and δ18ONO3 values for various nitrate sources (modified from Kendall et al., 2007).
NO
3-NH
4+N
2NH
2OH
O xi da ti on st at e
0 -I -II -III I II III IV
V
Aerobic Anaerobic
N
orgN
2H
4Denitrification ammox
Nitrification DRNA
Mineralization Assimilation
Redox reactions
Non-redox reactions
NO
N
2O NO
2-Nitrification
1 : 1
2 : 1 Atmospheric nitrate
Nitrate fertilizers
Ammonium fertilizers
Manure and septic waste Soil
ammo- nium
Marine nitrate
The purpose of the study is to identify of the possible multiple redox processes of N
associated with As mobilization in groundwater. As we know, a few number of researches
focused on the impact of N cycling on As migration. It has been reported that NO3- limited
the reduction of iron oxides by consuming available electron donors, and consequently
the release of As (Pauwels et al., 2000). Previous N isotope study showed that
denitrification occurred in the aquifer (Li et al., 2010), yet the influence of denitrification
on As mobilization remained to be understood. The negative linear relationship between
NO3- and SO42- during denitrification processes is governed by Eq. (4). In this process,
the Rayleigh function can be applied to both 15N and 18O to determine the enrichment
factors that dominate in groundwater. The oxidation of As-bearing pyrite results in
subsequent As release, which can be identified by the correlation between δ34SSO4and
δ18OSO4 (Van Stempvoort and Krouse, 1994). The adsorption of As by newly precipitated
hydrous ferric oxides may be occurred by Eq. (4), then reductive dissolution of As-
Fe(OH)3 may result in enrichment of As in groundwater of reducing conditions. However
under typical aquifer conditions, iron (and sometimes manganese) sulfide (pyrite) is
typically expected to be the electron donor (Korom, 1992; Ottley et al., 1997) (Eq. (5))
FeS2 +6NO3-+4H2O→2Fe(OH)3+4SO42-+3N2+2H+ (4)
5FeS2 +14NO3-+4H+→N2+10SO42-+5Fe2++2H2O (5)
0.5N2+5FeOOH+9H+↔NO3-+5Fe2++7H2O (6)
The reaction (Eq. (5)) is favorable in soils as adsorption of dissolved Fe2+ and NH4+
onto sediment particles, and the situation is described as a reversible, linear equilibrium
reaction. Molecular oxygen was indirectly incorporated into the SO42- via the
sequestration by nitrification, however high salinity might inhibit denitrification (Rivett
et al., 2008). Geochemical studies of S and N isotopes found that pyrite oxidation
accounted for approximately 70% of the SO42- present in the zone of denitrification
(Zhang et al., 2014). Isotopic analysis suggested that denitrification might be fueled by
Eq. (6). As NO3- was consumed, more goethite might dissolve, accompanying by the
release of absorbed As. Hence, N isotope analysis can elucidate the presence of
denitrification in groundwater; it may also be an important influencer of As mobilization.
With the aid of multiple isotopes of H, O, S, and H, together with hydrogeochemical
investigation, the biogeochemical processes occurring in groundwater system of
Choushui river alluvial fan can be elucidated, and the geochemical behavior of As
affected by the biologically uptakes of essential nutrients elements for metabolisms
should be explained as well.
The results of isotopic compositions (δD and δ18OH2O, δ15NNO3 and δ18ONO3,) will be
used to reveal the potential biogeochemical processes related to the biogeochemical
cycling of N, also, to provide useful information about the sources of NO3- as well as the
impact of N cycling on As mobilization in groundwater systems.
3. Study area
The Choushui River alluvial fan is located in southwestern Taiwan (Fig. 4a). The
groundwater catchment of this region is surrounded by the Taiwan Strait (to the west) and
the Central Mountain Range (to the east), and it is broadly partitioned into the proximal
fan, mid-fan, and distal fan areas. Two major rivers flow through the alluvial fan: the
Choushui River to the north and the Peikang River to the south.
On the basis of accelerator mass spectrometry 14C (radiocarbon isotope) dating of
mollusk shells in core samples of the Choushui River alluvial fan (Central Geological
Survey, 1999), the geologic ages of core samples in the distal fan to the mid-fan could be
grouped as follows: 2,931 to 5,364 yr, 7,090 to 9,230 yr, and older than 36,400 yr.
Sedimentary formation was in the late Quaternary period and extended to a depth of
approximately 300 m (Central Geological Survey, 1999). The shallow aquitard with
depths of 0 to −55 m was deposited 3–9 ka ago during the Holocene transgression, the
middle aquitard with depths of −100 to −155 m was deposited 35–50 ka ago, and the deep
aquitard was deposited 80–120 ka ago. On the basis of subsurface hydrogeological
analysis up to a depth of approximately 300 m, the hydrogeological environment is
divided into four types of aquifers (Fig. 5): aquifer 1 with depths of 0–103 m, aquifer 2
with depths of 35–217 m (divided into 2-1 and 2-2 with depths of 35–155 m and 100–
217 m, respectively), aquifer 3 with depths of 140–275 m, and aquifer 4 with depths
exceeding 271 m (Central Geological Survey, available from
http://hydro.moeacgs.gov.tw/). Fig. 5 shows that mud layer and gravel or sand bed cross
from the top layer to the bottom layer; rock strata and mountain layer distribute from the
inland area to the coastal area.
The watershed area of the Choushui River is 3,156.9 km2 (Water Resources Agency,
available from http://www.wra.gov.tw/). The annual average water quality of the
Choushui River in 2015 is as follows: pH = 8.33, electrical conductivity (EC) = 506
μmho/cm, dissolved oxygen (DO) = 8.58 mg/L, NH4+ = 0.13 mg/L, total organic carbon
(TOC) = 1.4 mg/L, NO3− = 3.89 mg/L, Mn = 0.482 mg/L, and As = 0.0031 mg/L
(Environmental Protection Administration, available from http://www.epa.gov.tw/). The
annual precipitation in the Choushui River alluvial fan is 1,972 mm in 2015, mostly
concentrated in April to October (rainy season), and the historical yearly rainfall averages
2,366 mm (Water Resources Agency, available from http://gweb.wra.gov.tw/wrhygis/).
The amount of irrigation area of the Choushui River alluvial fan is 47,680 ha, and the
yearly irrigation water is 782.31 million ton (Water Resources Agency, available from
http://www.wracb.gov.tw/). The annual average temperature monitored by near climate
station is 24.3°C (Central Weather Bureau, Taiwan, available from
http://www.cwb.gov.tw/). The main land use of the Choushui River alluvial fan is for
agriculture, including rice cropping and upland farming, accounting for 60%, whereas the
main land use in the coastal area is for aquaculture (Fig. 6; Environmental Protection
Administration, 2014). The amount of fertilizer application in Taiwan is 347,039 ton,
including the N-containing fertilizers of 182,412 ton (Table 1; Council of Agriculture,
available from http://www.afa.gov.tw/). The average percentage of sewage permeating to
the Choushui River alluvial fan is 26.11% (Construction and Planning Agency, available
from http://www.cpami.gov.tw/). Hsu et. al (2013) reported that pumpage for non-
irrigation or irrigation purposes was regarded as known but illegal pumping was not
accounted for in the Choushui River alluvial fan. Recharge sources including rainfall,
rivers, boundary inflow, and groundwater irrigation have not been individually accounted
for in previous studies. However, Hsu et. al (2015) used groundwater storage hydrograph
and isotope analysis to estimate the pumpage and recharge of groundwater in the
Choushui River alluvial fan, and the result showed that the amount of yearly pumpage
for irrigation averaged 1.49 billion ton in 2012 to 2014, whereas that for non-irrigation
was 0.867 billion ton. The amounts of yearly average recharge from rainfall, rivers,
boundary inflow, and groundwater irrigation were 0.796, 0.682, 0.879, and 0.377 billion
ton, respectively. The yearly groundwater loss averaged 0.485 billion ton.
As, NO3−
, and NH4+ are the target contaminants in the groundwater of the Choushui
River alluvial fan. To frame a sound policy for remediation of groundwater contamination,
it is crucial to determine the sources of contaminants and understand their biogeochemical
cycling. The highest As concentration in sediments of the shallow aquifer of the Choushui
River alluvial fan was found at a depth of approximately 50 m, where the deposits of the
Holocene transgression are located (Liu et al., 2006). In 35% of the monitoring wells in
the Choushui River alluvial fan, the As concentrations exceeded the World Health
Organization guideline of 0.01 mg/L (Agricultural Engineering Research Center, 2012),
with the highest As concentration being 0.96 mg/L (Agricultural Engineering Research
Center, 2010). Lu et al. (2010) reported that the major As sinks and sources are As-bearing
iron minerals and As-bearing sulfides, and authigenic framboidal pyrite commonly
occurred in sediment of the Choushui River alluvial fan. Furthermore, in 76% of the
monitoring wells, NH4+ concentrations exceeded the quality standard (0.1 mg/L)
specified by the Taiwan Environmental Protection Administration for drinking water
sources (Agricultural Engineering Research Center, 2012). The concentrations of NO3−
and NH4+ in the groundwater of the Choushui River alluvial fan ranged from not detected
(ND) to 9.08 mg/L and from 0.02 to 15.6 mg/L, respectively (Kao et al., 2011). High
concentrations of NO3−
were found in the proximal fan, whereas high concentrations of
NH4+ were mostly detected in the distal fan (Agricultural Engineering Research Center,
2012). Notably, NH4+ concentrations of shallow wells were greater than those of deep
wells (Liu et al., 2003; Wang et al., 2007). The heterogeneous vertical distribution of
NH4+ concentrations may be attributed to the frequent local agricultural use of N
fertilizers or manure. Because groundwater pumping for crop irrigation is ubiquitous in
the local region, overpumping of groundwater and anthropogenic activities have led to
land subsidence and other adverse effects on the local environment.
The spatial distribution of NO3−, NH4+ contamination, and high As concentrations
which occurred in the Choushui River alluvial fan may not be affected by a single process.
They may be governed by multiple geochemical processes, including either the co-
precipitation or the adsorption of the reduction products, or both, that control the
mobilization of As into the reductive groundwater.
Table 1. Amount of fertilizer consumptions in Taiwan (modified from Council of Agriculture, available from http://www.afa.gov.tw/)
Fertilizer types Consumption amount (tons)
Consumption rate of elements in fertilizers Total
(tons)
Nitrogen (tons)
Phosphorus (tons)
Potassium (tons)
Chemical fertilizers 1,010,722 347,039 182,412 65,039 99,588
ammonium sulfate 144,802 30,408 30,408 - -
Diaminomethanal (Urea) 74,931 34,468 34,468 - -
potassium chloride 27,565 16,539 - - 16,539
calcium superphosphate 63,284 11,391 - - -
calcium ammonium nitrate 264 53 53 - -
potassium 5,831 2,916 - - 2,916
cyanide Calcium nitride - - - - -
floats 115 - - - -
compound fertilizer 679,091 251,264 117,483 53,648 80,133
others fertilizers 14,839 - - - -
Organic fertilizers 100,401 - - - -
animal and plant organic fertilizers
100,401 - - - -
Total 1,111,123 347,039 182,412 65,039 99,588
Fig. 4. (a) Study area and the division of the Choushui River alluvial fan into different fan regions. (b) Sampling locations of wells in the study area.
Fig. 5. Conceptual hydrogeological profile of the aquifer system in the Choushui River alluvial fan (modified from Central Geological Survey, 1986).
160000 170000 180000 190000 200000 210000 220000 2590000
2600000 2610000 2620000 2630000 2640000 2650000 2660000 2670000
Choushui river Taiwan Strait
Central Mountain
km
Peikang river
Proximal-fan Mid-fan Distal-fan
0 10 20
0 50 100 200 300 400
Elevation (m)
equipotential line
sea water
proximal fan recharge area
mountain pass Sea Level
gravel or sand bed (F aquifer)
mud layer (aquitard) groundwater flow line Mountain layer
rock strata
Sea Level
stream outlet
(a) (b)
Fig. 6. Schematic for land use in the Choushui River alluvial fan (modified from Environmental Protection Administration, Taiwan, 2014).
Other land use (traffic, public, recreation) Rice cropping
Upland farming Aquaculture Barn Ranch
Natural coniferous forest Natural broadleaf forest Natural bamboo forest Natural multiple forest Artificial coniferous forest Artificial broadleaf forest Artificial multiple forest River
Sea
Kilometers 0 5 10
160000 170000 180000 190000 200000 210000 220000
2590000 2600000 2610000 2620000 2630000 2640000 2650000 2660000 2670000
S1
S2 S3
S4 N1 N2
N3
N4 N5
N6 N7 N8
N9 N10 N11
N12 N13 N14
N15
N16 Choushui river
Taiwan Strait
Central Mountain
km
Peikang river
Proximal-fan Mid-fan
Distal-fan
0 10 20
0 50 100 200 300 400
Elevation (m)
4. Materials and methods
In order to pursue the source of NO3- and NH4+ in groundwater of Choushui river
alluvial fan, find the correlation between As and NH4+, identify the biogeochemical
cycling of As, and elucidate the complex geochemical interaction between As and N, in
this study, the mutltiple isotope analysis including δD and δ18OH2O, δ15NNO3 and δ18ONO3
are applied. Therefore, the procedures of groundwater sampling, chemical analysis and
multiple stable isotopes analysis indeed need to be well prepared.
4.1 Groundwater sampling and chemical analysis
46 groundwater samples were collected from 28 hydrological stations of Choushui
river alluvial fan in September 2015 (Fig. 4b), including 21 shallow groundwater samples
(depth ranges 0 to 100 m) and 25 deep groundwater samples (depth>100 m). All water
samples were immediately filtered through 0.2 μm Mixed Cellulose Ester (MCE)
membrane (ADVANTEC) after sampling, in order to analyze the hysical-chemical
parameters (pH, temperature (T), dissolve oxygen (DO), oxidation-reduction potential
(ORP, Eh), electrical conductivity (EC), total organic carbon (TOC), Cl-, SO42-, NO3-,
NH4+, Ca2+, Mg2+, Na+, K+ ,Fe, Mn, and As), As species (As3+ and As5+) and Fe species
(Fe2+ and Fe3+). All the physical-chemical analysis are execute in-situ or in the laboratory.
In all pretreated samples, dissolved Cl-, SO42-, NO3-, NO2-, NH4+, Ca2+, Mg2+, Na+,
and K+ present in groundwater samples were determined by ion chromatography (IC,
Dionex DX-120). Fe and Mn were determined by inductively coupled plasma optical
emission spectrometry (ICP-OES, Varian VISTA-MPX). Concentrations of As were
determined using an electro thermal atomic absorption spectrometer (AAS, Perkin-Elmer
AA100) equipped with a hydride generation (HG, Perkin-Elmer FIAS100) system.
Concentrations of As species were analyzed by inductively coupled plasma mass
spectrometer (ICP-MS, Agilent Technologies Agilent 7700x) equipped with high
performance liquid chromatography (HPLC, Agilent 1260 Infinity Quaternary LC
System). Ferrous concentration (Fe2+) will be measured colorimetrically by
spectrophotometer (Thermo GENESYS 20) using the FerroZine method.
The procedures of all chemical analysis followed the standard methods of USEPA or
Environmental Analysis Laboratory of Taiwan EPA. The in-situ measurement and
analytical results indeed provided geochemical conditions for designing laboratory
experiments.
4.2 Multiple stable isotopes analysis
The groundwater samples were filtered through 0.2 μm MCE membrane, except
those for δD and δ18OH2O which were stored without filtering. For H2O isotopic analysis,
the δD and δ18OH2O values were determined by using well-established methods (IAEA,
1983) on the high-precision isotopic water analyzer (PICARRO L2130-i) in the Institute
of Earth Sciences, Academia Sinica. The precision (1σ) is <25 per meg for δ18O (<0.025
‰) and <100 per meg for δD (<0.1 ‰). Isotope data are reported as per mill (‰) relative
to the Vienna Standard Mean Ocean Water (V-SMOW) standard.
For nitrogen isotope analysis, filtered samples for δ15NNO3 and δ18ONO3 were frozen
immediately after sampling and stored in a -20℃ room in the laboratory until just before
analysis. The samples of δ15NNO3 and δ18ONO3 in NO3- were pre-treated according to the
bacterial denitrification method of Sigman et al. (2001). This method is to culture the
denitrifying bacteria (e.g., Pseudomonas chlororaphis and P. aureofaciens) that lack
nitrous oxide (N2O) reductase, and thus N2O from NO3- to nitrite (NO2-) and nitric oxide
(NO) will not free further to dinitrogen (N2). The isotopes of N2O are then analyzed. First,
we streaked with bacteria in prepared plates, followed by incubating the bacteria in
Tryptic Soy Broth (TSB). Within these steps, it was crucial to test the bacteria for
incomplete conversion of NO3-, in order to confirm the bacteria indeed convert NO3- to
N2O, and stop by N2O. After centrifugation to concentrate cell cultures, the bacteria were
harvested. Sample vials added with concentrated cell cultures were injected with samples
of δ15NNO3 and δ18ONO3. The appropriate amount of samples is 1 to 10 mL. The δ15NNO3
and δ18ONO3 were analyzed on the continuous flow isotope ratio mass spectrometer (CF-
IRMS, Thermo Electron Delta V Advantage) in Graduate Institute of Hydrological and
Oceanic Sciences in National Central University and Research Center for Environmental
Changes in Academia Sinica. The precision (1σ) is <0.2 ‰.
The stable isotope analyses of δ15NNO3 and δ18ONO3 were helpful indicators in this
study of geochemical reactions and under varying redox conditions.
4.3 Nitrogen cycling process simulations
Major N cycling processes, including nitrification and denitrification, and the release
of As in the Choushui River alluvial fan were simulated in PHREEQC by using mainly
the physicochemical characteristics of groundwater, the concentrations of NO3−, NH4+,
As, and the values of δ15NNO3.
PHREEQC, a public software developed by USGS and based on thermodynamic
databases, belongs to a sort of geochemical programs and is widely used to perform the
calculations and simulations of geochemical reactions and transport processes in natural
and polluted water, such as aqueous model, ion exchange, surface complexation, solid
solutions, transport modeling, and inverse modeling. The program is based on the
equilibrium chemistry of aqueous solutions interacting with minerals, gases, solid
solutions, exchangers, and sorption surfaces. The specific applications are mainly the
speciation calculations and reactive transport modeling to obtain SI for calcite in river
water and groundwater (Postma et al., 2007); the calculations of speciation, mineral
saturation indices (SI), and transfer coefficients for minerals selected in inverse
geochemical modeling (Sengupta et al., 2014); the speciation analysis of groundwater
samples (Hartland et al., 2015); the equilibration run for ionic concentrations (Mapoma
et al., 2016). PHREEQC can also model various 1-D transport processes including
diffusion, advection, and dispersion. These processes can be incorporated with
equilibrium and chemical kinetic reactions (Parkhurst and Appelo 1999).
In this study, PHREEQC Interactive 3.3.11, based on the thermodynamic databases
of imm.dat, phreeqc.dat, and iso.dat, was used to assess and simulate the speciation
concentrations of N compounds and the behavior of hydrogeochemical transport of N and
As in subsurface flow pathways in the Choushui River alluvial fan.
The concentrations of NO3− and NH4+ were collected to be the major inputs while
simulating N cycling processes, using default database of imm.dat for nitrification and
phreeqc.dat for denitrification. The concentrations of As were inputted while the
simulations were evaluated toward deciphering the relation between As and NO3−
denitrification.
While simulating the occurrence of nitrification, the data of pH, Temperature (°C),
ORP (mV), and the concentrations of NO3− (mg/L), NH4+ (mg/L), DO (mg/L) were
inputted, in order to provide the information for PHREEQC to determine the redox
condition in groundwater environment. The built-in Amm.dat was selected as the
database, and then Nitrification in Rates and Kinetics was set up as well.
By contrast, for denitrification simulations, the concentrations of CH2O (mg/L),
HCO3− (mg/L) needed to be inputted besides the aforesaid parameters. The built-in
Phreeqc.dat was selected as the database. The concentrations of CH2O calculated from
TOC (mg/L) ×0.9 (Thurman, 1985) represented the carbon source for the usage of
bacteria, and they were set up in codes of solution_master_species, solution_species, and
reaction. The concentrations of HCO3− were assisted to calibrate the simulation result
(chemical reaction equilibrium) referring to Eq. (3) of denitrification reaction equation.
HCO3− is the final substance in NO3− denitrification reaction, obtaining from the analysis
of physicochemical characteristics of groundwater in this study.
For 1-D transport of N compounds of NO3−
and NH4+, the study area was divided
into three areas including the proximal fan, the mid-fan, and the distal fan. The inputs in
PHREEQC are pH, temperature, pe, DO (mg/L), Cl− (mg/L), SO42− (mg/L), NO3− (mg/L),
NH4+ (mg/L), S2− (mg/L), HCO3−
(mg/L), As (mg/L), and Fe (mg/L). The built-in
wateq4f.dat was selected as the database, and then Nitrification and denitrification in
Rates and Transport were both set up as well. The velocity of groundwater was set up as
0.01 m/day. The groundwater physicochemical characteristics of well NT-2, WT-1, and
HY-2 represent the areas of the proximal fan, the mid-fan, and the distal fan, respectively.
Moreover, the kinetic transport results of initial, one year, five years, ten years, and
twenty-five years were simulated simultaneously.
5. Results and discussion
5.1 Mixing of groundwater and extrinsic influences on groundwater
All the samples were classified into three categories on the basis of the location of
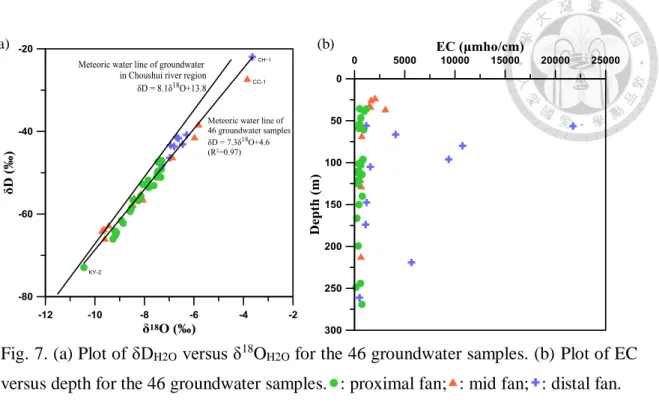
their source wells: the proximal fan, mid-fan, and distal fan. The values of δDH2O and
δ18OH2O determined for the 46 groundwater samples are summarized in Table 2 and
plotted in Fig. 7a. Fig. 7a shows the high δDH2O and δ18OH2O values observed in the distal
fan, the low δDH2O and δ18OH2O values found in the proximal fan, and the average
dispersion of the δDH2O and δ18OH2O values in the mid-fan. The δDH2O and δ18OH2O values
in the groundwater range from −72.92‰ to −21.93‰ and from −10.44‰ to −3.64‰,
respectively. The mean δDH2O values in the groundwater in the proximal fan, mid-fan,
and distal fan are −8.27‰ ± 0.83‰ (n = 23), −7.81‰ ± 1.78‰ (n = 13), and −6.51‰ ±
1.06‰ (n = 10), respectively, and the mean δ18OH2O values in the groundwater in the
proximal fan, mid-fan, and distal fan are −56.53‰ ± 6.91‰ (n = 23), −52.59‰ ± 11.60‰
(n = 13), and −41.82‰ ± 7.47‰ (n = 10), respectively. The lowest hydrogen (H) and
oxygen (O) isotope composition was observed at the sampling well KY-2 (δDH2O =
−72.92‰ and δ18OH2O = −10.44‰), and the highest H and O isotope composition was
found at the sampling well CH-1 (δDH2O = −21.93‰ and δ18OH2O = −3.64‰).
Ingraham (1998) explained the continental effect observed in precipitation, where the
heavier isotopes of vapors precipitate near the coastal area and the lighter isotopes
continue to fractionate and float toward the inland before they precipitate. Because
groundwater is mostly accumulated through the infiltration of rainwater (meteoric water),
it has isotopic signatures more or less the similar to those of local rainwater.
Fig. 7a shows the effect of mixing of upstream groundwater and downstream
groundwater. The distributions of the δDH2O and δ18OH2O values derived from the
proximal fan, mid-fan, and distal fan are distinct and successive. The H and O isotope
composition are lower in the groundwater samples of the proximal fan, and their value
increases in the downstream direction, confirming the mixing of groundwater from the
three fan regions.
The isotope analysis of δDH2O and δ18OH2O showed that CH-1 had the highest δDH2O
and δ18OH2O values (−21.93‰ and −3.64‰, respectively). In Table 3, the EC is the
highest in CH-1 among the 46 groundwater samples, reaching 21,750 μmho/cm;
moreover, the Cl− and SO42− concentrations are also the highest in CH-1, reaching 7,470
mg/L and 1,150 mg/L, respectively. These observations indicate that CH-1 is influenced
by seawater infiltration or intrusion resulting from aquaculture activity and overpumping
of groundwater. Kao et al. (2012) opined that the reason for KY-2 showing δDH2O and
δ18OH2O values markedly lower than the average values of these parameters for the wells
in the proximal fan could be the lateral boundary influx from alluvial aquifers located
between the upstream region and the downstream region of the proximal fan. Furthermore,
Kao et al. (2011) suggested that the paleo-marine environment might be responsible for
the relatively higher δDH2O and δ18OH2O values of CC-1; the high concentrations of EC,
Cl−, and SO42−, reaching 3,070 μmho/cm, 601 mg/L, and 344 mg/L, respectively, also
evidenced the existence of paleo-marine environment.
The meteoric water line of 46 groundwater samples can be formulated as δD = 7.3
δ18O + 4.6, and it is similar to the meteoric water line of the groundwater in the vicinity
of the Choushui Rive, which was reported as δD = 8.1 δ18O + 13.8 by Wang et al. (2000).
The slight offset between these two meteoric water lines can be explained by the effect
of a combination of various reactions related to evaporation, condensation, and
transportation in the local water (Sharp, 2007). Fig. 7b shows an inverse correlation of
EC versus depth (EC decreased with depth) in the aquifers of the proximal fan and the
mid-fan, suggesting the occurrence of evaporation or evapotranspiration, whereas there
is no obvious evaporation trend in the distal fan. The plot of EC versus SO42− (Fig. 8h)
also shows significant evaporation or evapotranspiration in the mid-fan. CH-1 with the
highest δDH2O and δ18OH2O values and CC-1 with the second highest values attributed to
seawater infiltration or intrusion and paleo-marine environment, respectively, were the
main causes of offset between the two meteoric water lines. Kao et al. (2011) reported
that δ18OH2O values of salinized groundwater were averagely greater than those of non-
salinized groundwater, causing the meteoric water line to offset towards the right side
against the original one.