國立臺灣大學生物資源暨農學院動物科學與技術學系 碩士論文
Department of Animal Science and Technology College of Bioresources and Agriculture
National Taiwan University Master Thesis
探討高脂飲食引起的脂肪組織胰島素阻抗 與細胞自噬間之關聯性
The Role of Autophagy in High-Fat Diet Induced Insulin Resistance of Adipose Tissues
李宜軒 Yi-Hsuan Li
指導教授:邱智賢、吳兩新 博士
Advisor: Chih-Hsien Chiu, Leang-Shin Wu, Ph.D.
中華民國 108 年 7 月
July 2019
致謝
時光荏苒,歲月如梭,當年在大實驗室裡頭戰戰兢兢的我,如今也已逐步地完成 碩士學位。這兩年的求學期間如雲霄飛車般跌宕起伏,每每在低谷時,我總會反覆 地詢問自己究竟為什麼要選擇繼續進修,尤其是剛踏入研究所的前半年。然而此時 此刻,我萬分地感謝當初的抉擇,讓我擁有數年來最充實的兩年生活。不僅在學術 研究和實驗技術上的提升,還學習到許多做人處事的道理以及開闊眼界。種種的歷 程都要感謝當年在選擇實驗室時遇到了沐恩學長,雖然當時學長分享的許多想法 我都聽得一知半解,但知識的衝擊實在太有魅力。加上後續與老師的面談,以及實 驗室良好的氛圍,使我毅然決然地加入生理研這個大家庭。
首先要感謝我的指導教授邱智賢老師,在研究上給予我許多的建議及想法,並提 供資源予以我不斷地嘗試。此外,老師不斷的鼓勵也使得缺乏自信的我更加勇於挑 戰。感謝我的指導教授吳兩新老師,總是仔細地檢查我的摘要、簡報及論文上的大 小細節,並提供許多可能在專題討論中會面臨的問題,使得我在準備專討上更加游 刃有餘。感謝鍾德憲老師在我剛入學的期間,時常撥空指導我如何研讀科學文章,
還提供我一些書籍以惡補過去未曾接觸的知識領域,並提點許多我研究上的盲點,
使這份論文更加地完整無缺。
感謝實驗室的大家,這兩年的日子有你們的陪伴真好。謝謝沐恩學長手把手地從 零開始教導我,即使在當兵期間仍不斷地關心我的實驗進度。謝謝孟傑學長、黃謙 學長和秀如學姊,不厭其煩地指導我許多實驗技術,還時常關心我的實驗狀況並撥 空與我討論。謝謝怡君學姐、皓儀學姐、恩加學長、沛祺學姐和思芃學姐在碩士班
這兩年的關照,另外還感謝逸凡學長在每次的meeting 上予以我不同面向的建議。
謝謝正軒、張珉、于翔和助理們一同維持良好的實驗室環境。
最後,感謝疼愛我的家人們不間斷地給予我支持與鼓勵,使我能專心致志、樂觀 進取地完成學業,毫無後顧之憂。因為有你們,才有堅持至此的我以及這本論文,
我愛你們!
中文摘要
第二型糖尿病(Type 2 diabetes, T2D)是一種由周邊組織胰島素阻抗(insulin resistance)造成血糖濃度異常升高的代謝疾病,而肥胖(obesity)是目前公認此疾 病之主要危險因子。過多的能量攝取容易造成脂肪組織胰島素阻抗,使得細胞內脂
解作用增加而大量釋出游離脂肪酸,進而影響其他組織代謝並誘發 T2D。細胞自
噬(autophagy)是細胞內重要的降解系統之一,參與許多代謝調節及壓力反應。近 期許多研究指出肥胖或代謝疾病患者,其脂肪組織的自噬狀態會改變,然而自噬在 肥胖所誘導的胰島素阻抗之角色,仍未完全明瞭。
本研究首先以高脂飼糧誘導的肥胖小鼠模式,瞭解其脂肪自噬之活性,並同時藉
由注射胰島素以評估胰島素阻抗發生之時間點。試驗結果顯示,持續16 週的高脂
飼糧會引發 C57BL/6 小鼠的脂肪組織有自噬後期抑制、胰島素阻抗、內質網壓力
(ER stress)以及細胞凋亡(apoptosis)的現象,同時也發現 Rubicon 的表現量增 加,可能為阻斷自噬後期的因素之一。為了進一步確認自噬後期的抑制是否會誘發 胰島素阻抗,我們直接對小鼠的附睪脂肪組織注射自噬後期的抑制藥物氯喹
(chloroquine, CQ)。結果發現注射 CQ 後 10 小時,脂肪組織的胰島素訊息傳遞路
徑並未受影響;但注射後24 小時,脂肪組織的胰島素下游標的 Akt 及 GSK3β 的
磷酸化程度卻下降,顯示自噬作用的抑制與胰島素阻抗的發生具相關性。另外,我
們測定了胰島素訊息的負調節因子 PHLPP1 及 PTEN 的蛋白質表現量,然結果顯
示注射CQ 的組別,兩種蛋白質皆無顯著增加,意味著自噬抑制阻斷的胰島素下游
訊息傳遞,與PHLPP1 及 PTEN 的作用路徑無關。
此外,我們也利用分化的 3T3-L1 脂肪細胞株進行體外試驗,經由棕櫚酸(palmitic acid)及油酸(oleic acid)共處理 48 小時後,細胞內油滴大量堆積並引起自噬流
(autophagic flux)的降低,表示自噬作用是受到抑制的。隨後以 CQ 處理 24 小時,
亦觀察到胰島素阻抗、內質網壓力及細胞凋亡的情形。然而為了摒除如細胞凋亡等
機制之影響,我們將CQ 的處理濃度降低,卻並未造成細胞的胰島素訊息傳遞之異
常。不過有趣的是,若處理時間延長至48 小時,此時脂肪細胞便會發生胰島素阻 抗,並伴隨著內質網壓力與細胞凋亡的現象。由此可知,自噬後期的抑制本身可能 並非直接誘發脂肪細胞的胰島素阻抗,而是經由併發的內質網壓力或細胞凋亡間 接所致。
綜上所述,長期的高脂飲食除了促使脂肪組織發生胰島素阻抗外,還導致 Rubicon 的表達增加進而抑制自噬後期,並伴隨著內質網壓力及細胞凋亡等現象。
其中自噬後期的抑制與胰島素敏感性下降具有相關性,然而前者並非經由磷酸酶 的大量表現影響胰島素訊息的傳遞,而是藉由內質網壓力或細胞凋亡間接引起脂 肪組織的胰島素阻抗。
關鍵字:肥胖;高脂飲食;細胞自噬;胰島素阻抗;內質網壓力;細胞凋亡
Abstract
Type 2 diabetes is a metabolic disease with abnormally elevated blood glucose level due to insulin resistance in peripheral tissues, and obesity is recognized as a risk factor for this disease. Excessive calorie intake may lead to insulin resistance and increase free fatty acid releasing from adipose tissue. This situation may alter the metabolic functions of other peripheral tissues to accelerate the development of type 2 diabetes. Autophagy is an intracellular degradation system, which is important for maintaining metabolic homeostasis. Recent studies have demonstrated that the autophagic flux is changed in the adipose tissue of patients with obesity or metabolic disease. However, the role of autophagy in obesity-induced insulin resistance is less clear.
In this study, we first confirmed the state of autophagy and insulin signaling in adipose tissue from high-fat diet (HFD)-fed C57BL/6 mice. The results showed late-stage autophagy inhibition, insulin resistance, endoplasmic reticulum (ER) stress and apoptosis in the adipose from mice fed with 16-week HFD. Importantly, the increased level of Rubicon was one of the factors blocking the late-stage autophagy. To clarify whether inhibiting autophagy mediates HFD-induced insulin resistance, mouse epididymal adipose was locally injected with chloroquine (CQ), a late-stage autophagy inhibitor. We found that autophagy inhibition prominently caused insulin resistance in adipose tissue.
Additionally, results demonstrated that the cascade of phosphorylation events in insulin
signaling pathway blocked by CQ are independent of PHLPP1 and PTEN.
Furthermore, the differentiated 3T3-L1 adipocyte was used for in vitro experiment.
After co-treatment with palmitic acid and oleic acid for 48 hours, a large amount of lipid droplets accumulated and caused a reduction in autophagic flux, indicating that autophagy was inhibited. Subsequently, treatment with CQ (40 μM) for 20 hours also observed insulin resistance, ER stress and apoptosis. However, when the concentration of CQ was reduced to prevent apoptosis, no significant abnormality in the insulin signaling was observed in the first 24 hours. Interestingly, if the treatment period was extended to 48 hours, the insulin resistance occurred in the 3T3-L1, accompanied by ER stress and apoptosis. It implied that late-stage autophagy inhibition didn’t directly lead to insulin resistance, but indirectly by other pathways.
In summary, long-term high-fat diet promotes insulin resistance, late-stage autophagy inhibition, ER stress and apoptosis in adipose tissue. Among these conditions, inhibition of late-stage autophagy is indeed related to a decrease in insulin sensitivity.
However, autophagy suppression does not affect the insulin signaling transduction via the large amount of phosphatase expression, but causes insulin resistance indirectly through ER stress or apoptosis.
Keywords: Obesity; High-fat diet; Autophagy; Insulin resistance; ER stress; Apoptosis
Table of Contents
口試委員會審定書 ... I 致謝 ... II 中文摘要 ... III Abstract ... V Table of Contents ... VII Figure Index ... IX Table Index ... X
Chapter 1. Literature Review ... 1
1.1 Type 2 diabetes and obesity ... 1
1.2 Autophagy in adipose tissue with obesity ... 6
1.3 The relationship between autophagy and insulin resistance ... 17
1.4 The aims of this study ... 23
Chapter 2. Materials and Methods ... 24
2.1 Animal and handling ... 24
2.2 Cell culture ... 25
2.3 Protein sample preparation and Western blotting analysis ... 26
2.4 Nile red staining ... 29
2.5 RNA extraction and qPCR analysis ... 29
2.6 Serum free fatty acid content analysis ... 31
Chapter 3. Results ... 35
3.1 HFD induces autophagy impairment, insulin resistance, endoplasmic reticulum (ER) stress and apoptosis in adipose tissue ... 35
3.2 The late-stage autophagy inhibition correlates with insulin resistance in adipose tissue ... 43
3.3 The phosphorylation of insulin signaling blocked by autophagy is independent of PHLPP1 and PTEN ... 47
3.4 Impaired late-stage autophagy may cause insulin resistance indirectly by ER stress or apoptosis ... 51
Chapter 4. Discussions ... 59 4.1 HFD induces autophagy impairment, insulin resistance, endoplasmic reticulum (ER) stress and apoptosis in adipose ... 60 4.2 The late-stage autophagy inhibition correlates with insulin resistance in adipose ... 62 4.3 The phosphorylation of insulin signaling blocked by autophagy is independent of PHLPP1 and PTEN ... 63 4.4 Impaired late-stage autophagy may cause insulin resistance indirectly by ER stress or apoptosis ... 65 Chapter 5. Conclusion ... 67 References... 68
Figure Index
Figure 1. Adipose tissue dysfunction in obesity is related to impaired metabolic health.
... 5
Figure 2. Three major types of autophagy. ... 9
Figure 3. Regulation of autophagy induction by the TOR and AMPK complex. ... 11
Figure 4. The molecular mechanism of macroautophagy in mammalian cells. ... 13
Figure 5. Insulin intracellular signaling pathway... 19
Figure 6. Altered autophagy in adipose tissues from mice fed with 8-week HFD. .... 38
Figure 7. Altered autophagy in adipose tissues from mice fed with 16-week HFD. .. 39
Figure 8. Insulin resistance in adipose tissues from mice fed with 16-week HFD. ... 40
Figure 9. HFD induced ER stress and apoptosis in adipose tissues of mice. ... 41
Figure 10. Free fatty acids (FFAs) impaired the autophagic flux in differentiated 3T3-L1 adipocytes. ... 42
Figure 11. The insulin signaling pathway was still normal after chloroquine (CQ) treatment for 10 hours... 44
Figure 12. Autophagy is required for insulin signaling transduction in adipose tissue.45 Figure 13. The suppression of late-stage autophagy may have feedback effect which resulted in reduced mRNA level of LC3B. ... 46
Figure 14. Autophagy may regulate insulin-stimulated signal transduction independently of PHLPP1. ... 49
Figure 15. Autophagy may regulate insulin-stimulated signal transduction independently of PTEN. ... 50
Figure 16. Autophagy inhibition and insulin resistance were found in 3T3-L1 after CQ treatment for 24 hours... 54
Figure 17. ER stress and apoptosis were also found in 3T3-L1 after CQ treatment for 24 hours. ... 55
Figure 18. Dose response experiment of CQ treatment in 3T3-L1 cells. ... 56
Figure 19. Low dose of CQ had no effect on insulin signaling transduction. ... 57
Figure 20. Insulin resistance, ER stress and apoptosis were observed in 3T3-L1 after 20 μM CQ treatment for 48 hours. ... 58
Table Index
Table 1. The formulas of diets used in animal studies ... 32 Table 2. The antibodies used in the study ... 33 Table 3. The primer pairs used in qPCR analysis ... 34
Chapter 1. Literature Review
1.1 Type 2 diabetes and obesity
Diabetes mellitus (DM) is a metabolic disease caused by deficiency in production of insulin, or by the ineffectiveness of the insulin. Such a deficiency results in increased concentrations of glucose in the blood, which known as hyperglycemia. According to the statistics from World Health Organization (WHO), the global prevalence of DM in 2014 accounted for 8.5% in adult population, which had nearly doubled since 1980 (WHO, 2016). Additionally, the data provided by the Ministry of Health and Welfare showed that DM was the fifth leading cause of death in 2018, and nearly ten thousand people die each year from diabetes in Taiwan. This situation points out that the effect of DM on health should not be underestimated, and its medical burden is also quite large.
1.1.1 Types of diabetes
There are three major forms of diabetes: type 1, type 2 and gestational diabetes. Type 1 diabetes (T1D), known as insulin-dependent diabetes mellitus (IDDM), is characterized by a lack of insulin production in the body due to the destruction of insulin producing β cells in the pancreas. Patients with T1D require daily insulin administration to balance their blood glucose levels, and common symptoms include increased thirst and urination, constant hunger, fatigue, blurred vision and weight loss, which can start quickly in a few
weeks (NIDDK, 2016; WHO, 2016). Unlike T1D, the hyperglycemia in patient with type 2 diabetes (T2D) is caused by decreased insulin sensitivity of peripheral tissues, which is known as insulin resistance. Thus, T2D is also called non-insulin-dependent diabetes mellitus (NIDDM). The symptoms of T2D are similar to T1D; however, compared with T1D, they often develop slowly over the course in several years, and are less significant or absent. As a result, some people are undiagnosed with this disease until they have diabetes-related health problem. This situation makes early diagnosis and prevention of T2D more difficult. The last, gestational diabetes (GDM) is a temporary condition that occurs in some pregnant women. The blood glucose levels of GDM patients are higher than normal but below the value defined by diabetes. However, these people with GDM will carry the long-term risk of T2D. Among all diabetes types, T2D accounts for 90 to 95% of people with diabetes around the world. Due to both the proportion of problem and the current epidemic growth of T2D, it is a priority to clarify the pathogenesis and the approaches to prevent and treat this disease (Cheng, 2005; Rubino, 2008).
1.1.2 The risk factors for T2D
Many study indicate T2D is caused by an interaction of genetic and lifestyle factor.
Family history, overweight and obesity, unhealthy diet, physical inactivity and smoking all increase the risk of developing T2D. Although varied factors may be involved,
approximately 90% of people with T2D are overweight or obese (Whitmore, 2010). Feller et al. (2010) pointed out not only higher body mass index but higher waist circumference
is associated with increased threat of T2D. Besides, other scholars have proposed that people with high percentage body fat have about 2.7 times risk for T2D development (Mohammed, 2017). All in all, no matter which indicators are, we can know that obesity is regarded as a prominent factor in its development. In general, the principal causes of obesity are inactivity and unhealthy diet, while the latter includes excessive total fat intake, high intake of saturated fatty acids, and so on. Because of changes in dietary components and habits today, the prevalence of obesity caused by excessive energy intake and nutritional imbalance is increasing (Swinburn et al., 2011). Therefore, understanding the mechanism of obesity causing T2D is of critical importance.
1.1.3 Progression of T2D in adipose tissue
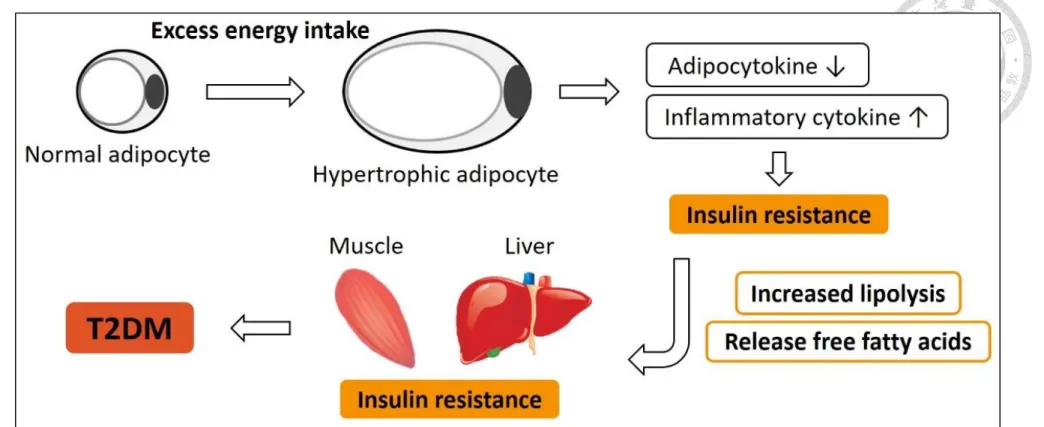
Excess energy intake, such as high-fat diet consumption, causes a large amount of lipids to accumulate in adipose tissues and results in hypertrophic adipocytes. Adipocyte hypertrophy in obesity is accompanied by a series of complicated pathological conditions, such as the underproduction of some adipocytokines, especially the insulin sensitizers, which in turn impairs insulin sensitivity, and the overexpression of some inflammatory cytokines that make the adipocyte become dysfunction. When insulin resistance occurs,
the lipolysis of adipose tissues increases and plenty of free fatty acids are released abnormally (Figure 1). Particularly in visceral adipose tissue, because Langin et al. (2009) stated that adipocytes in visceral tissues have higher rate of lipolysis than subcutaneous adipose and this lipolysis is less easily inhibited by insulin.
Increased delivery of free fatty acids into systemic circulation causes fatty acids or fatty acid derivatives accumulate in liver. This further affects the metabolic capacity of liver cells and lead to insulin resistance (Bay et al., 2004; Goossens and Blaak, 2015). In addition, Golay and Ybarra (2005) indicated that increased lipid oxidation due to high plasma free fatty acid levels causes insulin resistance indirectly in muscle. Because muscles preferentially use lipids as an energy resources, the use of glucose from the glycogen stores and the glycogen synthase activity are limited. To compensate for such inhibition, hyperglycemia and hyperinsulinemia occur, which are the symptoms of prediabetes. Taken together, the decrease in insulin sensitivity of adipose tissues has a great influence on other metabolic tissues, like liver and muscle. Therefore, this study focused on investigating the mechanisms that trigger insulin resistance in adipose tissue.
Figure 1. Adipose tissue dysfunction in obesity is related to impaired metabolic health.
(Image modified from Goossens and Blaak, 2015)
1.2 Autophagy in adipose tissue with obesity
1.2.1 Function of adipose tissue
Adipose tissue is a loose connective tissue that is distributed under the skin and around the viscera to provide structural support and protection between organs and tissues.
Additionally, adipose tissue not only has the function of fat storage, but also releases some adipocytokines to regulate systemic metabolism. Thus, it is recognized as an endocrine organ (Kershaw and Flier, 2004). All mammals possess two types of adipose, white adipose tissue (WAT) and brown adipose tissue (BAT), and the adipocyte we generally refer to is the former. The latter is mainly found in infants and hibernating animals, and is rare in adults. Brown adipocytes are small in size and have high concentration of mitochondria for energy production and angiogenesis of tissues.
Under the interaction of genetic and environmental factors, sustained positive energy balance can cause adipocyte hypertrophy or hyperplasia, allowing WAT to accumulate more lipids. Generally, increasing adipocyte number is typical associated with normal adipose tissue function. However, the number of fat cells changes only in children and adolescence, and remains stable in adulthood. Hence, the majority of obese patients respond to continued positive energy balance by adipocyte hypertrophy, which is related to pathogenic factors like insulin resistance causing adipose tissue dysfunction (Björntorp and Sjöström, 1971; Klöting and Blüher, 2014).
In regard to the mechanism may be involved, some precious studies have confirmed that autophagy, an intracellular degradation system, is changed in adipose tissue from the patients with obesity or metabolic disease. Nevertheless, there is no unifying hypothesis that explains the various states of autophagy in adipose associated with obesity.
1.2.2 Types of autophagy
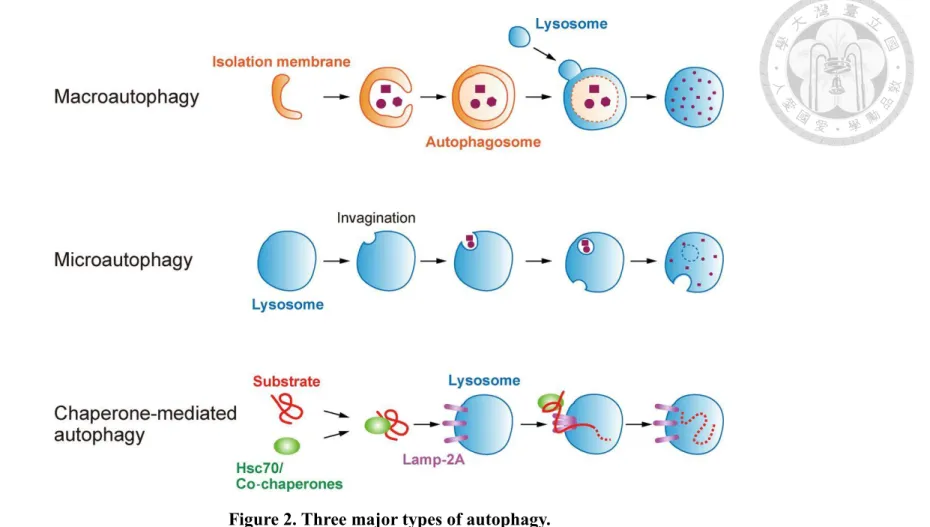
Autophagy, which literally means "self-eating", is a highly conserved process in eukaryotes. This process is an intracellular degradation system that delivers cytoplasmic components to lysosome. There are three major forms of autophagy: macroautophagy, microautophagy and chaperone-mediated autophagy (CMA), and the mechanism in each types are different from each other (Figure 2). In macroautophagy,
part of the cytosol and dysfunctional organelles are sequestered by the elongating phagophore, expanding to become the double-membrane bound autophagosome.
Subsequently, the autophagosome fuses with lysosome to form an autolysosome.
Eventually, the cargos are degraded by lysosomal hydrolases, and some molecules are transported back to cytosol for reuse. By contrast, during microautophagy the cargos are transported into lysosome by direct vesicle invagination (Yang and Klionsky, 2009). Both of the above autophagic pathways can be nonselective or selective. Nonselective autophagy is important for starvation adaptation, which is used for the turnover of
cytoplasm, while selective autophagy is specific for damaged or unused organelles, including mitochondria, peroxisomes and foreign pathogens. Each target involve in a different mechanism with a unique name to be identified. For instance, mitophagy is the selective degradation of mitochondria by autophagy; the function of pexophagy is to degrade peroxisomes, and xenophagy is for invasive pathogens (Feng, 2013). In contrast to macro and microautophagy, CMA doesn’t require the dynamic membrane rearrangement, but directly translocates the substrate into the lysosomal lumen through the membrane mediated by the translocation protein complex. Because of the distinctive features of transportation, only soluble proteins can be degraded via CMA (Cuervo, 2010).
About these types of autophagy, the term “autophagy” generally refers to macroautophagy unless otherwise stated. Autophagy has many physiological roles in cells, including environmental adaptation, cell differentiation, growth regulation, cell defense, etc (Li et al., 2012). Therefore, either excessive performance or dysfunction of process can be harmful to cells.
Figure 2. Three major types of autophagy.
(Image courtesy of Okamoto, 2014)
1.2.3 The mechanism of autopahgy
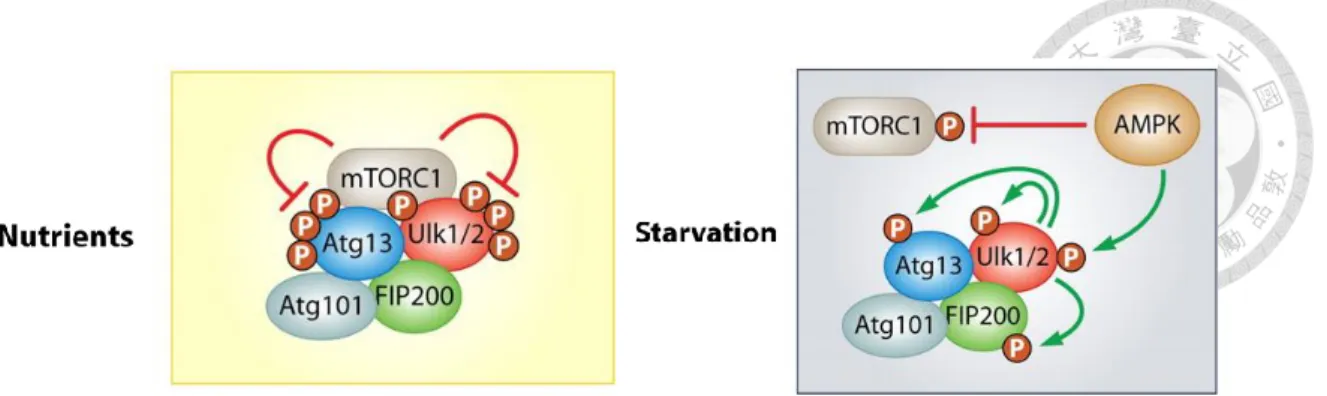
When the cells facing starvation or various other stresses, the activity of autophagy increases above the basal levels, and is induced by the interaction of mammalian target of rapamycin (mTOR) and 5’ AMP-activated protein kinase (AMPK) (Hoyer-Hansen and Jaattela, 2007). The mTOR protein binds to several different partners to functionally distinct complexes such as mTOR complex 1 and 2 (mTORC1 and mTORC2). The former consists of mTOR, mammalian lethal with SEC13 protein 8 (mLST8), proline- rich Akt substrate of 40 kDa (PRAS40) and the regulator-associated protein of TOR (Raptor) as participant in autophagy regulation. As observed in normal cells, the low basal levels of autophagic activity are maintained by mTORC1, which phosphorylates unc-51 like autophagy activating kinase 1 and 2 (ULK1 and ULK2) to inhibit the induction of phagophore formation (Alers et al., 2012). Furthermore, AMPK is activated by increased intracellular AMP/ATP ratio under low energy conditions to induce autophagy. Activated AMPK phosphorylates its downstream targets, ULK1, and suppress mTORC1 by phosphorylating Tuberous Sclerosis Complex 2 (TSC2) and Raptor (Egan, 2011). Thus, under starvation, the mTORC1-dependent phosphorylation site (Ser757) of ULK1 is dephosphorylated, and ULK1 is activated by AMPK phosphorylation or autophosphorylation on multiple sites (Figure 3).
Figure 3. Regulation of autophagy induction by the TOR and AMPK complex.
(Image courtesy of Alers et al., 2012)
In mammals, ULK1 plays an essential role in the early-stage induction of autophagy.
Some proteins are required to act on the membrane source during autophagosome formation. At this point, activated ULK1 translocates to the membrane to activate other functional complexes such as Beclin 1-VPS34-p150 complex, thereby initiating the nucleation step. The class III PI 3-kinase VPS34 binds to the phagophore membrane by p150 that anchored to the membrane by myristic acid, and combines with Beclin 1, is critical of phospholipid kinase activity, to generate PI3P, which is essential for the recruitment of factors involved in the formation of autophagosome. In addition, Beclin 1 also combines with UV radiation resistance-associated gene protein (UVRAG) and Beclin 1-associated autophagy-related key regulator (Barkor) to maintain the stability of the Beclin 1-VPS34 complex (Abounit et al., 2012).
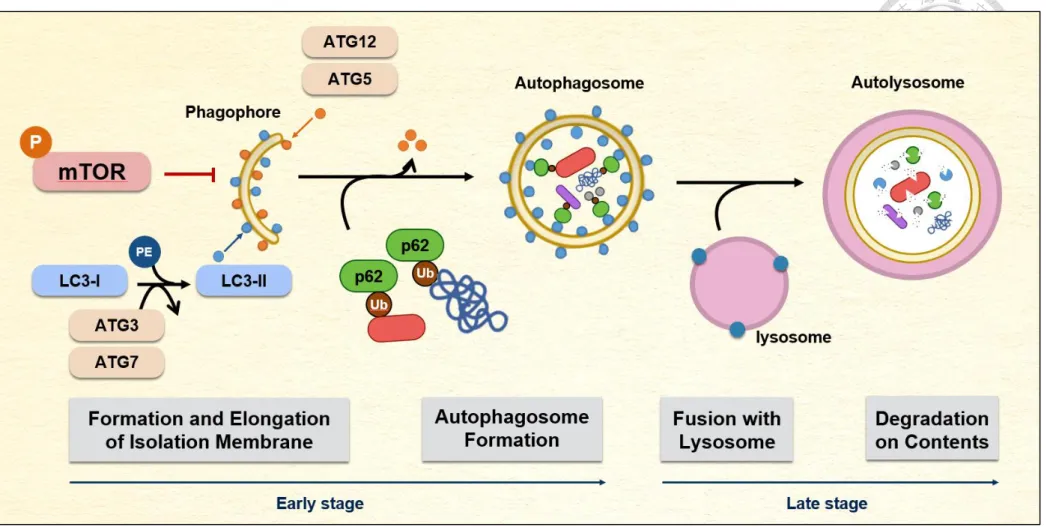
During autophagosome biogenesis, two ubiquitin-like systems, LC3 processing and Atg5-Atg12 conjugation, are associated with expansion of phagophore membrane. LC3
is positioned on the membrane after post-translational modifications. The C-terminal end of the cytosolic form LC3-I is cleaved by Atg4, which is then activated by Atg7 and transferred to Atg3. Finally, a phosphatidylethanolamine (PE) will be conjugated to LC3- I to form LC3-II by Atg3 (Kebeya et al., 2004; Hanada et al., 2007). On the other hand, activated Atg12 covalently links Atg5 to form an irreversible conjugate that is localized on the phagophore by binding to Atg16. The Atg5-Atg12-Atg16 complex promotes the formation of LC3-II (Romanov et al., 2012). In addition to participating in autohagosome formation, LC3-II also has the function of recognizing autophagic cargoes. It acts as a receptor to interact with the adaptor on the targets to promote their uptake and degradation.
One of the best-characterized adaptor molecules is p62/SQSTM1, a multifunctional adaptor which promotes the turnover of ubiquitinated substrates (Glick et al., 2010). After expansion of phagophore membrane and cargo engulfment, mature autophagosome fuses with lysosome to form autolysosome for cargo degradation (Mizushima, 2007).
In general, the autophagic process is roughly divided into early stage and late stage.
The steps before autophagosome maturation are defined as early-stage autophagy, including signaling induction as well as phagophore formation and extension; and the late stage of process is from the closure of autophagosome to fusion with the lysosome (Noda et al., 2009) (Figure 4).
Figure 4. The molecular mechanism of macroautophagy in mammalian cells.
(Image modified from Noda et al., 2009)
1.2.4 Assays for monitoring autophagy
In the early years, transmission electron microscopy (TEM) is a common and important method for observing various autophagic structures (Eskelinen et al., 2011).
Additionally, quantitative analysis of LC3 lipidated form (LC3-II) is considered to be the basis for assessing autophagosome formation due to its localization on autophagosome membrane. And the reduction of SQSTM1/p62, a cargo adaptor protein for autophagic degradation of protein aggregates and organelles, is also an indicator (Klionsky et al., 2016). It is worth noting that autophagy is a highly dynamic process, so it is not sufficient to monitor only the static levels of autophagy specific markers such as LC3 or p62 to determine autophagy activity. For example, It is difficult to distinguish between the activation of autophagy and blockade in autophagosome turnover by the accumulation of LC3-II. Hence, measuring “autophagic flux” has driven the development of modified approaches to detecting autophagy activity (Barth et al., 2010). The most common method is to use autophagy inhibitors such as bafilomycin A1 or chloroquine to compare LC3-II before and after the suppression for evaluating the autophagic flux. Both bafilomycin A1 and chloroquine are known inhibitors of late-stage autophagy, the former by inhibiting vascular H+ ATPase, and the latter by inducing disorganization of the Golgi and endo-lysosmal systems to cause damaged fusion between autophagosome and lysosome (Yamamoto et al., 1998; Mauthe et al., 2018). However, most studied on the
autophagy activity in adipose tissues from obese patients or mice have been determined only by several autophagy-related protein expressions.
1.2.5 Autophagy in adipose tissue
Many studies have shown that autophagy changing is observed in adipose tissue from the people or mice with obesity, but the results are quite inconsistent. In the study performed by Jansen et al. (2012), autophagic activity levels were increased in adipose tissue of obese human as compared with lean human through the elevated level of autophagy marker LC3. Similar to findings of Nunez et al. (2013) in obese mice and human, the expression of Beclin 1 was increased in the adipose tissue; moreover, p-mTOR was significantly lower in obese mice, which meant that autophagy may be enhanced. But the increment of p62 expression in adipose tissues from obese mice is contradictory to their conclusion, because the cargo protein should be decreased as the autolysosome degradation. As the levels of p62 were also elevated twofold in obese versus lean adipocytes in the study of Soussi et al. (2015), indicative of lower autophagic degradation.
Meanwhile, the rate of autophagosome accumulation, i.e. autophagy flux, was evaluated by autophagy inhibitors chloroquine, leupeptin/NH4Cl or bafilomycin A1. In the presence of inhibitors, the accumulation of LC3-II in adipocytes from non-obese human was evident, whereas obese patients were almost undetectable. Quantitative analysis of LC3-
II accumulation rates demonstrated that autophagic clearance of adipocytes was reduced in obesity. Nevertheless, there was also opposite opinion about the change in autophagic flux. Kovsan et al. (2011) confirmed the number of autophagosome was increased and autophagic flux elevated in adipose tissue from obese people, especially in omental adipose. Based on the above results, the effect of obesity on the autophagy in adipose tissue is not identical, which may be related to the difference in cell types in adipose (Singh et al., 2009; Soussi et al., 2016) or the severity of symptoms. Consequently, this study will investigate the state of autophagy in adipose tissue via in vivo and in vitro experiments, and further understand whether it is associated with the previously mentioned mechanisms that trigger insulin resistance in adipose tissue.
1.3 The relationship between autophagy and insulin resistance
Insulin resistance is clinically defined as the fact that exogenous or endogenous insulin doesn’t increase glucose uptake and utilization compared to the normal population, since cells fail to respond normally to the insulin. Insulin signaling in cells is a process in which insulin interacts with receptor on the plasma membrane and is transmitted through a series of protein-protein interactions, that is mainly involved in the regulation of intermediary metabolism and growth processes (Lebovitz, 2001).
1.3.1 Insulin signaling pathway
The molecular mechanism is shown in Figure 5. Insulin receptor is activated by ligands such as insulin or insulin-like growth factor 1 (IGF-1) and initiates a cascade of phosphorylation events. Receptor conformational changes and autophosphorylation lead to receptor substrates like SHC-transforming protein (Shc) and insulin receptor substrate (IRS) being recruited and phosphorylated. IRS proteins activates the PI3K-Akt pathway by recruiting and activating phosphoinositide 3- kinase (PI3K) to enable the generation of the second messenger phosphatidylinositol 3,4,5-triphosphate (PIP3), which is derived from phosphorylated phosphatidylinositol 4,5-bisphosphate (PIP2). PIP3 recruits and activates phosphoinositide-dependent kinase-1 (PDK-1), that phosphorylates downstream Akt and protein kinase C (PKC). Akt mediates most of the intermediary
metabolism by phosphorylating different downstream proteins, including Tre- 2/Bub2/Cdc 1 domain family (TBC1D) for glucose transport, Glycogen synthase kinase 3 (GSK3) for glycogen synthesis, and forkhead box O protein (FoxO) for gluconeogenesis and lipid synthesis. Akt also plays a role in the regulation of cell cycle and survival. Moreover, Shc activates the Ras-MAPK pathway to control cellular proliferation and gene transcription (Boucher et al., 2014). Some studies have shown that the pathway regulating intermediary metabolism is significantly diminished in the development of T2D, whereas that controlling growth process is normal.
Figure 5. Insulin intracellular signaling pathway. (Image courtesy of Boucher et al., 2014)
1.3.2 The mechanisms involved in insulin resistance
Recent studies have indicated extracellular disturbances such as nutrient excess inflammation, or hyperinsulinemia cause intracellular stress (e.g. endoplasmic reticulum stress, mitochondrial dysfunction, increased reactive oxygen species and so on) in adipose tissues, and these may damage the ability of these cells to perform normal metabolic actions on insulin (Fazakerley et al., 2018). Regarding the mechanism of participation, Hotamisligil’s study (2008) suggested that intracellular endoplasmic reticulum (ER) stress-induced insulin resistance was dependent on the activation of c-Jun N-terminal kinase (JNK), an inflammatory serine kinase, thereby directly inhibiting phosphorylation of IRS (Solinas and Becattini, 2016). Furthermore, the production of reactive oxygen species (ROS) led to activation of nuclear factor-κappa B (NF-κB) pathway, and it induce the expression of inflammation-related genes such as TNF-α, MCP-1 and IL-1β. Among them, TNF-α inhibited IRS-1 in the insulin signaling pathway by its p55 receptor (Peraldi et al., 1996; Pahlavani et al., 2017). Collectively, these molecular mechanisms strongly confirmed that intracellular stresses caused by changes in the microenvironment of tissues can impair insulin signaling pathway.
1.3.3 The role of autophagy in insulin resistance
With regard to these intracellular stresses, some studies have identified that autophagy plays an important role in regulation. Yin et al. (2015) stated that ER stress may cause autophagy activation in adipocytes to making an adaptive response to extracellular disturbances. Such as limiting the expression of inflammatory cytokines to slow down the inflammatory response, or degrading the insulin receptor damaged by ER stress (Zhou et al., 2009), thereby further alleviating the deterioration of insulin resistance.
In addition, Novak (2012) also pointed out that activation of autophagy maintained the mitochondrial health of cells by removing impaired or aged mitochondria, especially those capable of producing dangerous levels of ROS.
However, all of the above were presupposed that the autophagy was still normal in the cells, but in the study of Soussi et al. (2015), the autophagy in adipocytes from obese patients may be damaged. About the relevance between impaired autophagy and insulin resistance, it was known in Guo et al. (2017) that Atg7 knockdown in 3T3-L1 adipocytes caused a reduction in the phosphorylation capacity of insulin receptor β subunit and IRS- 1 stimulated by insulin. Moreover, Cai et al. (2018) also found that Akt wasn’t activated by insulin in the white adipose tissue from AdiAtg3KO mouse model, indicating that the inhibition of early-stage autophagy accelerated the decline in insulin sensitivity. The physiological function of damaged autophagy in adipose is less clear, including the role
played in the development of insulin resistance.
In previous study in our laboratory, high-fat diets can induce autophagy impairment and insulin resistance in mouse liver. More importantly, it was also observed that reactivation of autophagy restored the decrease in insulin sensitivity, depend on mitigating Rubicon-suppressed late-stage autophagy in hepatic cells (Wang et al., 2017).
Additionally, it was also known that the occurrence of insulin resistance in adipose tissues in this animal model. So this study would further investigate the role of autophagy in high-fat diet-induced insulin resistance and the possible molecular mechanisms involved in adipose tissue.
1.4 The aims of this study
Based on the literature mentioned above, we would investigate the following three purposes in this study. First, we proposed to confirm the effect of HFD on autophagy and insulin signaling transduction from adipose tissue. Second, we would like to clarify whether altered autophagy mediated HFD-induced insulin resistance. And last, if autophagy was involved, we would try to elucidated the possible mechanisms in autophagy-regulated adipose insulin sensitivity.
Chapter 2. Materials and Methods
2.1 Animal and handling
2.1.1 High-fat diet-induced T2D in mice
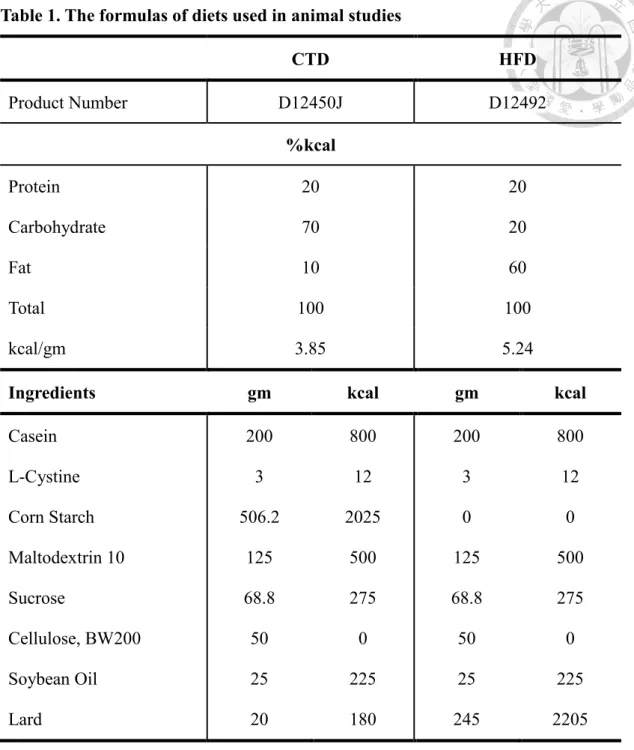
8-week-old male C57BL/6 mice, obtained from the Laboratory Animal Center, College of Medicine, National Taiwan University, were housed at 25 ± 2℃, approximately 50-60% relative humidity, with a 12-hour light/12-hour dark cycle. After one month of growth and adaptation, all mice were randomly grouped and freely accessed to control diet (CTD) or high-fat diet (HFD) for 8 and 16 weeks. The CTD and HFD were commercially available diets which purchased from Research Diets. The detailed formulas of these diets are shown in Table 1. Before sacrifice at 16th week, the mice were injected with insulin intraperitoneally for 30 minutes, and blood samples were collected from the orbital sinus of mice. After blood sample collections, mice were sacrificed by cervical dislocation for subsequent tissue harvest. All the operations and use on animals were followed by National Institutes of Health Guide for the Care and Use of Laboratory Animals (NIH Publications No.8023, advised 1978), and approved by the National Taiwan University Institutional Animal Care and Use Committee (NTU105-EL-000019).
2.1.2 Locally chloroquine injection in epididymal adipose
The operation process referred to Xu et al. (2013). 12-week-old male C57BL/6 mice were anesthetized with 2.5% avertin (0.15 mL/10 g) through intraperitoneal injection, and shaved abdomen to avoid hair falling into body during surgery. Then, the abdomen was cut open and the position of the epididymal adipose tissues were identified. A dose of 2.5 mg/kg body weight of chloroquine (Sigma-Aldrich) in PBS and PBS alone were injected respectively into one side of epididymal adipose. Mice recovered overnight with free access to feed and water. 10 and 24 hours after surgery, mice were injected with insulin and sacrificed for subsequent tissue harvest.
2.2 Cell culture
3T3-L1 preadipocyte were purchased Taiwan Bioresource Collection and Research Center (BCRC number: 60159). Cells were culture in high glucose Dulbecco’s modified eagle medium (DMEM) (D5648, Sigma-Aldrich; 12100046, Gibco) containing 10%
newborn calf serum (16010159, New Zealand origin, Gibco), 1% penicillin-streptomycin (15140122, Gibco) and 2.5 g/L of sodium bicarbonate. Cells were maintained at 37℃
with 5% CO2 supplement. For differentiation into mature adipocytes, 3T3-L1 preadipocytes were switched to medium, containing 10% fetal bovine serum (10270106, South American origin, Gibco) in place of newborn calf serum, when the cells were 70%
confluent. Additionally, the medium was also added with 1 μM dexamethasone, 0.5 mM methylisobutylxanthine (IBMX) and 1 μg/mL insulin. After 2 days of treatment, dexamethasone and IBMX were removed from culture medium, and the cells were maintained in insulin only treatment until they were fully differentiated. However, in order to avoid cells from peeling off around the edge of the plate, we modified the cell density recommended by ATCC. On the operation of 24-well plate, the suggested 2×10⁴ cells per well was modified to 1.5×10⁴. To investigate the relationship between autophagy and insulin signaling transduction, autophagy inhibitor, bafilomycin (Tocris) and chloroquine were added to the culture medium for 4 and 24 hours in 3T3-L1 mature adipocytes, and treated insulin 15 minutes before sampling.
2.3 Protein sample preparation and Western blotting analysis
In order to extract the protein, the adipose tissues were homogenized in Pierce IP Lysis Buffer (87787, ThermoFisher Scientific) containing cOmplet EDTA-free Protease Inhibitor Cocktail (04693132001, Roche) and PhosSTOP (04906845001, Roche), and then centrifuged at 4℃, 16000×g for 20 minutes. After centrifugation, we used Pierce BCA Protein Assay Kit (23225, ThermoFisher Scientific) to measure the protein concentration of homogenate. To make the protein concentration of each sample consistent, the samples were diluted and mixed with 4X Laemmli Sample Buffer
(1610747, Bio-Rad) and 10 mM dithiothreitol (DTT) to give a final concentration of 2 μg/μL. As for the cell experiment, 3T3-L1 cells were rinsed once with PBS and collected directly in 1X Laemmli Sample Buffer plus 10 mM DTT after treatment. All harvested samples were immediately boiled at 98℃ for 10 minutes, and then stored at -20℃ until use.
To separate proteins with different molecular weight, appropriate concentration of sodium dodecyl sulfate polyacrylamide gel electrophoresis (SDS-PAGE) was conducted depending on the size of the target protein. The 1-mm-thick gels casting for SDS-PAGE was based on the recipes in Cold Spring Harbor Protocols (Sambrook and Russell, 2006).
After polymerization is complete, remove the comb carefully. Precision Plus Protein Dual Color Standards (1610374, Bio-Rad) and protein samples without adjusting volume were loaded into gel wells. Electrophoresis was performed using running buffer (25 mM Tris, 192 mM glycine, 0.1% SDS), and the voltages were set at 95 V and 110 V according to the sample during the stacking and resolving stages, respectively.
After electrophoresis, the separated proteins were transferred onto methanol-pre- wetted and transfer buffer-pre-equilibrated PVDF membrane (1620177, Bio-Rad) via the transfer buffer (25 mM Tris, 192 mM glycine, 20% methanol). The size of protein determined either Trans-Blot Turbo Semi-dry Transfer System (170-4155, Bio-Rad) or Criterion Wet Transfer Blotter (170-4070, Bio-Rad) was used, while the former was for
small proteins and the latter for large proteins. For semi-dry transfer, the proteins were transferred at 25 V constant voltage with 0.4 A limited current for 35 minutes. For wet transfer, gels were equilibrated in transfer buffer for 15 minutes to remove excessive SDS and then the proteins were transferred at 70 V with 250 mA limited current for 1 hour.
After the transfer procedure, PVDF membranes were washed with methanol and stained by Ponceau S solution to visualize the transferred proteins. The fragment membranes cut at the target position were blocked with 5% non-fat milk in TBST (137 mM sodium chloride, 20 mM Tris, 0.1% Tween-20) for 1 hour at room temperature, and then washed with TBST and incubated with target protein specific primary antibodies, which diluted with 1% BSA in TBST, overnight at 4℃.
The next day, membranes were washed with TBST three times for 15, 10 and 10 minutes each, and incubated with the species-specific HRP-conjugated secondary antibodies (1:2500 to 1:5000 diluted with 5% non-fat milk in TBST) for 1 hour at room temperature. Finally, membranes were washed with TBST three times for 10, 5 and 5 minutes each and then the blotting images were visualized with Bio-Rad (1705061) and GE (RPN2235) ECL substrates reagents by Bio-Rad ChemiDoc Touch Imaging System.
Blotting quantification is performed by Bio-Rad Image Lab software. The information of antibodies listed in Table 2.
2.4 Nile red staining
In order to observe the oil droplet accumulation in 3T3-L1 mature adipocytes, a hydrophobic fluorescent dye Nile red was used. After treatment, 3T3-L1 cells were wash with PBS and fixed with 4% paraformaldehyde for 5 minutes. Fixed cells were washed again with PBS and then stain with Nile red (10 μg/mL) and Hoechst 33342 (5 μg/mL) in PBS for 30 and 2 minutes respectively in the dark. Finally, the microscope was used to observe the lipid accumulation to determine the differentiation status in 3T3-L1.
2.5 RNA extraction and qPCR analysis
The total RNA from mouse adipose tissues was extracted using TRIzol reagent (15596018, ThermoFisher Scientific). Firstly, around 50 mg of tissue was mixed with 500 μL of TRIzol and homogenized using bead homogenizer at 4℃. After homogenization, the lysates were added 100 μL of chloroform and then shook vigorously for 15 seconds.
Mixed lysates were centrifuged at 12,000 xg for 15 minutes at 4℃ after being incubated for 2-3 minutes at room temperature. Subsequently, the RNA-containing colorless upper aqueous phase was transferred carefully to a new tube without touching the interphase and organic layer. The RNA was precipitated by mixing with 250 μL of isopropyl alcohol for 10 minutes at room temperature and centrifuged again at 12,000×g for 10 minutes at 4℃ to spin down the RNA pellets. After centrifugation, the supernatant was removed and
the pellets were washed twice with 500 μL of 75% ethanol. At last, the pellets were air- dried and dissolved in UltraPure DNase/RNase-Free Distilled Water (10977023, ThermoFisher Scientific) by incubating in a water bath at 60℃. After RNA isolation, the concentration was measured by the biophotometer.
Total RNA was reverse transcribed to cDNA using PrimeScripTM RT reagent Kit (RR037Q, TaKaRa). 200-500 ng RNA was mixed with PrimeScript buffer, PrimeScript RT enzyme mix I, 25 pmol oligo dT primer and 50 pmol random 6 mers, and then incubated at 37℃ for 30 minutes followed by inactivation of reverse transcriptase at 85℃
for 10 seconds. After reverse transcription, the cDNA products were diluted with DNase/RNase-free distilled water to give a final concentration of 10-20 ng/μL, then stored at -20℃ and analyzed within one week.
To measure the level of target gene mRNA expression, we used QuantStudio 3 System (Applied Biosystems) for quantitative real-time PCR (qPCR) analysis. 10-20 ng of cDNA template were mixed with Fast SYBR Green Master Mix (Applied Biosystems) and 0.4 μM target gene-specific primer pairs in a total volume of 10 μL. The reaction mixtures were transferred to each well of the plate and then centrifuged briefly. The samples were denatured for 20 seconds at 95℃ followed by 40 cycles of the PCR stage,
with the denaturing step at 95℃ for 3 seconds and the annealing and extension step at 60℃ for 30 seconds. At last, melting curve analysis was conducted. The expression levels
of ACTB were used as loading control, and the gene-specific primer pairs listed in Table 3.
2.6 Serum free fatty acid content analysis
To compare serum free fatty acid levels between CTD-fed and HFD-fed mice, we used the commercial assay kit, Free Fatty Acid Quantification Kit, from BioVision
(K612-100). Fifty μL of serum samples were mixed with Reaction Mix containing Assay Buffer, Fatty Acid Probe, Enzyme Mix and Enhancer in a total volume of 100 μL. Then, the reactions were incubated at 37℃ for 30 minutes in the dark and the O.D. 570 nm value was measured. The sample readings were applied to the standard curve to obtain free fatty acid levels in the serum.
2.7 Statistical analysis
In this study, each experiment was replicated at least three times and data were
expressed as mean ± standard error of the mean (SEM). Data were analysis by Student’s t-test or one-way ANOVA followed by least significant difference test (LSD) with Statistics Analysis System (Version 9.4, SAS Institute Inc.); P < 0.05 indicated statistically significant differences.
Table 1. The formulas of diets used in animal studies
CTD HFD
Product Number D12450J D12492
%kcal
Protein 20 20
Carbohydrate 70 20
Fat 10 60
Total 100 100
kcal/gm 3.85 5.24
Ingredients gm kcal gm kcal
Casein 200 800 200 800
L-Cystine 3 12 3 12
Corn Starch 506.2 2025 0 0
Maltodextrin 10 125 500 125 500
Sucrose 68.8 275 68.8 275
Cellulose, BW200 50 0 50 0
Soybean Oil 25 225 25 225
Lard 20 180 245 2205
CTD: control diet; HFD: high-fat diet.
Table 2. The antibodies used in the study
Antibody Name Company Product Number
Anti-Akt Cell Signaling Technology 4691S
Anti-phospho-Akt Ser 473 Cell Signaling Technology 4060S
Anti-ATG5 Cell Signaling Technology 12994S
Anti-CHOP Cell Signaling Technology 2895S
Anti-cleaved caspase 3 Cell Signaling Technology 9664S
Anti-GAPDH Cell Signaling Technology 2118S
Anti-GSK-3β Cell Signaling Technology 3915S
Anti-phospho-GSK-3β S9 Cell Signaling Technology 5558S
Anti-LC3 Cell Signaling Technology 2775S
Anti-PHLPP1 Merck Millipore 07-1341
Anti-PTEN Cell Signaling Technology 9559S
Anti-Rubicon Cell Signaling Technology 8465S
Anti-SQSTM1/p62 Abcam ab109012
Goat anti-rabbit IgG-HRP Santa Cruz Biotechnology sc-2004
Table 3. The primer pairs used in qPCR analysis
Gene name Forward (5’ to 3’)
Map1lc3b GGAGCTTTGAACAAAGAGTGGAA
Actb GTGCGTGACATCAAAGAG
Reverse (5’ to 3’)
Map1lc3b GGTCAGGCACCAGGAACTTG
Actb CAAGAAGGAAGGCTGGAA
Chapter 3. Results
3.1 HFD induces autophagy impairment, insulin resistance, endoplasmic
reticulum (ER) stress and apoptosis in adipose tissue
To confirm the effect of high-fat diet on autophagy and insulin signaling transduction from adipose tissue. We fed 12-week-old male C57BL/6 mice with either control diet (CTD) or high-fat diet for 8 and 16 weeks, and injected mice with insulin (0.5 IU/kg body weight) intraperitoneally for 30 minutes before sacrifice at the 16th week. At 8th week, the data showed that HFD significantly increase SQSTM1/p62 and Rubicon expression, but the expression levels of LC3-II and Atg5 were unaltered (Figure 6). Rubicon combines with the UVRAG-Beclin 1 complex to suppress the fusion of autophagosome and lysosome (Morris et al., 2015). These data represented the increment of autophagy cargo protein and the late-stage autophagy blocker, which meant the autophagy had been changed this moment. At 16th week, the expression of LC3-II and Atg5 were significantly increased, implying that autophagy may be activated. However, the protein level of p62 did not decrease due to the degradation caused by autophagy activation, but increased significantly, indicating the degradation of substrates was hindered. And it was worth noting that the increased Rubicon expression could inhibit late-stage autophagy, which might be one of the factors resulting in the impairment of autophagic degradation (Figure 7).
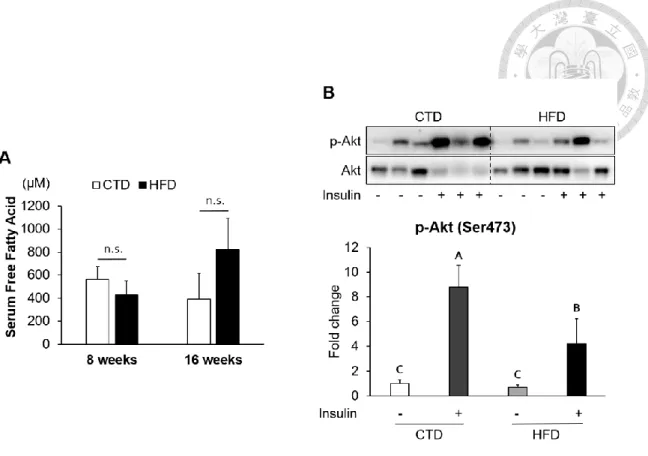
In addition, we collected blood samples at 8th and 16th week before sacrificed to analyze the concentration of free fatty acids (FFAs) in serum as one of the basis for insulin resistance. Although there was no significant difference in serum total FFAs between HFD and CTD groups at 8th and 16th week, the western blotting data showed that insulin injection fail to induce Akt phosphorylation (Ser473) in adipose tissue from mice fed HFD for 16 weeks, which indicated that insulin sensitivity may decrease (Figure 8).
Meanwhile, we also observed the marker of endoplasmic reticulum (ER) stress, C/EBP homologous protein (CHOP), was significantly increased, and one of the key executioners of apoptosis, caspase-3, was activated as cleaved caspase-3 in adipose tissues from mice fed HFD (Figure 9) (Kadowaki and Nishitoh, 2013; Crowley and Waterhouse, 2016). It could be seen that HFD not only led to insulin resistance in adipose, but also ER stress and apoptosis.
Although the experimental results showed that HFD caused an increase in Rubicon to suppress the late-stage autophagy, we didn’t further determine the effect of HFD on autophagic flux in mouse adipose. Thus, we used differentiated 3T3-L1 adipocytes for FFAs treatment to reinforce the conclusion that autophagy was inhibited in the in vivo experiment. By treating 3T3-L1 cells with the mixture of 0.6 mM palmitic acid (PA) and 0.6 mM oleic acid (OA), two of common fatty acids in the human diet, for 48 hours, we assessed whether autophagic flux changed through the Bafilomycin A1 treatment 4 hours
before sampling and analysis of LC3-II accumulation. As shown in Figure 10, Bafilomycin A1 induce less accumulation of LC3-II protein in FFA-treated cells than the BSA control group, which implied the occurrence of autophagic flux was reduced. The process of autophagy may be suppressed, similar to the results of in vivo experiment.
Summarize the above results, our data suggested that long-term HFD could inhibit late- stage autophagy and trigger insulin resistance, ER stress and apoptosis in mice adipose tissues.
Figure 6. Altered autophagy in adipose tissues from mice fed with 8-week HFD.
Twelve-week-old male B6 mice were fed with either the control diet or HFD for 8 weeks.
Representative SQSTM1/p62, LC3, Rubicon and Atg5 immunoblots (upper panel) and densitometric quantifications (lower panel). For densitometric analyses of Western blotting data, GAPDH was used as loading control. Values are mean ± SEM (n=4). * indicates statistical significance, P <0.05.
Figure 7. Altered autophagy in adipose tissues from mice fed with 16-week HFD.
Twelve-week-old male B6 mice were fed with either the control diet or HFD for 16 weeks.
Representative SQSTM1/p62, LC3, Rubicon and Atg5 immunoblots (upper panel) and densitometric quantifications (lower panel). For densitometric analyses of Western blotting data, GAPDH was used as loading control. Values are mean ± SEM (n=6). * indicates statistical significance, P < 0.05.
Figure 8. Insulin resistance in adipose tissues from mice fed with 16-week HFD.
The serum free fatty acid levels between CTD-fed and HFD-fed mice were analyzed by commercial assay kit (A). Values are mean ± SEM (8 weeks: n=4 and 16 weeks: n=6).
n.s.: no significant difference. The phospho-Akt (Ser473) levels of adipose tissues from mice injected with or without insulin (0.5 IU/kg body weight I.P., 30 minutes) were analyzed at 16th week by Western blotting (B). Representative blotting and quantitative data of p-Akt/Akt was presented. Values are mean ± SEM (n=6). Different letters are considered statistically significant difference by one-way ANOVA and least significant difference (LSD) test, P < 0.05.
Figure 9. HFD induced ER stress and apoptosis in adipose tissues of mice.
Twelve-week-old male B6 mice were fed with either the control diet or HFD for 16 weeks.
Representative CHOP and cleaved caspase-3 immunoblots (upper panel) and densitometric quantifications (lower panel). For densitometric analyses of Western blotting data, GAPDH was used as loading control. Values are mean ± SEM (n=6). * indicates statistical significance, P < 0.05.
Figure 10. Free fatty acids (FFAs) impaired the autophagic flux in differentiated
3T3-L1 adipocytes.
The Bafilomycin A1-induced LC3 II protein accumulation in 48-hour BSA- and FFA- (0.6 mM PA + 0.6 mM OA) loaded 3T3-L1 adipocytes were analyzed using Western blotting. Representative immunoblots (upper panel) and calculated fold change of LC3 II protein levels (lower panel) was presented. For densitometric analyses, GAPDH was used as the loading control. Values are mean ± SEM (n=3). * indicates statistical significance, P < 0.05.
3.2 The late-stage autophagy inhibition correlates with insulin resistance in
adipose tissue
To investigate the relationship between impaired late-stage autophagy and the development of insulin resistance , we evaluated the role of autophagy in adipose insulin signaling transduction by locally injecting chloroquine (CQ), a late-stage autophagy blocker, into mouse epididymal adipose, to clarify whether autophagy inhibition can cause insulin resistance. The results showed that 10 hours after CQ injection, the level of phosphorylation induced by insulin was no significantly different from that of the control group, indicating the insulin signaling transduction was still normal at this time (Figure 11). But the capability of insulin to induce Akt (Ser473) and GSK3β (Ser9)
phosphorylation was reduced 24 hours after CQ injection, which represented autophagy may be required for insulin signal transduction (Figure 12).
Additionally, although the protein levels of SQSTM1/p62 and LC3-II were no difference between CQ-treated and control groups (Figure 13A), the LC3 mRNA expression was significantly decreased in adipose tissues with CQ injection (Figure 13B) These data suggested that at the 24-hour post-injection of CQ, the suppression of late- stage autophagy may have feedback effect which resulted in reduced mRNA level of LC3.
Figure 11. The insulin signaling pathway was still normal after chloroquine (CQ)
treatment for 10 hours.
B6 mice were injected with PBS or CQ into epididymal adipose tissue for 10 hours, and injected with or without I.P. insulin (0.5 IU/kg body weight, 30 minutes) before sacrifice.
The phospho-Akt (Ser473) and total Akt levels of adipose tissues were analyzed by Western blotting. Representative blotting and quantitative data of p-Akt/Akt was presented. Values are mean ± SEM (n=4). Different letters are considered statistically significant difference by one-way ANOVA and least significant difference (LSD) test, P
< 0.05.
Figure 12. Autophagy is required for insulin signaling transduction in adipose tissue.
B6 mice were injected with PBS or CQ into epididymal adipose tissue for 24 hours, and injected with or without insulin (0.5 IU/kg body weight I.P., 30 minutes) before sacrifice.
The phospho-Akt (Ser473), total Akt, phosphor-GSK3β (Ser9) and total GSK3β levels of adipose tissues were analyzed by Western blotting. Representative blotting and quantitative data of p-Akt/Akt and p-GSK3β/ GSK3β were presented. Values are mean ± SEM (n=6). Different letters are considered statistically significant difference by one-way ANOVA and least significant difference (LSD) test, P < 0.05.
Figure 13. The suppression of late-stage autophagy may have feedback effect which
resulted in reduced mRNA level of LC3B.
B6 mice were injected with PBS or CQ into epididymal adipose tissue for 24 hours.
Representative SQSTM1/p62 and LC3 immunoblots and densitometric quantifications (A). For densitometric analyses of Western blotting data, GAPDH was used as loading control. The LC3B mRNA level in 24-hour PBS- and CQ-treated adipose was measured using qPCR analysis. For data quantification, the housekeeping gene ACTB was used as the internal control. Values are mean ± SEM (n=6). * indicates statistical significance, P
< 0.05. n.s.: no significant difference.
3.3 The phosphorylation of insulin signaling blocked by autophagy is independent
of PHLPP1 and PTEN
After confirming the inhibition of late-stage autophagy is related to the occurrence of insulin resistance, we would like to further investigate the possible molecular mechanisms that may be involved. As it was previously reported that the expression of PH domain and leucine rich repeat protein phosphatase 1 (PHLPP1), a protein phosphatase participated in regulation of Akt signaling, is elevated in adipose tissue of obese patients and mice, which in turn led to a decrease in phosphorylation of Akt and affected insulin sensitivity (Andreozzi et al., 2011). So we first checked the protein level of PHLPP1 in mouse adipose were treated by CQ. According to the Western blotting data, the CQ injection did not increase the expression of PHLPP1 compared to the control group as expected, but was significantly lower (Figure 14), which suggested that decreased level of Akt phosphorylation via autophagy blockade wasn’t associated with negative regulator of Akt activity, PHLPP1.
Furthermore, we also analyzed the amount of phosphatase and tensin homolog (PTEN), restrained PI3K signaling by dephosphorylating PIP3 to PIP2, making PDK-1 unable to be activated to phosphorylate downstream Akt (Carnero and Paramio, 2014).
As shown in Figure 15, the protein level of PTEN was not changed by CQ treatment in mouse adipose, which indicated that the PTEN may also not be involved in autophagy-
mediated inactivation of Akt. Collectively, these data demonstrated that late-stage autophagy inhibition blocked insulin downstream signaling was independent of PHLPP1 and PTEN. As for other mechanisms which may be concerned, we would use the in vitro experiments to investigate.
Figure 14. Autophagy may regulate insulin-stimulated signal transduction
independently of PHLPP1.
To confirm whether PHLPP1 was involved in the regulation of insulin signaling transduction by autophagy, we analyze the PTEN levels of PBS- and CQ-injected mouse adipose via Western blotting. Representative blotting and quantitative data of PHLPP1 was presented. For densitometric analyses of Western blotting data, GAPDH was used as loading control. Values are mean ± SEM (n=3). * indicates statistical significance, P <
0.05.
Figure 15. Autophagy may regulate insulin-stimulated signal transduction
independently of PTEN.
To confirm whether PTEN was involved in the regulation of insulin signaling transduction by autophagy, we analyze the PTEN levels of PBS- and CQ-injected mouse adipose via Western blotting. Representative blotting and quantitative data of PTEN was presented. For densitometric analyses of Western blotting data, GAPDH was used as loading control. Values are mean ± SEM (n=3). n.s.: no significant difference.
3.4 Impaired late-stage autophagy may cause insulin resistance indirectly by ER
stress or apoptosis
To investigate whether the inhibition of autophagy can induce insulin resistance in a cell-autonomous manner, we conducted series of in vitro experiments using differentiated 3T3-L1 adipocytes, which was one of the most common in vitro models used in the study of adipocyte biology (Morrison and McGee, 2015). By treating differentiated 3T3-L1 with 40 μM of CQ for 24 hours, we first addressed whether the autophagy in 3T3-L1 cells was inhibited, and further confirmed the condition of insulin signaling by insulin treatment (40 nM) for 15 minutes before sampling. After treatment with CQ, increased LC3-II and SQSTM1/p62 protein levels were observed in 3T3-L1 cells, indicating that autophagy was indeed inhibited by the drug. Because the autophagosome and lysosome couldn’t be fused by CQ, the autophagosomes would accumulate in a large amount, which elevated the expression of LC3-II on the autophagosome membrane. In addition, p62 is degraded primarily by autophagy, and if the lysosomal degradation of autophagosome is blocked, an accumulation of p62 is expected (Pugsley, 2017). Simultaneously, we also found that phospho-Akt (Ser473) in the CQ-treated group was significantly lower than the control, meaning that Akt wasn’t activated by insulin, in other words, the transmission of insulin signaling was abnormal (Figure 16). These data suggested that CQ treatment also caused insulin resistance in differentiated 3T3-L1 adipocytes.
Interestingly, CQ-treated adipocytes showed significantly higher levels of CHOP and cleaved caspase-3 than the control in our Western blotting data (Figure 17), which was similar to the in vivo experimental results observed in the adipose from mice fed with HFD. Thus, it could be seen that the suppression of late-stage autophagy not only led to insulin resistance, but also was accompanied by ER stress and apoptosis in 3T3-L1 adipocytes.
To further clarify that insulin resistance was directly affected by autophagy inhibition, or by concomitant ER stress or apoptosis, we would exclude the effects of ER stress and apoptosis on cells via reducing the concentration of CQ. Therefore, the concentrations we used were lower than the previous 40 μM, which were 10, 20 and 30 μM, respectively, and the treatment time was also 24 hours. Through this dose-response experiment, we selected the most appropriate dose of drug treatment. And this dose must have two requirements, first of all, it had the ability to inhibit autophagy of cells, and then didn’t induce other possible cellular conditions such as apoptosis. As shown in Figure 18, the protein levels of LC3-II were all higher in the three doses than the control group, while the levels of SQSTM1/p62 were significantly increased at the concentrations of 20 and 30 μM compared with the control. These data implied that both doses (20 and 30 μM) have the ability to suppress late-stage autophagy in differentiated 3T3-L1 adipocytes.
Moreover, the expression of cleaved caspase-3 did not alter, represented that such
treatments didn’t trigger apoptosis. Hence, we finally chose the relatively low 20 μM to figure out if autophagy inhibition per se can induce insulin resistance. It is worth nothing that 20 μM CQ treatment did not influence insulin-stimulated Akt phosphorylation in 3T3-L1 (Figure 19), which suggested that delivery of insulin signaling remained normal.
Base on the above result, we supposed that the 24-hour treatment was short-term autophagy inhibition for 3T3-L1 cells, and thence still didn’t cause abnormalities in insulin signaling transduction. To clarify this speculation, we treated the cells with CQ for a longer period of time, 48 hours. Although the amount of phospho-Akt stimulated by insulin in the CQ-treated group was significantly lower than that of the control, the expressions of CHOP and cleaved caspase-3 were also increased (Figure 20). These results confirmed again that the inhibition of late-stage autophagy not only led to insulin resistance, but also was accompanied by ER stress and apoptosis. It could be seen that the suppression of late-stage autophagy may not directly cause the insulin resistance, but indirectly by other concomitant phenomena.