Preparation and magnetic properties of Ba–Co
2Z and Sr–Zn
2Y ferrites
In-Gann Chen,a) Shu-Hau Hsu, and Y. H. Chang
Dept. of Materials Science and Engineering, National Cheng Kung University, 1 Ta-Hsueh Rd., Tainan Taiwan, Republic of China
We have prepared Ba–Co2Z and Sr–Zn2Y ferrites by mixing SrCO3(BaCO3), Co2O3共ZnO兲, and Fe2O3and calcinating in air and O2. The effects of sintering atmosphere共O2and Ar兲 and sintering temperatures 共1373–1573 K兲 on the structural, magnetic, and electrical properties have been measured. The Ba–Co2Z sample sintered at 1573 K under a flowing O2 exhibits superior dc electrical resistivity (⬃108⍀-cm), high initial permeability (u
⬘
⬃21), and low loss factor (F ⬃1.6⫻10⫺3) at 20 MHz. The related XRD and SEM/EDS analyses of these samples have also been studied to correlate these properties. These results indicate that significant modification of magnetic properties up to 20 MHz can be achieved with the addition of the quaternary component and proper control of the processing oxygen atmosphere. © 2000 American Institute of Physics.关S0021-8979共00兲76308-0兴 I. INTRODUCTION
Ba-共and Sr-兲 ferrites are widely used primarily for their superior hard magnetic properties, known as M-type ferrite 共MFe12O19, where M⫽Sr, Ba兲. There are a few reported studies of microwave performance on the derivative of Ba-共and Si-兲 ferrites with the addition of the quaternary element, usually divalent metal to partially substitute the M site. For example, it was reported by Jonker1that Y-structured Ba–Zn ferrite (Ba–Zn2Y, Ba2Zn2Fe12O22) exhibits a high initial per-meability and a sharp resonance frequency in the range of 100 to 1500 Oe. It was reported2 that the Z-structure of Ba–Co ferrite (Ba–Co2Z, Ba3Co2Fe24O41) exhibits better magnetic properties at high frequency than that of Ni spinel material. This study extends the scope of the study to substi-tute the Ba with Sr in Sr–Zn2Y ferrite (Sr2Zn2Fe12O22) and to compare with that of Ba–Co2Z ferrite.
II. EXPERIMENTAL PROCEDURE
The stoichiometric Ba–Co2Z and Sr–Zn2Y ferrites used in this study were prepared by standard calcination共repeated three times兲/sintering process. The raw materials, such as BaCO3, Fe2O3, SrCO3, Co2O3, and ZnO, listed in Table I, were mixed by the designed stoichiometric ratio and calci-nated for 4 h at 1373 K for Ba–Co2Z and 1423 K for Sr–Zn2Y, respectively, under air and O2atmosphere. These calcination temperatures were chosen based on a previous unpublished study. The purity of the calcinated powder was characterized by x-ray diffraction 共XRD, Cu K␣ radiation兲. The calcinated powder was uniaxially pressed into different shapes, e.g., disc and ring, for different kinds of measure-ments. These pressed samples were sintered at the range of 1373 to 1573 K for 2.5 h under a flowing O2 or Ar atmo-sphere with a heating and cooling rate of 3 °C/min. The bulk density was measured by the Archimedes method. The disc-shaped sample with silver paste applied on both sides was used to measure dc resistivity by the two-probe method with a digital multimeter 共YOKOGAWA 7522兲. The
microstruc-ture observation and stoichiometric composition measure-ments were carried out by the SEM共Topcon ABT-60兲 with a EDS共Kevex Sigma SDP兲. Initial permeability (u
⬘
) and rela-tive loss factor 共F兲 in an ac magnetic field up to 10 MHz were characterized by a LCR multifrequency meter 共HP 4275 A兲 on ring-shaped samples. Some Ba–Co2Z andSr–Zn2Y samples were measured by a HP 4194A
impedance/gain phase analyzer up to 20 MHz. III. RESULTS AND DISCUSSION
Figure 1 shows the XRD intensity vs 2 curves of the Ba–Co2Z and Sr–Zn2Y powders calcinated in O2 and air, respectively. It is noted that the Ba–Co2Z powder with three rounds of repeated grinding and calcination still consists of some impurity phases, i.e., Co2W or Co2Y. A more detailed study is required to achieve the phase-pure powder by solid-state reaction. The difference in XRD results for powders calcinated under air and O2 is insignificant. However, as shown later, the electrical and magnetic properties varied significantly under different sintering atmospheres. Figure 2 shows the bulk density measurements of samples sintered in different temperatures and atmospheres. As expected, the density increases as the sintering temperature increases. However, the density measured in this study reaches only about 4 g/cm3, which is about 75% dense of the theoretical density of Ba–Co2Z共5.33 g/cm3兲.
The dc resistivity measurements of Ba–Co2Z and Sr–Zn2Y samples sintered at different temperatures and at-mospheres are also shown in Fig. 2. It is shown that the Ba–Co2Z ferrites sintered in O2 exhibit resistivity above 108⍀-cm, which is significant higher 共⬃5 orders of
magni-a兲Author to whom correspondence should be addressed.
TABLE I. Weight percentage of calcinated Ba–Co2Z and Sr–Zn2Y.
Ba3Co2Fe24O41 Sr2Zn2Fe12O22 BaCO3 22.18共wt %兲 Co2O3 6.02共wt %兲 Fe2O3 71.8共wt %兲 67.66共wt %兲 SrCO3 20.85共wt %兲 ZnO 11.49共wt %兲
JOURNAL OF APPLIED PHYSICS VOLUME 87, NUMBER 9 1 MAY 2000
6247
0021-8979/2000/87(9)/6247/3/$17.00 © 2000 American Institute of Physics
tude兲 than that sintered in Ar with a resistivity ⬃103⍀-cm. On the other hand, the resistivities of Sr–Zn2Y ferrites are in the range of 100– 103⍀-cm, which is significantly lower than that of Ba–Co2Z samples. The sintering atmosphere has a similar effect on Sr–Zn2Y ferrite, where O2 sintering at-mosphere increases the resistivity. One possible reason for the large decrease in resistivity for samples sintered in Ar is that the Fe⫹3 ions were reduced to Fe⫹2 ions plus charge carriers, e.g., electron holes. Thus the low O2sintering atmo-sphere will increase the concentration of positive charge car-riers as well as the electrical conductivity.3 For high-frequency application, a high resistivity is required to reduce the eddy current loss; therefore Ba–Co2Z ferrite with O2 at-mosphere sintering is superior to other samples.
Figure 3 shows the initial permeability (u
⬘
) and relative loss factor 共F兲 at 10 MHz of the Ba–Co2Z and Sr–Zn2Y samples sintered at different temperatures and atmospheres. The initial permeability of Ba–Co2Z ferrite increases as the sintering temperature increases on both O2 and Ar atmo-spheres. The u⬘
at 10 MHz of samples sintered at 1573 K in O2exhibit significant higher values共⬃9兲 than those samples sintered in Ar共⬃3.5兲. It is believed that this increase is re-lated to the increase of bulk density as the grains become larger and the porosity decreases.4The relative loss factor is calculated by the equation: F⫽1/(Qu⬘
), where Q is the quality factor. The sintering atmosphere has a strong influ-ence on the relative loss factor of the Ba–Co2Z samples. The samples sintered in pure O2show a decrease as the sinteringtemperature increases, while the trend is reversed for samples sintered in Ar. The Ba–Co2Z ferrite samples sin-tered in O2show lower F values than those samples sintered in Ar as the sintering temperatures increase. At 1573 K sin-tering temperature in O2, the F of Ba–Co2Z ferrite drops to ⬃1.6⫻10⫺3 at 10 MHz.
Previous studies of sintering Sr–Zn2Y samples in air have shown a sharp decrease in dc resistivity above 1498 K and a low density below 1448 K. Therefore, a narrower sin-tering temperature range from 1448 to 1498 K was chosen
FIG. 1. The powder XRD measurements of calcinated Ba–Co2Z and
Sr–Zn2Y ferrite powders in O2and air, respectively.
FIG. 2. The bulk density and dc resistivity measurements of Ba–Co2Z and
Sr–Zn2Y ferrites sintered at different temperatures in O2and Ar.
FIG. 3. The initial permeability (u⬘) and relative loss factor at 10 MHz of Ba–Co2Z and Sr–Zn2Y samples sintered at different temperatures and
at-mospheres.
6248 J. Appl. Phys., Vol. 87, No. 9, 1 May 2000 Chen, Hsu, and Chang
for the study of Sr–Zn2Y samples. The initial permeability of Sr–Zn2Y ferrite shows a higher value for samples sintered in Ar than in O2 atmosphere. The error bar of Sr–Zn2Y ferrite represents the span of data from three samples sintered at 1523 K in Ar. The F of Sr–Zn2Y samples are slightly higher than Ba–Co2Z samples with the same processing conditions. Figure 4 shows the u
⬘
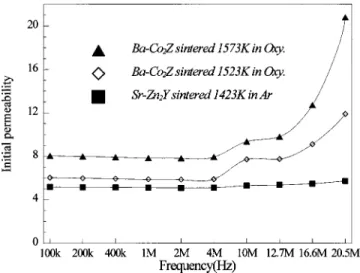
vs frequency共100 K–20 MHz兲 of two Ba–Co2Z samples sintered at different temperatures O2 and one Sr–Zn2Y sample sintered at 1423 K in Ar. It is shown that the u⬘
increases as the frequency increases. At the limitation of the instrument 共HP 4194A兲 of 20 MHz, u⬘
reaches⬃21 for Ba–Co2Z sample sintered at 1573 K in O2. For the Sr–Zn2Y sample, the u⬘
maintains a constant value as the frequency increases up to 20 MHz. Measurements at even higher frequencies are in progress.Figure 5 is the SEM micrograph of a polished Ba–Co2Z which shows that the sintered structure with a few needle-shaped grains can be observed. The semiquantitative EDS analyses in Table II show that their compositions are close to Ba–Co2Z and Ba–Co2Y stoichiometric ratios, respectively. These EDS results are consistent with that of XRD results
shown in Fig. 1. The SEM micrograph and EDS analysis of a Sr–Zn2Y ferrite sintered at 1473 K in O2exhibits a similar microstructure as that of Ba–Co2Z shown in Fig. 5. IV. SUMMARY
The processing parameters, such as sintering atmosphere and temperature, have a strong influence on the electrical and magnetic properties in both Ba–Co2Z and Sr–Zn2Y samples. Based on the XRD and SEM/EDS results, there exists a small fraction of W and Y types in Ba–Co2Z ferrites calci-nated both in air and O2 even after repeated grinding and calcination. In general, the samples sintered in O2 show a higher resistivity than those sintered in Ar. It is believed that the low O2sintering atmosphere will increase the concentra-tion of positive charge carries as well as the electrical con-ductivity. The Ba–Co2Z sample sintered at 1573 K under flowing O2 exhibits the superior electric and magnetic per-formance to other samples with dc electrical resistivity (⬃108⍀-cm), high initial permeability (u
⬘
⬃21), and low loss factor (F⬃1.6⫻10⫺3) at 20 MHz. In general, the rela-tive high initial permeability of Ba–Co2Z ferrite at the high-frequency range indicates that it is a potential material for magnetic core in microwave applications.ACKNOWLEDGMENTS
This work was supported by the National Science Coun-cil, R.O.C., under Contract No. NSC-87-2216-M-006-020. The authors are gratefully indebted to Chich-Ching Li, Chuan-Shian Fu, and Chich-Liang Jiau for careful experi-mental work.
1G. K. Jonker, H. P. J. Wijn, and P. B. Braun, Philips Tech. Rev. 18, 145
共1956兲.
2
O. Sakaguchi, T. Kagotani, D. Book, H. Nakamura, S. Sugimoto, M. Okada, and M. Homma, Mater. Trans., JIM 37, 878共1996兲.
3A. J. Moulson and J. M. Herbert, Electroceramics共Chapman and Hall,
London, 1990兲, p. 397.
4B. D. Cullity Introduction to Magnetic Materials共Addison-Wesley,
Read-ing, MA, 1972兲, p. 551.
FIG. 4. The u⬘ vs frequency共100 K–20 MHz兲 of two Ba–Co2Z samples
sintered at different temperatures in O2and one Sr–Zn2Y sample sintered at
1423 K in Ar.
FIG. 5. The SEM micrograph of a Ba–Co2Z ferrite sintered at 1573 K in
O2. The composition measured by semiquantitative EDS analysis in Table II
shows that the matrix and the needle-shaped grain are close to Ba–Co2Z and
Ba–Co2Y stoichiometric ratios, respectively.
TABLE II. The semiquantitative EDS analysis of Ba–Co2Z and Sr–Zn2Y
samples both sintered in oxygen. The EDS analysis data have been normal-ized to关Fe兴 stoichiometric ratio.
Ba Co Fe O Position of analysis
Ba–Co2Z 3 2 24 41 Fig. 5
Whole picture area EDS Ana. 2.5 2.0 25.5 24.1
Ba–Co2Y 2 2 12 22 Fig. 5共A position兲,
needle-shaped crystal EDS Ana. 2.0 2.0 17.8 21.4
Sr Zn Fe O
Sr–Zn2Y 2 2 12 22
EDS Ana. 1.9 1.3 12 17.6 Whole area EDS peak used
in analysis La Ka Ka Ka
6249
J. Appl. Phys., Vol. 87, No. 9, 1 May 2000 Chen, Hsu, and Chang