行政院國家科學委員會專題研究計畫 成果報告
發展自激振動桿技術以調制方柱之表面流場,渦漩逸放,及 氣動力性能(第 3 年)
研究成果報告(完整版)
計 畫 類 別 : 個別型
計 畫 編 號 : NSC 96-2628-E-011-023-MY3
執 行 期 間 : 98 年 08 月 01 日至 99 年 07 月 31 日 執 行 單 位 : 國立臺灣科技大學機械工程系
計 畫 主 持 人 : 黃榮芳
計畫參與人員: 碩士班研究生-兼任助理人員:鄭仁傑 碩士班研究生-兼任助理人員:王士維 碩士班研究生-兼任助理人員:洪文傑
報 告 附 件 : 出席國際會議研究心得報告及發表論文
處 理 方 式 : 本計畫涉及專利或其他智慧財產權,2 年後可公開查詢
中 華 民 國 99 年 05 月 28 日
行政院國家科學委員會專題研究計畫成果報告
發 展 自 激 振 動 桿 技 術 以 調 制 方 柱 之 表 面 流 場 發 展 自 激 振 動 桿 技 術 以 調 制 方 柱 之 表 面 流 場 發 展 自 激 振 動 桿 技 術 以 調 制 方 柱 之 表 面 流 場 發 展 自 激 振 動 桿 技 術 以 調 制 方 柱 之 表 面 流 場 、、、 、
渦 漩 逸 放 渦 漩 逸 放 渦 漩 逸 放
渦 漩 逸 放 、、、 及 氣 動 力 性 能、及 氣 動 力 性 能及 氣 動 力 性 能及 氣 動 力 性 能
Modifying surfaceflow, vortex shedding, and aerodynamic forces of a square cylinder by self-excited vibration rod
計畫編號:NSC 96-2628-E-011-023-MY3 執行期限:96 年 8 月 1 日至 99 年 7 月 31 日
主持人:黃榮芳 國立台灣科技大學機械工程系
中中
中中文摘要文摘要文摘要文摘要 - 本計劃成功發展出一套可用於流動控制之自激振動桿技術,並對一個受
此特殊流動控制方法作用之方柱流場特性進行實驗研究,探討方柱周遭流場受此自 激振動桿激擾後的改變,以及流場改變對尾流特性、表面壓力、以及作用於方柱的 昇阻力之影響,由此而確定此一自激振動桿技術之可行性與特性。所發展之自激振 動桿流動控制技術係利用顫震的原理,促使一個小直徑彈性桿產生振動。其原理是 當一股流體通過一個彈性固體時,由於固態彈性體之彈力與流體對固體所施加的氣 動力之間交互作用,此一固體在某些條件之下能產生週期性的位移運動,也就是週 期性的振動,震動的模式視情況而定。將一根小直徑彈性桿置於方柱週遭特殊的位 置,使得通過小直徑彈性桿的流場所引致之氣動力分佈與此一彈性桿的彈力交互作 用之結果能引起自激振動,此一振動對方柱之邊界層、表面壓力、昇阻力、尾流結
構可產生重大的影響。方柱所受之阻力係數可因此自激振動桿的激擾而下降25%。
ABSTRACT – The flow, vortex shedding, and surface pressure of a square cylinder at
incidence were manipulated by a self-sustained vibrating rod placed around the leading edge of the upwind-facing lateral face. The flow patterns on the cylinder surface was studied by using the surface-oil flow method for the Reynolds number between 4.5 × 10⁴ and 11 × 104 as the incidence angle changes from 0o to 45o. Vortex shedding characteristics were measured by a single-wire hot-wire anemometer and surface pressure distributions were detected by using a home-made linear pressure scanner. The results showed that owing to the influence of the galloping rod, the flow pattern on the agitated face changed from its natural state of dual-ring bubble to the mode of boundary-layer separation. The critical incidence angle separating the subcritical and supercritical modes was advanced to 11o from its natural state of 15o. The locations of the characteristic
points on the cylinder surface were altered by the galloping rod, implying that the whole flow field surrounding the square cylinder was modified by the vibrating rod installed around the leading edge of the upwind-facing lateral face. The Strouhal numbers of the controlled and uncontrolled cylinders did not present significant difference. The variations of the pressure coefficients induced by the galloping rod were closely related with the modification of the flow field on the cylinder surface. The decrease of pressure coefficient on the upwind-facing faces and the increase on the leeward-facing faces reduced the drag of the controlled cylinder by about 25% when compared with the uncontrolled cylinder.
1. Introduction
As a flow passes a square cylinder, complex flow phenomena and behaviors in the vicinity of the surface and the wake region (e.g., flow separation, vortex shedding, and shear-layer instability, etc.) are usually induced. Since the square cylinder has four sharp edges, the separation points are fixed at the leading edges. The aerodynamic behaviors are therefore relatively insensitive to Reynolds number, but are more sensitive to the angle of incidence (Okajima 1982). Consequently the flow characteristics, aerodynamic forces, vortex shedding frequency, heat-transfer performance, etc., would exhibit distinct behaviors at different incidence angles of the square cylinder (Igarashi 1984). Literature discussing the pressure distributions, lift, drag, and vortex shedding characteristics of a square cylinder in crossflow were published during the past decades, e.g., Vickery (1966), Bearman & Trueman (1972), Lee (1975), Obasaju (1983), Norberg (1993), Tamura &
Miyagi (1999), Saha et al. (2000), Dutta et al. (2003), Sarioglu et al. (2005), Lao et al.
(2007), Tong et al. (2008). The pressure coefficients on each flat face of the square cylinder presented complicated, different distributions. The vortex shedding frequency detected in the wake was also found to behave profoundly: the general tendency of the Strouhal number is of a rapid rise at relatively small incidence angles (Knisely 1990).
Some investigators used laser Doppler velocimetry (LDV) or particle image velocimetry (PIV) to measure the time-averaged or instantaneous velocity field in the near wake (Durão et al. 1988; Lyn & Rodi 1994; Lyn et al. 1995; Ozgoren 2006; Hu et al.
2006; Kurtulus et al. 2007). van Oudheusden et al. (2005) reported measurement results in a wind tunnel on the velocity field around a square cylinder by using a PIV.
Time-averaged flow patterns at incidence angles
α
= 0o, 5o, 10o, and 15o were illustrated.At
α = 0
o the boundary layers separated from the leading edges of cylinder side surfaces.Within the areas between the separated boundary layers and the side surfaces, recirculation regions were observed near the downstream portions of the cylinder side surfaces. At higher incidence angles between 5o and 10o, mean-flow reattachment occurred on the side surface which was facing upwind. Huang et al. (2010) combined the surface-oil flow method and topological flow analysis to study the time-averaged flow patterns around a square cylinder in crossflow as well as the correlation between the surface flow patterns abd the wake properties. They found that the time-averaged flows around the square cylinder present three typical patterns – subcritical, supercritical, and
wedge flows. In the subcritical regime ( α
< 15o), the boundary layers separated from the leading edges of the lateral faces of the square cylinder, and never reattached to the surfaces. In-between the separated boundary layers and the lateral faces, small dual-ring bubbles existed near the leading edges of the lateral faces. The characteristic flow patternin the subcritical regime was therefore also denoted as the dual-ring bubble mode. In the supercritical regime (15o <
α
< 45o), the separated boundary layer on the lateral surface facing windward reattached to the surface and hence formed a recirculation bubble. On the lateral surface facing leeward, the separated boundary layer never reattached to the surface; instead, a shallow and wide recirculation bubble covering the rear part of the surface was formed. The characteristic flow pattern in the supercritical regime was therefore also denoted as the single bubble mode. At the incidence angle 45o, a symmetric wedge flow was observed on the two surfaces facing windward. The Strouhal number of vortex shedding, turbulence in the wake, and wake width presented different characteristics in different characteristic flow regimes, and exhibited close correlations with the flow patterns.In order to reduce the drag and to suppress the periodic forces induced by the surface-flow separation and vortex shedding of the square cylinder, a static rod flow-control method has been proposed by Igarashi (1997), Sarioglu et al. (2005), and Zhang et al. (2005). A rigid rod was installed at a distance upstream the square cylinder.
Two flow patterns (cavity and vortex shedding) between the rod wake and the square cylinder were found. Reduction in the drag coefficient of the square cylinder in the range of small incidence angles was observed as the arrangement of the control rod and square cylinder induced cavity flow pattern between the rod wake and the square cylinder.
However, at mid and large incidence angles the drag of the square cylinder was unexpectedly increased by installing the control rod.
The present work was aimed on examining the effectiveness of a flow control method, which was termed the self-excited vibrating rod method (Huang et al. 2006), on
modulation of the surface flow, vortex shedding, and pressure distribution of a square cylinder. For a given configuration of an elastic object, the aerodynamic forces increase rapidly with the crossflow speed, while the elastic stiffness is independent of the crossflow. There exists a critical crossflow speed at which the elastic object becomes unstable. The phenomena of flutter, galloping, and vortex-induced vibration are typical examples of the structural instabilities corresponding to the wings of airplane, ice-coated power lines, and two-dimensional long cylinders, respectively. These phenomena were commonly discussed in the published papers or books regarding the aeroelasticity (Dowell 1978). It was found by Simpson (1971) that an elastic object in a shear flow might present orbiting motions if it was situated under certain critical condition. If an elastic rod is placed near a square cylinder, a shear-flow (with non-uniform velocity distribution) may be induced around the rod because of existence of the square cylinder.
Consequently, a lift force acting on the rod will be generated. Therefore the rod galloping under some conditions will become possible. The galloping phenomenon was used in this work to induce self-excited vibration of a small-diameter rod, and subsequently influenced the boundary layer of the square cylinder. By modulating the surface flow around the cylinder, the pressure distribution, vortex shedding characteristics, and aerodynamic forces were modified.
2. Experimental arrangements
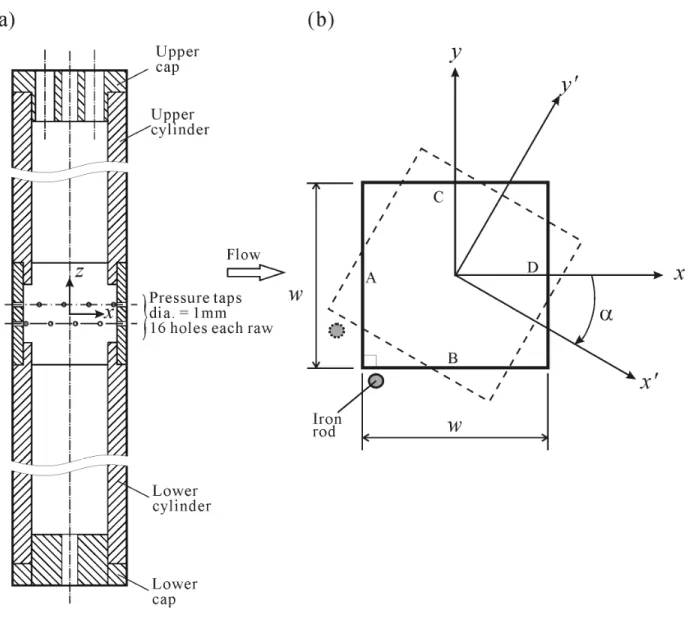
A hollow cylinder of square cross-section, as shown in Fig. 1, made of aluminum alloy (6061TET62) was installed vertically in a wind tunnel for experiments. The side width w = 6 cm and the span length L = 56 cm. The square cylinder had an aspect ratio
L/w = 9.3. The surface of the cylinder was carefully and slightly polished by using wetted
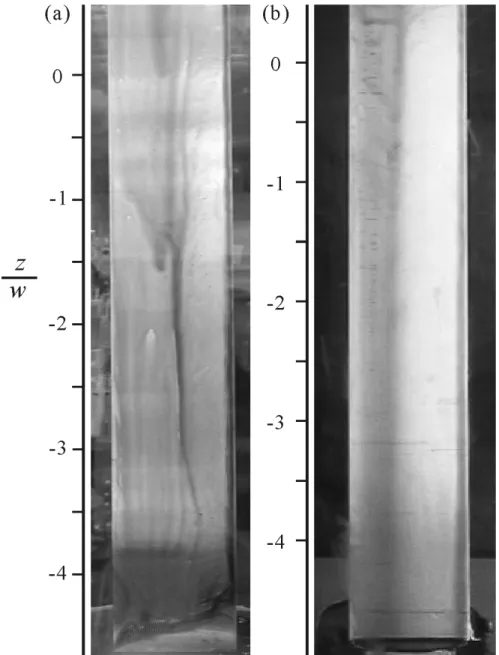
magnesium-oxide particles of 0.2 µm. Circular disks (which acted as end-plates) were attached to the lower and upper ends of the square cylinder. Stansby (1974), Fox & West (1990), Gerich & Eckelmann (1982), and Szepessy & Bearman (1992) discussed the effects of aspect ratio on the pressure force and vortex shedding of a circular cylinder in cross stream. They proposed the use of cylinders with an aspect ratio greater than 30 or employment of end plates to the cylinder with a separation greater than 7 to reduce three-dimensional effects of the flow field. Before the experiments were formally conducted, we performed surface-oil flow tests to check the difference between the cases with and without end-plates. Figure 2 shows pictures of surface-oil flow patterns in the lower portions of the square cylinder at Reynolds number 7.7 × 10⁴. For the case without end-plates (Fig. 2(a)), the oil streaks presented serious three-dimensional characteristics around the end region. For the case with end-plates (Fig. 2(b)), the oil streaks presented visually two-dimensional characteristics at least within the range -3 < z/w < 3. We also placed a one-dimensional hot-wire anemometer in the wake of the square cylinder at various angles of attack and surveyed along the z direction. The detected vortex-shedding frequencies in the wake of cylinder installed with end plates showed uniform distributions at least in the range -3.1 < z/w < 3.1. Observations on the flow patterns and measurements of the surface pressure and vortex shedding properties were focused across the central section of cylinder within z/w = ± 0.5, which was subject to negligibly small three-dimensional effects. The Cartesian coordinate system (x, y, z) was fixed to the mid-span and the center of the square cylinder, as shown in Fig. 1(b). The coordinates did not rotate with rotation of the square cylinder. The freestream direction was always
pointing to +x. The cross-stream and span directions were designated by y and z, respectively. Another coordinate system (x’, y’) was attached to the cylinder and could rotate with it. The incidence angle
α
was defined as zero when x’ coincides with x. When the square cylinder rotated in the clockwise sense, the incidence angleα
was designated as “positive”. The four faces of the square cylinder were designated as A, B, C, and D.Face A was the front surface facing windward. Faces B and C were side faces. Face D was the rear surface facing leeward.
An iron rod of diameter
φ
= 1 mm was installed parallel to the square cylinder and can rotate with the cylinder, as shown in Fig. 1(b). Before conducting formal experiments, suitable locations for installation of the iron rod were surveyed around the square cylinder. The results showed that as the iron rod was placed at the position shown in Fig.1(b), significant vibration was induced within a large range of cylinder incidence angle.
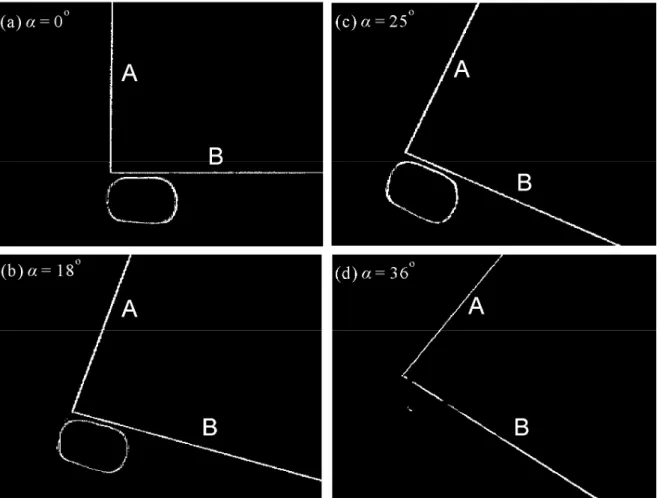
The gap between the rod and the face B was 5 mm and the distance between the rod and the leading edge of face B was also 5 mm. Figure 3 shows the induced orbiting locus of rod vibrating motion at Rew = 7.7 × 10⁴. The pictures were taken by applying a laser-light sheet to cut the horizontal plane at z/w = 0. The camera was arranged above the transparent ceiling of the wind tunnel test section and was facing -z direction. The orbiting motions shown in Figs. 3(a-c) for
α
= 0o, 18o, and 25o looked like a distorted oval. Observation on the planes other than the central plane showed that the rod was vibrating at first mode. No node points were found between the screw-clamped rod ends.The orbiting vibration of the rod was observed within the square-cylinder incidence angle range 0o~26o, therefore Fig. 3(d) for
α
= 36o showed no rod vibration. A photoelectric switch was used to detect the frequency and amplitude of rod vibration. The photoelectricswitch consisted of a 0.75 mm diameter optical fiber transmitter/receiver and a high response photoelectric amplifier was used to detect the vibration frequencies and amplitudes. An optical fiber transmitter/receiver produced a beam of modulated infrared light and received the target-reflected optical signals. The photoelectric amplifier had a frequency response up to 20 kHz, which could output a negative square-wave voltage signal when a light-reflective object passed through the sensible region of the optical transmitter/receiver. The voltage outputs were fed into a fast Fourier transform (FFT) analyzer to extract the frequency of rod vibration. The rod vibration frequency increased a little from 65 Hz to 73 Hz as the Reynolds number increased from 4.5 × 10⁴ to 1.1 × 10⁵. The amplitudes of the rod orbiting motion were 10
φ
~ 15φ
(long axis) and 8.5φ
~ 10.6φ
(short axis) as the Reynolds number increased from 4.5 × 10⁴ to 1.1 × 10⁵.The closed-return wind tunnel used for the experiments had a test-section of 60 cm × 60 cm × 120 cm, made of one polished aluminum alloy plate as the floor and three high-transparency acrylic panels as the ceiling and side walls. The operating freestream velocity U in the test-section was adjustable between 0.3 and 60 m/s by using an electronic inverter. The maximum turbulence intensity was less than 0.2% for U > 3 m/s.
The average freestream velocity U was detected with a retractable Pitot tube along with a high precision electronic pressure transducer. The outer diameter of the Pitot tube was 3 mm. In order not to disturb flow field, the Pitot tube was retracted to the floor of the test-section when the experiments were carried out. The accuracy of the measurement of freestream velocity was affected primarily by the alignment of Pitot tube and the calibration of pressure transducer. With the help of an on-line micro-pressure calibration system and the careful alignment of Pitot tube, the uncertainty of the freestream velocity
measurement at the reading higher than 9 m/s was estimated to be as large as 3% of the reading. For the freestream velocity lower than 9 m/s, in order to avoid the increased inaccuracy induced by the viscous effect of using Pitot tube at low Reynolds numbers, a calibrated hot-wire anemometer was used.
In doing surface-oil flow experiments, mineral oil mixed with a small quantity of blue dye powder was blush-coated on the surface of the square cylinder. The flow directions on the cylinder surfaces were identified in situ from the traces of the oil flow motion and verified off-line from the recorded video movies. Dark traces on the cylinder surface were found where the massive dyed-oil accumulated. Locations of separation and reattachment of the boundary layer on the cylinder surface were identified from the recorded video images of the surface oil-flow patterns. According to the analysis of Squire (1961) and Merzkirch (1974), the uncertainty of identifying the position of characteristic points by using the surface-oil flow visualization method would be less than 8% at freestream velocity U = 5 m/s. The uncertainty decreased with increasing the freestream velocity.
The instability frequencies in the wake of the square cylinder were detected by a home-made, constant-temperature, one-component hot-wire anemometer. The probe was placed at the position where the periodical signals revealed local maximum amplitudes.
The output signals of the hot-wire anemometer were fed simultaneously to an FFT analyzer and a high-speed PC-based data acquisition system. During the experiment, the output signals of the hot-wire anemometer were monitored by using the FFT analyzer through the time and frequency domains to assure the appropriation of the probe position at all times. The hot wire probe used was TSI 1210-T1.5. The original tungsten wire was
replaced by a platinum wire. The wire diameter and length were 5 µm and 1.5 mm, respectively. The dynamic response frequency corresponding to the electronic square-wave test was adjusted to 20 kHz. The sampling rate and the elapse time of the data acquisition system were set to 25,000 samples/s and 5 s, respectively. The uncertainty of the frequency detection was estimated to be within ±0.75 percent of the reading.
Measurements of time-averaged surface pressure distributions were done through a special design of square cylinder. The hollow square cylinder was composed of three sections and two caps, as shown in Fig. 1(a). The central section had a height of 6 cm.
Thirty two pressure taps in total were carefully made and evenly distributed around the peripheral of the central section of the square cylinder in two rows. The diameter of the tap hole and spacing between two neighboring taps were 1 mm and 6.67 mm, respectively. For each tap, a short stainless steel tube was tightly inserted into the tap hole from the inside of the hollow cylinder and subsequently connected to a plastic polyester tube. The polyester tube was led through a hole located at the upper cap of the cylinder and connected to a home-made pressure scanner. The pressure signals transmitted through the taps, small-diameter stainless steel tubing, polyester tubing, and finally attained the home-made computer-based pressure scanner. The pressure scanner used a personal computer and a logic circuit to control the states (on/off) of 32 electromagnetic valves. The electromagnetic valves may be opened and closed sequentially at a preset through-time, shut-off time, and scanning rate. The pressure sensor was piezoelectric type with a full scale of ±127 mmAq. It was constantly calibrated with a micro-pressure calibrator to an uncertainty of 0.01 mmAq. The output analog signals of the pressure
sensor were sampled by a personal computer-based data acquisition system. The data acquisition system had a resolution of 12 bits. The data acquisition started at the sixth second of the through-time and elapsed for 12 seconds. The sampling rate and record length were 3,000 Hz and 36,000 samples, respectively.
3. Results and discussion
3.1. Surface flows
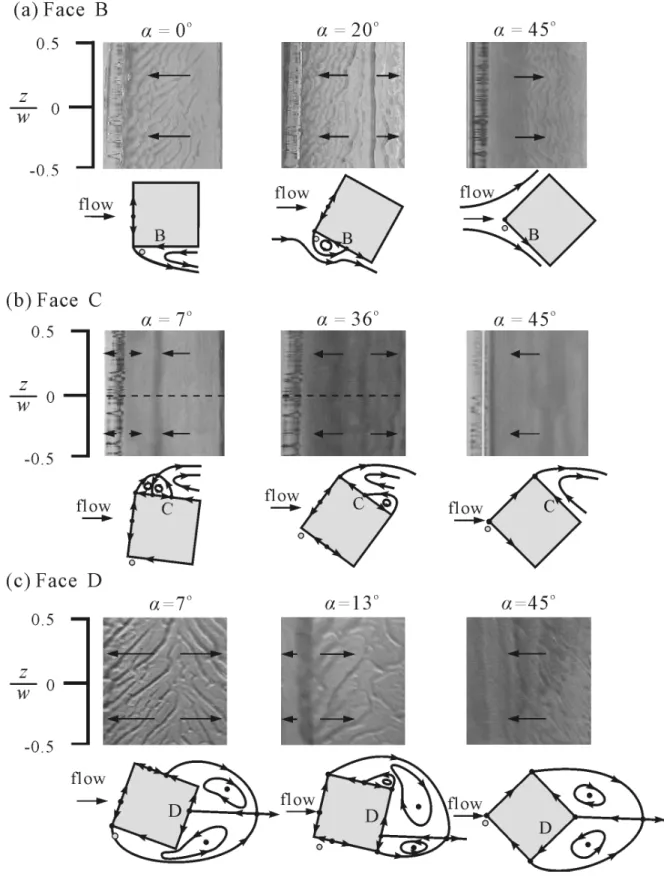
Figure 4 shows the typical pictures of the dyed oil flow on faces B, C, and D around the middle section of the square cylinder subject to the influence of galloping rod at Rew
= 7.7 × 10⁴. The surface-oil flow pattern on face A is not shown because it appears regularly as a stagnation flow reported by many investigators—a dark oil strip with oil flows at two sides of it going towards edges of face A because the free stream impinges on face A and bifurcates at the location of the stagnation point. The surface-oil flow patterns on face B are shown in Fig. 4(a). At
α
= 0o, no particular oil strip appears. The arrow signs marked on the plots indicated the visual oil-flow directions. All visual oil flows go towards the leading edge of face B. By considering the flow topology, the scenario of the flow structure should be a reverse flow on face B as presented in the hand sketch beneath the picture. All the surface-oil flow patterns within the rageα
< 11o present appearances similar to the picture of Fig. 4(a), i.e., a boundary layer separation happens at the leading edge of face B, and no reattachment of the separated boundary layer occurs subsequently on face B. Under uncontrolled condition (Huang et al. 2010), a dual-ring bubble would appear near the leading edge of face B atα
< 15o. When the rod vibration is applied, the flow pattern on face B within the rangeα
< 11o becomes simplyboundary-layer separation because the vibration motion of rod agitates the flow near the leading edge of face B and smears off the dual-ring bubble which originally exists there under uncontrolled condition. The effect of breaking down the dual-ring bubble lasts until
α
< 11o, then the flow pattern changes. In the range 11o <α
< 45o, the surface-oil flow on face B presents a pattern similar to that atα
= 20o of Fig. 4(a)—a single dark oil-strip appears. The flows on two sides of the single dark oil strip go away from the strip.Because the surface flow upstream the strip goes upstream and the surface flow downstream the strip goes downstream, the dark strip is thus a three-way saddle with the flow above the strip going towards the strip. The dark oil strip is induced by the reattachment of the separated boundary layer. In the hand sketch beneath the picture, the black dot marked on face B denotes the dark oil strip (or the reattachment point) in the picture. A recirculation bubble must exist between the three-way saddle and the leading edge of face B. At
α
= 45o, no accumulated dark oil strip is observed and the surface-oil flow goes downstream without any reversal. This flow pattern is induced because atα
= 45o the free stream impinges at the junction between face A and face B and bifurcates to the downstream region along faces A and B.The surface-oil flow patterns on face C, as shown in Fig. 4(b), present a little complex scenario than those on face B. All the surface-oil flow patterns at
α
< 11o present features similar to that shown forα
= 7o of Fig. 4(b)—two oil strips appear on face C. The surface-oil flows on two sides of the upstream oil strip direct away from the strip. While those for the downstream oil strip direct towards the strip. This surface-oil flow pattern on face C atα
< 11o is similar to the “dual-ring bubble” mode pattern observed atα
< 15o on the corresponding face of an uncontrolled square cylinderillustrated by Huang et al. (2010). By considering the flow topology, the scenario of the flow structure should compose of a dual-ring bubble in the upstream portion and a reverse flow region in the downstream portion of face C, as presented in the hand sketch beneath the picture. A four-way saddle exists at the vertex of the dual-ring bubble. The fundamental flow pattern on face C is not changed by the galloping rod installed near the leading edge of face B. However, the range of incidence angle where the pattern exists reduces from 15o to 11o. Besides, the locations of stagnation points (or the length of dual-ring bubble) are changed as well by the galloping rod (this will be illustrated in the later section). In the range 11o <
α
< 45o, the surface-oil flow on face C presents a pattern similar to that atα
= 36o of Fig. 4(b)—a single dark oil strip appears. The flows on two sides of the single dark oil strip go away from the strip. At first glance, one may consider that the reattachment of the separated boundary layer originated from the leading edge of face C arises here. In order to confirm the topological flow pattern, a special local flow visualization method was employed. A tiny quantity of TiCl4 liquid droplet was introduced by using a 0.2 mm diameter metal wire to the regions near the leading edge and trailing edge of face C. The local flow became observable through the motion of white TiO2 particles (the TiO2 smoke particles were generated through the chemical reaction TiCl4 + 2H2O → TiO2 + 4HCl). The TiO2 smoke particles introduced to the region near the leading edge of face C did not recirculate, evidencing that no recirculation region existed near the leading edge. While the smoke particles introduced to the region near the trailing edge of face C circulated there for quite a long period before they diffuse away, showing that a recirculation zone existed near the trailing edge. Therefore the separated surface flow evolving from the leading edge of face C does not reattach to faceC; the flow structure on face C therefore would not behave similarly to that at
α
= 20o of Fig. 4(a). Since the surface flows on both faces C and D near the junction between faces C and D go towards the junction (Fig. 4(c)), a separatrix evolving from the junction between faces C and D would go outwards from the junction. This separatrix leaving the junction between faces C and D would be deflected upstream by the reverse flow in the cylinder wake, reattach to face C, and form a recirculation bubble which covers the rear part of face C, as shown in the hand sketch beneath the picture atα
= 36o of Fig. 4(b).With this structure, the separatrices and alleyways can satisfy the flow directions and three-way saddle identified in the surface-oil flow pattern. This scenario is similar to that observed on face C of the uncontrolled square cylinder in the supercritical regime for 15o
<
α
< 45o. Placing the vibrating rod near the leading edge of face B could cause the flow patterns on both the faces B and C to change synchronously from subcritical to supercritical mode at an advanced incidence angle 11o. Atα
= 45o, no accumulated dark oil strip is observed and the surface-oil flow goes downstream without any reversal, as that has been show for face B.The typical surface-oil flow patterns on face D (i.e., the rear face) are shown in Fig.
4(c). When the incidence angle is smaller than 45o the single dark oil strip pattern, as typically shown in the pictures for
α
= 7o and 13o, is always observed. The single oil strip in the rangeα
< 11o is always located in the right portion (+x’) of face D. While the single oil strip in the range 11o <α
< 45o is always located in the left portion (-x’) of face D. The oil flows on two sides of the dark oil strip go away from the strip. Apparently, the single dark oil strip appearing on face D is a three-way saddle. The flow above the strip goes towards it. In order to comply with the flow directions and the three-way saddlesidentified from the surface-oil flow pattern, a large recirculation bubble with a four-way saddle existing at a position far from face D in the wake region is proposed in the hand sketches beneath Fig. 4(c). At
α
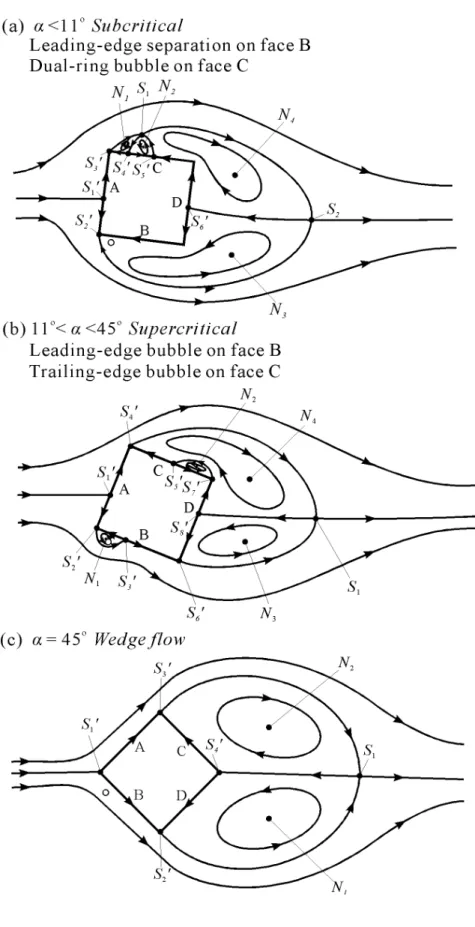
= 45o, the characteristic flow pattern changes: the oil strip disappears and the oil flow on face D goes towards the junction between faces D and B. This change is very sensitive to the incidence angle.According to the results and analyses of flow visualizations discussed in the above paragraphs, the two-dimensional topological flow patterns of subcritical (
α
< 11o),supercritical (11
o <α
< 45o), and wedge (α
= 45o) flow modes around the square cylinder are proposed in Figs. 5(a), 5(b) and 5(c), respectively. The patterns represent time-averaged flow characteristics because they are obtained from the surface-oil flow patterns, instead of the instantaneous smoke streak flow patterns. By virtue of Chong &Perry (1990), the topological flow pattern is characterized by critical points, separatrices, and alleyways. Hunt et al. (1978) have illustrated several characteristic critical points and separatrices like nodes, center, focus, saddle, bifurcation, etc. In the present case, the critical points consist of saddles and nodes. As shown in Fig. 5(a) for the range
α
< 11o, which is termed the subcritical mode, a forward stagnation point (S1’), which is a three-way saddle, appears on face A. The bifurcated flows on face A separate at the two front corners and form two three-way saddles S2’ and S3’. Near the upstream part of faces B, the boundary layer separates so that the reverse flow was observed on face B. On face C, a dual-ring bubble is characterized by three-way saddles (S4’ and S5’), four-way saddles (S1), and nodes (N1 and N2 centering at the dual-ring bubble). The dual-ring bubble is composed of two counter-rotating vortices. The three-way saddles S4’ and S5’ on face C denote the upstream and downstream oil strips shown in the picture forα
= 7oof Fig. 4(b). An aft stagnation point S6’ on face D and a four-way saddle S2 in the near wake region construct a large near-wake bubble. The large bubble located downstream face D is composed of two large counter-rotating vortices which are centered at the nodes
N
3 and N4. This recirculation bubble looks similar to those usually found in a bluff-body wake. For the uncontrolled square cylinder in crossflow (Huang et al. 2010), the dual-ring bubbles appear on both faces B and C in the subcritical regimeα
< 15o. Modulated by the galloping rod, the range of incidence angle for the subcritical mode reduces from 15o to 11o, the dual-ring bubble near the leading edge of face B disappears, and the boundary layer separates from there without reattachment. Hunt et al. (1978) obtained a general formula for the relationship between the number of nodes (including four-way nodes N and three-way nodes N’) and saddles (including four-way saddles S and three-way saddles S’) for the flow around the surface obstacles. The topological rule proposed byHunt et al. (1978) is (∑N + 2
1∑N’) - (∑S + 2
1∑S’) = 1 - n, in which n is the connectivity
of the section of the flow under consideration. In this case, n = 2 because one solid obstacle is present in the flow field. By counting the number of critical points in Fig. 5(a),
N = 4. N’ = 0, S = 2, S’ = 6, it is obvious that the proposed flow pattern satisfies the
topological rule (∑N +2
1∑N’) - (∑S + 2
1∑S’) = -1.
The supercritical and wedge flow patterns are shown in Figs. 5(b) and 5(c), respectively. Figure 5(b) shows the single bubble existing near the leading edge of face B and the trailing edge of face C, as demonstrated in previous paragraphs. Figure 5(c) presents the time-averaged regular flow pattern similar to a flow passes across a wedge.
These topological flow features were the same as those delineated by Huang et al. (2010)
for the square cylinder in crossflow without subject to the influence of the vibrating rod.
The primary difference in the flow pattern is that the inception incidence angle for the supercritical mode is advanced from 15o to 11o. The locations of critical points are altered as well by the galloping rod and are illustrated in the following section.
3.2. Locations of critical points
During the experiment, a transparent scale, which is made of polynomial thin film of 15 µm in thickness, is attached to the cylinder surface to assist reading of the position of the dark oil strip. When measuring the positions of the dark oil strips, the images are magnified to about five times of the real scales and projected to the screen in order to reduce the measurement error.
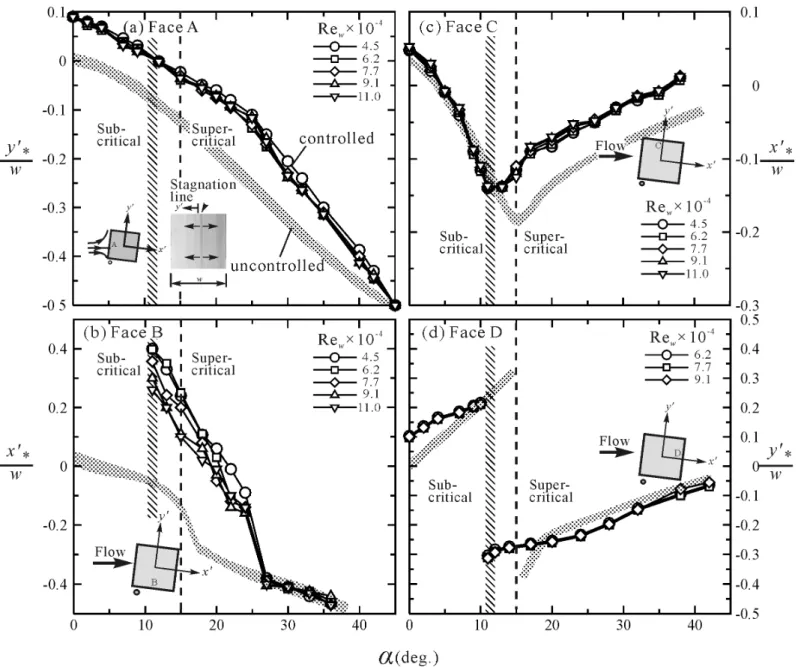
The normalized location
y
∗′/w
of the stagnation point on face A is shown in Fig.6(a). The Reynolds number does not appreciably affect the position of the stagnation point. At
α
= 0o, the stagnation point of the controlled cylinder is located aty
∗′/w
≈ 0.1 of face A. It is deviated from the center (y
∗′/w
= 0) of face A. In the rangeα
< 26o (which the control rod vibrates),y
∗′/w
decreases almost linearly with the increase of incidence angle. Forα
> 26o,y
∗′/w
decreases linearly with increasing the incidence angle at a decrease rate faster than that in the rangeα
< 26o. Although face A is located in the region upstream faces B, C, and D, the location of the stagnation point on face A of the controlled cylinder apparently is dramatically influenced by the vibrating rod: it deviates towards the junction between face A and face C when compared with that of the uncontrolled cylinder. The data for the uncontrolled cylinder which are highlighted by the dotted band were by courtesy of Huang et al. (2010). The change of surface flow modeon face B should be an important factor participating in the modification of the stagnation location on face A. Applying agitation in the separated boundary layer of face B causes change of flow characteristics. The signal of downstream-flow change on face B feedbacks to the upstream face A and causes the stagnation point on face A to shift from its natural state. The flow around the square cylinder presents strong elliptic characteristics because of the reverse flow which is induced by the sharp corner angles.
The normalized location
x
∗′/w
of the single oil strip of the supercritical mode on face B is shown in Fig. 6(b). The stagnation point induced by reattachment of the separated boundary layer is located in the downstream portion (x
∗′/w
> 0) of face B at the incidence angles smaller than about 21o, which indicates a large recirculation bubble existing on face B at 11o <α
< 21o. Atα
≈ 11o, the recirculation bubble on face B of the controlled cylinder can even cover almost 90% of face B. The normalized bubble length (equaling to the value ofx
∗′/w
+0.5) of the uncontrolled cylinder is significantly smaller than that of the controlled cylinder. After the rod ceases to vibrate (α
> 26o), the bubble length on face B of the controlled cylinder shortens abruptly and behaves similarly to that of the uncontrolled cylinder.The normalized locations
x
∗′/w
of the downstream three-way saddle on face C, as shown in Fig. 6(c), behave differently from those shown in Fig. 6(b) for face B. For the control cylinder in the subcritical regime, the downstream strip on face C atα
= 0o is located atx
∗′/w
≈ 0.05, which is a little downstream of the middle of face C. It moves upstream as the incidence angle is increased and reachesx
∗′/w
≈ -0.14 at the critical incidence angleα
= 11o. As the flow pattern changes to the supercritical mode in therange 11o <
α
< 45o, the dark oil strip does not move further upstream. Inversely, it moves towards the center of face C as the incidence angle is increased. The positions of the three-way saddles on faces B and C in the supercritical regime show different behaviors because the flow structures on these two faces are different—on face B it is a leading-edge recirculation bubble induced by reattachment of the separated boundary layer, while on face C it is a wide, shallow recirculation bubble covering the rear part of face C. The length of the leading-edge bubble on face B decreases with increasing the incidence angle, while the length of the trailing-edge bubble on face C increases with increasing the incidence angle. The curve of the stagnation point location of the vibrating-rod controlled cylinder behaviors similarly to that of the uncontrolled cylinder because the surface flow patterns of these two situations are similar. However, since the critical incidence angle is advanced from 15o for the uncontrolled cylinder to 11o when the rod vibration is applied, the inverse points (the minimum values) of the curves in Fig.6(c) are also shifted from15o to 11o accordingly. As discussed previously, the change of flow pattern on face B causes change of flow field on face A. The modified flow on face A changes the boundary layer approaching the junction between face A and C. The location of the stagnation point on face C of the controlled cylinder therefore behaves differently from its counterpart of uncontrolled case even though the surface-oil flow patter looks qualitatively unchanged (i.e., dual-ring bubble and single-ring bubble in subcritical and supercritical regimes, respectively).
The normalized location
y
∗′/w
of the stagnation point on face D is shown in Fig.6(d). At
α
= 0o, the dark oil strip of the controlled cylinder is located aty
∗′/w
= 0.1 which is not the center of face D. The vibrating rod placed near the leading edge of faceB causes different surface-flow patterns appearing on face B and C, and subsequently induces unbalanced time-averaged wake in downstream region. The location of the stagnation point on face D of the controlled cylinder therefore is shifted from the center position of face D. In the subcritical regime the normalized location of the dark oil strip moves towards the junction between faces C and D and attains
y
∗′/w
≈ 0.21 asα
approaches the critical incidence angle of 11o. As the incidence angle just passes the critical incidence angle, the dark oil strip shifts drastically fromy
∗′/w
≈ 0.21 tow
y
∗′/ ≈ - 0.31. Continuing to increase the incidence angle in the supercritical range makes the dark oil strip move towards the center of face D.3.3. Vortex shedding and wake width
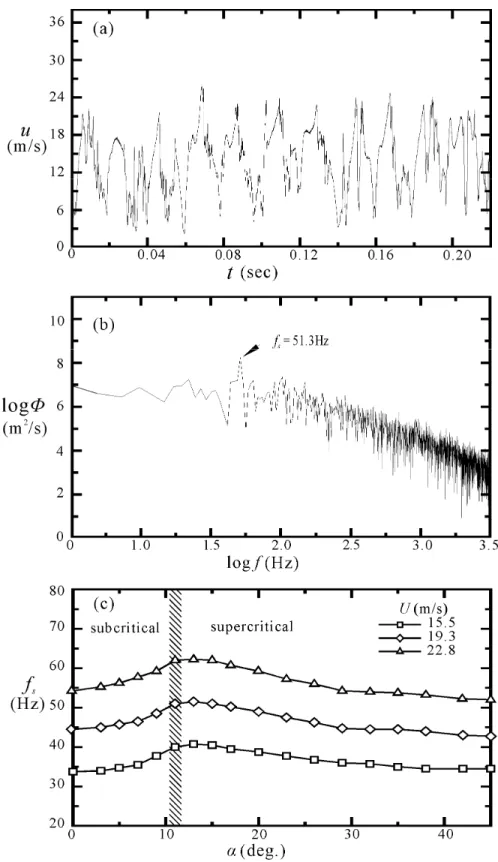
Figure 7(a) shows typical velocity signals detected in the near wake by applying a single-wire probe of the hot-wire annemometer at Rew = 7.7×10⁴. The measurement position is at (x/w, y/w, z/w) = (3, 0.5, 0). It shows typical vortex shedding signals superimposed by turbulent fluctuations in time domain. Converting the time series to frequency domain by using the fast Fourier transform (FFT) technique, the power spectrum density function is obtained, as shown in Fig. 7(b). The vortex shedding frequency fs corresponding to the time series of Fig. 7(a) is 51.3 Hz, as indicated by the peak value of Fig. 7(b). Figure 7(c) shows the frequency distributions of the vortex shedding, which are obtained from the power spectrum density functions for 0o ≤
α ≤ 45
o at various freestream Reynolds numbers. It is apparent that for each specific freestream Reynolds number, the vortex shedding frequency increases with increasing the incidence angle from a low value atα
= 0o to a hump which located aroundα = 11
o ~ 15o, thendecreases gradually.
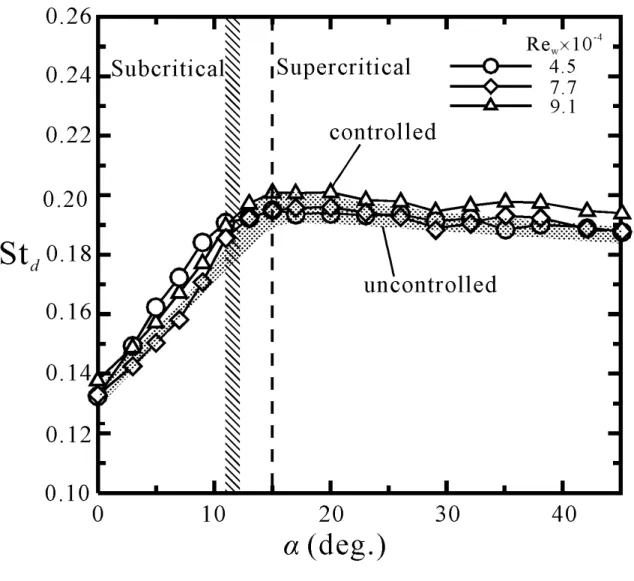
The raw frequency data are converted to a Strouhal number Std based on the width of the cylinder projection on the cross-stream plane (the y-z plane), d, which is calculated according to the formulae
d
/w
= 2sin(45o+α). The reason why the projection widthd is used as the length scale for calculation of Strouhal number instead of the cylinder
width w is due to the conventional usage for non-circular objects, for instance a flat plate, airfoil, elliptic oval, wedge, etc. Roshko (1955) found that at Reynolds numbers between 103 and 105 the Strouhal number based on the cross-stream length scale remains nearly constant of 0.21, 0.18, and 0.14 for a circular cylinder, 90-degree wedge, and flat plate, respectively. The correlations between the Strouhal number and the incidence angle are shown in Fig. 8. The Strouhal numbers of both the controlled and uncontrolled cylinders increase with increasing the incidence angle from about 0.14 at
α
= 0o to maximum values about 0.2 atα
= 15o, then decrease a little and gradually levels off asα
becomes greater. The change of flow modes induced by the vibrating rod does not advance the maximum Strouhal numbers fromα
= 15 o to 11o.The physical insight of the phenomenon that the change of flow modes induced by the vibrating rod does not advance the maximum Strouhal numbers to
α
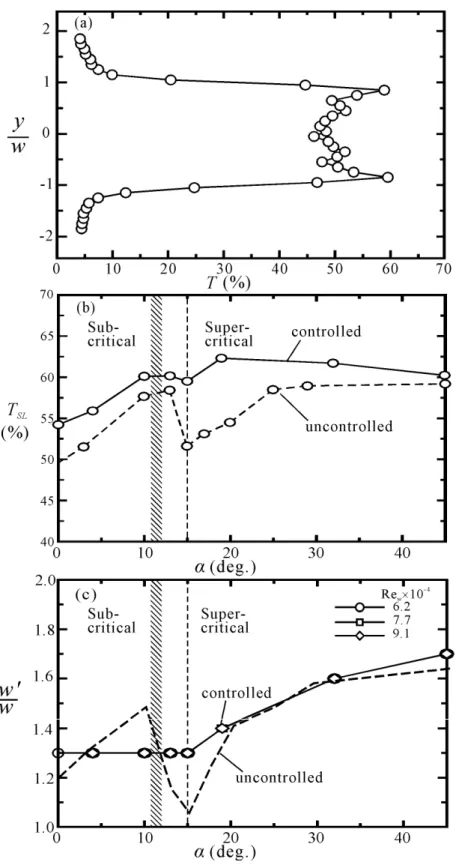
= 11o may be considered by examining the variation of the wake width. Simmons (1977) introduced a“universal” Strouhal number based on the measured wake width for several types of two-dimensional bluff bodies. They found that a narrow wake may imply a large vortex-shedding frequency, and vice verse. It is difficult to identify the wake width according to the cross-stream distributions of the time-averaged axial velocities. The cross-stream distribution of the turbulence intensities, as typically shown in Fig. 9(a) for
Rew = 7.7 × 10⁴, presents a twin-peak pattern. The peak values of the turbulence-intensity distributions would appear in the shear layers (Brown & Roshko 1974). The distance between these two peaks could be used for indexing the length scale of the wake width.
Figure 9(b) shows the maximum turbulence intensities in the shear layers at Rew = 7.7 × 10⁴. The turbulence intensities in the shear layer of the controlled cylinder are apparently higher than those of the uncontrolled cylinder, which may be induced by the agitation effect of the vibrating rod. For the controlled cylinder, in the subcritical regime (
α
< 11o) the maximum turbulence intensity TSL increases with increasing the incidence angle. It presents a local minimum atα
= 15o. The uncontrolled cylinder behaves similarly with the controlled one: a local minimum appears atα
= 15o. The rod vibration, although changes the surface flow modes and advances the critical incidence angle between the subcritical and supercritical modes from 15o to 11o, it does not affect the incidence angle which the local minimum value of the maximum turbulence intensity appears. The wake widths identified by the transverse distance between the peak turbulence intensities appearing in the shear layers are illustrated in Fig. 9(c). The wake width of the controlled cylinder does not vary appreciably forα
< 15o. Afterα
> 15o, it increases with the increase of incidence angle. The Strouhal number shown in Fig. 8 therefore presents maximum values atα
= 15o.3.4. Surface pressure and lift/drag coefficient
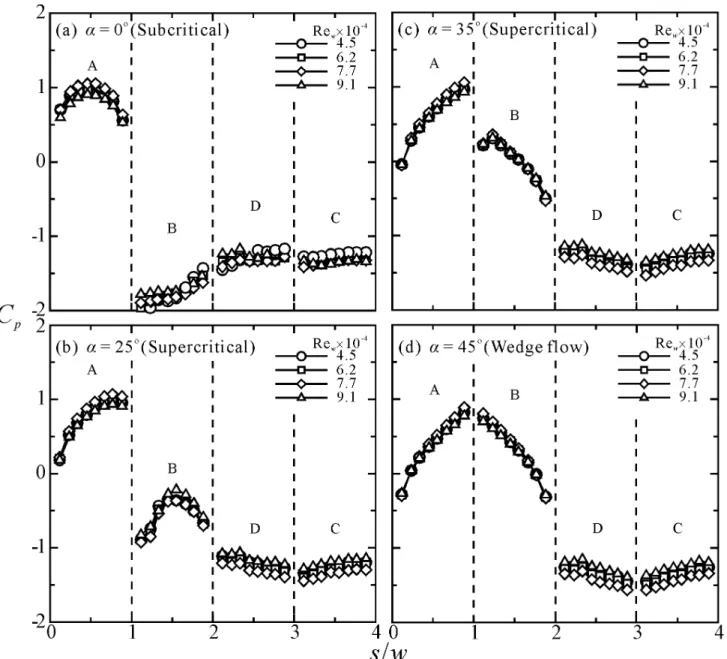
Figure 10 shows the measured distributions of the surface pressure coefficient Cp
on
faces A - D of the controlled cylinder. The pressure coefficient is defined as Cp≡ (p -
p
o)/(0.5×ρ U
2), where p denotes the measured local surface static pressure and po,ρ
, andU are the static pressure, density, and freestream velocity, respectively. The symbol s
used for the horizontal axis of Fig. 10 denotes the distance measured along the peripheral of the square cylinder. It is originated from the junction between faces A and C, therefore
s/w = 1 at the junction between faces A and B. Distributions of the surface pressure
coefficients behave significantly different in three characteristic regimes of subcritical,
supercritical, and wedge flows. On face A, the surface pressure coefficients present all
positive values for 0o ≤
α
< 35o. The downstream portion (near the junction between face A and C) of face A exhibits negative pressure coefficient for 35o ≤α
≤ 45o, indicates that the flow-induced pressure decrease overwhelms the positive effect induced by impingement around the downstream edge of face A.On face B, the distributions of the surface pressure coefficients present different fashions in three characteristic flow regimes of subcritical, supercritical, and wedge flows. In Fig. 10(a) for
α
= 0o, the surface pressure coefficients on face B are negative and low because the boundary layer which separates from the upstream edge of face B does not reattach to the surface, as has been shown in Fig. 5(a). The surface pressure coefficient is low to about -1.8 near the leading edge of face B, then increases to about -1.4 in the downstream portion of face B. In Figs. 10(b) and 10(c) forα
= 25o and 35o, respectively, in the supercritical regime, the surface pressure coefficients near the leading edge of face B increase from low values to maximum values, then decrease subsequently towards the trailing edge. The maximum values of pressure coefficients coincide with the reattachment points obtained by the surface-oil flow method shown in the supercritical regime of Fig. 6(b). The location of the maximum surface pressure coefficient on face B moves upstream with increasing the incidence angle because the length of therecirculation bubble which is induced by the reattachment of the separated boundary layer reduces with the increase of incidence angle as discussed previously. The location corresponding to the extreme values of the surface pressure coefficient on face B moves towards the junction between faces A and B (s/w =1) with increasing the incidence angle.
The whole profile of the surface pressure coefficient is raised in values with the increase of incidence angle. This is attributed to the increase of the angle between the freestream direction and face B which is increased with increasing the incidence angle, and therefore gains in the dynamic-pressure component normal to face B. As
α
> 30o, e.g. atα
= 35o as shown in Fig. 10(c), the surface pressure coefficients around the upstream portion of face B can attain a positive value about 0.3. Atα
= 45o (i.e., the wedge flow), as shown in Fig.10(d), the maximum pressure coefficient is raised to about one, which is located at the junction between faces A and B, and the distribution curves of pressure coefficient on faces A and B become almost symmetric about the vertex at s/w =1.
On faces C, the surface pressure coefficients always present low negative values in three characteristic flow regimes because the boundary layer separated from the leading edge of face C never reattaches to the surface. In the subcritical regime, as typically shown in Fig. 10(a) for
α
= 0o, traces of local minimum values, though unclear, can be observed for s/w between 3 and 4. The locations of the unclear minimum surface pressure coefficients correspond to the positions of the downstream three-way saddle (with the flow above the saddle going outwards from it) shown in Fig. 5(a). When the flow pattern changes to the supercritical and wedge modes, as shown in Figs. 10(b) - 10(d) forα
= 25o, 35o, and 45o, the surface pressure coefficients on face C slightly decrease from about -1.3 around the upstream edge (s/w ~ 4) to about -1.5 around the downstream edge (s/w ~ 3).The effect of lowering the surface pressure coefficient which is induced by the large near-wake bubble obviously is more appreciable than that which is induced by the boundary-layer separation at the upstream edge of face C.
On face D, the surface pressure coefficients always present low negative values in three characteristic flow regimes because a large recirculation bubble always exists in the wake region downstream the face D. The profiles of the pressure coefficient in the
subcritical regime behave differently from those in the supercritical regime. In the supercritical regime, it decreases from about -1.2 around s/w ~ 2 to about -1.4 around s/w
~ 3. The pressure coefficients in the subcritical regime do not have this tendency. The partial reason might be that the incidence angle is small (
α
< 11o) and therefore the near-wake flow is not far from symmetry about the x-axis. Atα
= 45o, the distributions of the surface pressure coefficients on faces D and C become symmetric about the junction between the two faces (s/w = 3).The surface-averaged pressure coefficients
c
p on each face of the square cylinder at various incidence angles are shown in Fig. 11. Atα
= 0o, as shown in Fig. 11(a),c
p on the front face A has a positive value about 0.83, while those on the lateral faces B and C and the rear face D are all negative. The values ofc
p on faces A and B of the controlled cylinder are generally a little smaller than those of the uncontrolled cylinder.While the situations on faces C and D are reversed—the values of
c
p on faces C and D of the controlled cylinder are significantly larger than those of the uncontrolled cylinder.For incidence angles from 0o to 45o, the surface-averaged pressure coefficients on face A present all positive values. In the subcritical regime where the incidence angle is small,
the values of
c
p,A do not vary significantly. As the incidence angle becomes greater than the critical value (11o for the controlled case and 15o for the uncontrolled case),c
p,A decreases quickly with the increase ofα
in the supercritical regime because the component of the freestream momentum normal to the surface decreases with the increase of incidence angle.On face B, as shown in Fig. 11(b), the surface-averaged pressure coefficient
c
p,B remains low and negative values in the subcritical regime because the boundary-layer separates at the upstream edge of face B. Asα
exceeds the critical value,c
p,B increases rapidly with the increase of incidence angle in the supercritical regime because the separated boundary layer reattaches to the face B and forms a single bubble on the upstream portion of face B. The component of freestream momentum normal to the surface plays a role in increasing the surface pressure and would increase with the increase of incidence angle in this regime. The length of the recirculation bubble shortens as the incidence angle increases (as has been shown in Fig. 6(b)) and the component of freestream momentum normal to the surface also increases; therefore the surface-averaged pressure coefficient increases rapidly in the supercritical regime. The negative effect induced by the recirculation bubble and the positive effect induced by the freestream momentum component normal to the surface attains balance atα
= 35o and hence makesc
p,B approach about zero. Atα
> 35o,c
p,B presents positive values.On face C, the surface-averaged pressure coefficient presents negative values for all incidence angles because the boundary layer separated from the leading edge of face C never reattaches to the surface and the surface always face lee-wards for