行政院國家科學委員會專題研究計畫 成果報告
網路化感性意象調查與分析系統之建構(II)
計畫類別: 個別型計畫
計畫編號: NSC93-2411-H-011-009-
執行期間: 93 年 08 月 01 日至 94 年 07 月 31 日 執行單位: 國立臺灣科技大學工商業設計系
計畫主持人: 陳玲鈴
計畫參與人員: 莊雅量、黃賜濱、邱靈均、康獻章
報告類型: 精簡報告
報告附件: 出席國際會議研究心得報告及發表論文 處理方式: 本計畫可公開查詢
中 華 民 國 94 年 11 月 1 日
行政院國家科學委員會補助專題研究計畫 ▓ 成 果 報 告
□期中進度報告 網路化感性意象調查與分析系統之建構(II)
計畫類別:▓ 個別型計畫 □ 整合型計畫 計畫編號:NSC93-2411-H011-009
執行期間: 93 年 8 月 01 日至 94 年 7 月 31 日
計畫主持人:陳玲鈴 共同主持人:
計畫參與人員: 莊雅量、黃賜濱、邱靈均、康獻章
成果報告類型(依經費核定清單規定繳交):▓精簡報告 □完整報告
本成果報告包括以下應繳交之附件:
□赴國外出差或研習心得報告一份
□赴大陸地區出差或研習心得報告一份
■出席國際學術會議心得報告及發表之論文各一份
□國際合作研究計畫國外研究報告書一份
處理方式:除產學合作研究計畫、提升產業技術及人才培育研究計畫、
列管計畫及下列情形者外,得立即公開查詢
□涉及專利或其他智慧財產權,□一年□二年後可公開查詢
執行單位:國立台灣科技大學設計研究所
中 華 民 國 94 年 7 月 31 日
網路化感性意象調查與分析系統之建構(II)
中文摘要
在充滿幢憬的二十一世紀初葉,使用者體驗儼然成為設計產業的重要趨勢。本研究延 續九十二年度所完成之感性工學資訊系統,分別針對電腦輔助意象調查方法,以及調查完 成後將各研究成果整合的機制,進行深入探討。
在意象調查方法方面,本研究運用電腦之即時運算與互動優勢,開發出兩種操作形式 的電腦輔助意象調查方法。一為「以意象為主的調查方法」,讓受測者可以有如在商店裡 選購產品般地針對每一個指定的意象尺度,評比各產品所傳達的感覺意象。另一方法為「以 刺激物為主的調查方法」,讓受測者針對每一個刺激物做整體的評比,待完成所有刺激物 的調查後,再綜合瀏覽各意象尺度的評比結果,同時做必要的調整與修正。為進一步瞭解 這兩個方法在資料收集上的表現情形,本研究將現階段大多數研究者所使用的紙筆調查方 法做為對照組,以受測者間設計的實驗探討,歸納出電腦輔助調查方法的優點。
整體而言,紙筆調查與電腦輔助方法在效率上不相上下,然而,在受測者的操作評比
與資料收集的效果方面,電腦輔助方法都明顯優於紙筆調查。其中, 「以意象為主的調查
方法」不但善用即時運算與互動機制,提升調查結果的信度,而且透過同時針對所有刺激 物進行評比的調查方式,獲得最佳的表現。
在意象研究成果的整合部分,本研究以九十二年度所完成之感性工學資訊系統為共通 的平台,將意象研究的成果,透過可擴充標示語言架構(XML),整合成一個豐富的感性 資料庫,讓設計師能夠依照其工作需求,搜尋相關的意象資料,並將之運用於設計創作中。
同時,相關研究也能透過跨平台的比較與討論,整合成更紮實的知識與理論。
關鍵字:感性工學、意象調查方法、語意差異法、可擴充標示語言
Abstract
User experience is one of the most important issues in the field of design. Lots of methods have been proposed for experience design, among which, Kansei Engineering is frequently employed for helping designers understand users’ feeling and applying it to products. To extend the Computer- Aided Kansei Engineering System built last year, this research studies the preliminary data collection methods and the terminal mechanism to integrate relevant research results.
Based on the understanding of various data collection methods, in this study, two types of computer- assisted rating methods with interactive comparing mechanism are developed. First, the focus-on-adjective method simulates the decision making process in people’s daily life. A participant rates the stimulus in comparison with others under specific concepts. Second, the focus-on-stimulus method tries to eliminate the potential influences from other stimuli. A participant rates every stimulus separately, and then adjusts the overall rating result. In order to compare these two computer-assisted methods to the widely used pencil-n-paper method, kettles are used as examples to experimentally evaluate the performance of these methods. Participants rate the kettles with different methods in a randomly assigned sequence, once a week.
After all of the three methods are evaluated, a specifically developed sorting experiment is conducted to collect the most likely opinion of every participant. The result is reviewed and adjusted more than twice and is treated as the pseudo-answers for comparing the different survey methods.
Comparing to the widely used paper-and-pencil method, in this study, the benefits of computer-assisted rating method and the proposed real-time revising mechanism are highlighted. First, although it is found that the result of the paper-and-pencil method already has high proximity to the pseudo-answers (0.80), however, the assistance of computer can greatly improve the result to be higher than 0.91 by preventing the occurrence of missing values and providing real-time revising mechanism for participants to update their scores on demand.
Second, among the computer-assisted methods, the comparative focus-on-adjective method are better than the monadic focus-on-stimulus method with the perspectives on usage experience, test-retest reliability, and the likelihood to collect participants’ true opinions. Third, the proposed real-time revising mechanism not only lessens the threat caused by the rating order, but also improves the reliability and data quality. In general, for measuring multi-stimulus and multi-dimension perceptions, the comparative rating scale with real-time revising mechanism is proven to be a sophisticated solution. Together with the appropriate mechanism, the data
collected with the efficient method can be cross-compared and integrated to form a much more comprehensive theory.
Keywords: Kansei Engineering, Data Collection method, Semantic Differential, XML
一、 前言
在九十二年度,本研究以具有跨平台整合能力的 XML 技術為基礎,參考日本
學者長町三生所提之感性工學系統架構為藍圖[長町三生, 1995],結合互動設計、
網路技術、以及電腦運算等相關的資訊處理技術,建構出一個以整合為導向之意象 調查與分析系統(其架構如圖一所示)。
電腦化的感性工學網路調查實驗
意象語彙 資料庫
設計元素 資料庫
資料整理 統計分析
感性意象調查 感性調查
統計分析
以 XML 為基礎 的感性資料庫
使用者介面
圖一 電腦輔助感性工學資訊系統架構圖
為了進一步提升本資訊系統在收集使用者資料時的執行效率與績效,以及意象
資料庫的整合與應用,本研究進一步針對電腦輔助意象調查方法與相關研究的
彙整機制,進行深入的探討。
二、 研究方法
在調查工具方面,本研究首先針對感性相關研究常用之意象調查方法進行通盤 的瞭解,並整合電腦所擅長之隨機運算機制與互動性,開發出兩種模式的互動 式調查方法;
1. 以刺激物為主的調查方法(Focus-on-Stimulus method):
在這個互動式意象調查工具中,保留了傳統以紙筆工具進行意象調查時(如
圖三之 A 所示)的精神,讓受測者可以針對每一個刺激物,將其予人的第
一印象進行綜合評比(如圖三之 B 所示);並且,在完成所有刺激物的評
比後,受測者可以即時檢討各意象之排列情況,並進行調整與修正。
2. 以感性意象為主的調查方法 (Focus-on-Adjective method):
相較於上述以刺激物為主的調查方式,在這個方法中則直接詢問受測者針對
指定的感性詞對,評比所有刺激物在此向度上的意象與程度(如圖三之 C
所示)。基本上,這個方法著眼於模擬吾人日常的購物經驗,以增進資料收 集的效度。在評比的過程中,受測者隨時可以調整先前的調查資料。
在此兩個調查方法中,都充分運用電腦的即時運算與互動技術,提供受測者確 認與修改其評比狀況的機制(如圖三 B&C 之下方圖例所示)。在資料收集方 面,系統會將受測者所有的調整過程紀錄下來,供研究者對於受測者在評估這 些刺激物之意象的變化情形,進行更深入的討論。
圖三 紙筆調查方法與本研究所開發之兩種電腦輔助調查方法的操作方式示意。
經過實際將上述方法應用於汽車與椅子造型等意象調查後,本研究進一步歸納 出其各自的特性與優缺點,綜合整理成表一所示:
表一 感性研究常用之調查方法的分析與比較
方法 以刺激物為主的調查方法
(focus-on-stimulus method)
以意象為主的調查方法 (focus-on-adjective method)
性質
受測者可以專注於每一個刺激物,針 對所要探討的感性意象,同時完成評 比。
這個方法提供一個競爭的情境,讓受 測者可以針對每一個意象尺度,評估 與比較刺激物的感性意象。
優點
• 刺激物導向。
• 透過這個方法可以針對設計給人的 第一印象,進行深入的探討。
• 以感性意象為導向。
• 模擬日常的購物經驗,使能增進資料 收集的效度。
受測者的 心智模式
意象表達 (Impression Expression)
意象表達與比較
(Impression Expression & Comparison)
缺點
個別刺激物評比的過程中,缺乏刺激 物之間的比較機制。同時,受測者也 無法修改先前已完成評比的調查資 料。
受測者對於刺激物的第一印象,可能受 到同時存在的比較機制所影響。
改進之道
提供一個選項,讓受測者視其需要,
隨時檢討已完成的調查結果,並做必 要的調整與修正。
提供研究者選擇要不要在受測者評比個 別刺激物時,將前面已完成的結果顯示 出來。如此,也許可以將其對於刺激物 之地一印象的影響減少到一定的程度。
為了進一步瞭解這兩種方法實際用於資料收集時的績效表現,以及受測者的操 作評價,本研究以現階段大多數研究者所使用的紙筆調查方法做為對照組,以
茶壺為例子進行受測者間設計的實驗。總計共邀請 24 位受測者,依隨機指派的
順序,分三週完成各調查方法的評比,每週進行一次以減少受測者的記憶效應。
最後,待受測者完成個別方法評比後的第四週,本研究另設計了一個排序的實 驗,請每位受測者針對各意象尺度,將所有刺激物的感覺強弱程度排列出來。
為確認該排序情形的可靠性,另請求受測者在實驗的隔天回來校正其排序結果 兩次,一天一次。本研究將最終的校正結果視為各受測者對於所調查之茶壺產 品的既定想法(pseudo-answers),以比較各調查方法在資料收集上的正確程度。
三、 研究結果
1. 電腦輔助意象調查方法的實證探討與比較
相較於現階段大部分研究者所使用的紙筆調查方法,電腦輔助意象調查方法
在資料收集的效率、受測者的主觀反應、以及統計分析結果的比較等三個方
面都有顯著的進步(如表二所示)。其中,以意象為主的調查方法明顯優於 以刺激物為主的調查方法,受測者普遍認為同時針對所有刺激物進行意象評 比的方式,相當接近日常的購物經驗,因而能夠反映出內心的真實感受。而 從受測者使用即時調整機制,修正評比資料的紀錄分析中,本研究發現只需 在調查過程中請受測者多不到半分鐘的時間,校正其評比的結果,就可以將 有效提升調查資料的信度與正確性。
表二 不同調查方法之受測者操作反應與績效表現情形 調查方法 a
變數
P&P FOS FOA
受測者的主觀反應
容易使用 b µ 77.46c,d 71.08c 81.29d
∆ 18.25 18 9.3
疲癆感 b µ 34.29c 50.08d 37.54c
∆ 23.09 19 20.25
意見表達的完整性 b µ 61.83c 73.58d 83.33e
∆ 20.32 14 6.66
模擬日常消費經驗的完整程度 b µ 44.79c 66.71d 79.46e
∆ 20.55 16 8.29
整體滿意度 b µ 61.92c 64.33c 80.88d
∆ 19.3 19 7.38
重測信度 µ 0.755 0.764 0.788
∆ 0.25 0.08 0.11
主測與重測之差的絕對值 > 4 (%) 4.26 2.18 2.48
完成調查所需時間 (minute) 15.80 17.91 17.84
刺激物評比(rating)階段 15.83 12.74 13.92
校正調查結果(revising)階段 0 5.17 3.92
資料編碼與輸入(coding)階段 9.52 0 0
缺漏資料 23 (0.4%) 0 0
多向度(MDS)分析結果
三度空間的資料解釋程度 0.940 0.957 0.946
刺激物之落點與受測者之既定想法(pseudo-answers)的相似程度
原始調查資料的相關係數比對 0.65 0.71 0.75
多向度空間座標值的相關係數比對 0.80 0.91 0.94
aP&P= paper-and-pencil method, FOS= focus-on-stimulus method, FOA= focus-on-adjective method, bSignificant differences on at α=0.05.
c,d,e Means in the same row that share at least one superscript are not significantly different from one another (α=0.05).
2. 以網際網路為基礎的跨平台意象研究成果整合中心
另外,在研究成果的彙整部份,本研究充分發揮可擴充式語言(XML)資 料庫的優點,以共通意象為基礎,透過網際網路彙整各研究人員的意象研究 成果,而相關研究也能透過跨平台的比較與討論,整合成更紮實的知識與理 論。並且將所彙整的資料,以視覺化的方式提供研究者與設計師,進行意象
資料的瀏覽(如圖四所示) ,或者針對特定意象的設計搜尋(如圖五所示)。
圖四 意象研究成果彙整資訊的瀏覽狀況示意。
Designer
圖五 跨平台整合之感性資訊系統的搜尋應用示意。
80%可愛 程度的造形
意 象 研 究 成 果 整 合 中 心
Morphing Form
= 90%
+ 10%
Morphing Form = 75% VW Battle
+ 25% Benz C300
四、 結論與計畫成果自評
透過實際應用於汽車、椅子、茶壺等造型研究的評估與檢討,本系統在調查方法與彙 整機制的探討,大致上符合原先的規劃與預期。隨著產品設計的多樣化趨勢,在今(94)
年度延續的研究計畫中,將在本研究調查方法的研究基礎上,針對大樣本的意象調查研究,
探討可行的資料收集方法。以期能夠協助研究者擴大研究的範疇,同時擴充感性資料庫的 質與量,進而達到建立豐富之感性資料庫的研究目標。
參考文獻
[1] Bijmolt,T.H.A. & Wedel, M. (1995). The effect of alternative methods of collecting similarity data for Multidimensional Scaling. International Journal for Research in
Marketing, 12, 4, 363-371.[2] Dahan E. & Hauser J. R. (2002), The virtual customer. Journal of Product
Innovation Management, 19 (5), 332-353[3] Hsiao, K.A., Chen, L.L., Wang, C.F., & Tsang, H.T., (2003). Fundamental Dimensions of Affective Responses to Product Shapes. The 6
th Asian Design Conference, Japan: Tsukuba.[4] Hsu, S.H., Chuang, M.C., & Chang, C.C., (2000). A semantic differential study of designers' and users' product form perception. International Journal of Industrial
Ergonomics, 25, 375-391.[5] Nagamachi, M. (1999). Kansei Engineering: the Implication and Applications to Product Development. IEEE SMC '99 Conference Proceedings, 6, 273 -278
[6] McBurney, D. H., (2001). Research Methods (fifth edition). Belmont, CA:
Wadsworth. 270-277.
[7] Osgood, C.E., Suci, G.J. & Tannenbaum, P.H., (1957). The Measirement of
Meaning. Urbana: University of Illinois Press.[8] Petiot, J.F. & Yannou. B., (2004). Measuring consumer perceptions for a better comprehension, specification and assessment of product semantics. International
Journal of Industrial Ergonomics, 33, 507-525.[9] Smith, S.M. & Albaum, G.S.,(2005). Fundamentals of Marketing Research, California: Sage Publications, 371-412.Tidwell D. (2002), Introduction to XML, USA: IBM. Retrieved December 20, 2002, from the World Wide Web:
http://ibm.com/developerWorks
[10] 大澤光編(2000), 印象の工学とはなにか ,東京:丸善プラネット株式会社 [11] 長町三生 (1995) , 感性工 学 のおはなし ,東京:日本規格協会
[12] 蕭世文(2000),造形與色彩對產品意象的影響研究及諮詢程式系統設計,
第八
屆國科會工業工程與管理學門專題研究計畫成果研討會
行政院國家科學委員會補助國內專家學者出席國際學術會議報告
93 年 12 月 15 日 報告人姓名
陳玲鈴 服務機構
及職稱
國立台灣科技大學 工商業設計系 教授
時間 會議 地點
2004 年 11 月 17 日至 21 日 澳洲墨爾本市(Melbourne)
本會核定
補助文號
NSC93-2411-H011-009會議
名稱
(中文) Futureground: 2004 設計研究學會國際研討會
(英文) Futureground: 2004 Design Research Society International Conference 發表
論文 題目
(中文) 以形變作為探討感性產品造形的工具
(英文) Morphing as a Tool for Exploring Affective Product Shapes
報告內容應包括下列各項:
一、參加會議經過
Futureground 為國際間較具代表性之設計學術組織 Design Research Society 於 2004 年 所舉辦的國際學術研討會.今年由澳洲 Monash University 主辦,在澳洲墨爾本市
(Melbourne)舉行,會期共五天,邀請的 Keynote Speakers 包括美國 Carnegie Mellon 大學 Richard Buchanan 教授以及 Royal Melbourne Institute of Technology 的 Mark Burry
教授等人.研討會集合了各國設計相關領域之專家學者﹐共有 200 篇論文,來自 32
國,100 所大學約 300 位學者參與,涵蓋設計文化,設計教育,環境/永續性,互動
/人因,設計哲理/理論,設計實務/管理,設計程序/方法等七個大領域之相關議 題.國內有多位學者參與此次的研討會﹐包括台科大林銘煌老師與王韋堯老師,交大 莊明振老師,雲科大游萬來老師和宋同正老師,成大的陸定邦老師﹐北科大黃啟梧老 師等多位學者參加‧
此次參加會議,本人並受台灣之設計學會委託,代表設計學會參與中(CID),日 (JSSD),韓(KSDS)與歐洲 DRS 等四個設計學會聯合組成 IASDR(International
Association of Societies of Design Research)的籌備會議.會議決議由台灣舉辦 2005 年 第一次 International Design Congress 並於舉辦時正式成立 IASDR,台灣則為四個創會 會員之一.
二、與會心得
國際間陸續成立許多進階設計學程,整個設計領域在各個方向都有學者積極從事研 究,並在研討會中發表他們的研究成果.除了感性設計的相關議題之外,文化議題與 永續議題,也慢慢為大家所重視.由此次研討會的發表論文中,對兩篇論文/發表有 特別深刻的感想:
附件三
第一篇是 Royal Melbourne Institute of Technology 的 Mark Burry 教授在研討會最後一天 的 Keynote Speech.Mark Burry 教授在過去幾年來,致力於完成著名建築家 Anthony Gaudi 於 1884 年開始設計並建造的 Sagrada Familia 教堂的建築工作.為了能重現 Anthony Gaudi 的構想,Mark Burry 教授必須試圖從僅存的少數草圖中,重建 Gaudi 所夢想的複雜幾何設計.整個研究涵蓋了歷史與文化背景的探討,以及運用電腦以計 算並模擬平面草圖的構想的高科技與幾何數學的應用.這個研究案充分展示了藝術設 計與科技的整合,特別是設法完成天才設計師 Gaudi 未竟夢想的雄心,令人感動.Mark Burry 教授於 1979 年開始參與該項計畫,預計 2007 年將完成教堂的內部,而外觀的
整體完成,必須要到 2020 年才能達成,是一個長達四十年的長期研究計畫.
第二篇是韓國 KAIST(Korea Advanced Institute of Science and Technology)的 Kun-Pyo Lee 教授所發表的研究。韓國產業近年來在設計方面的表現十分突出,而韓國的兩所 重要大學 Seoul National University 與 KAIST 均設有設計相關科系,吸收一流的學生
進入設計領域. (這一點與台灣有極大的差異,台灣目前在台清交成中,僅有成大招
收工業設計大學部學生)近年來,在研究的表現上,這兩所學校也有相當優異的表現.
李教授此次的發表是討論跨文化設計,實際執行上,則與日本,北京清華等校合作,
探討亞洲國家間之文化差異與對設計之影響.台灣並未參與此次項研究,未來台灣應 更積極與亞洲和國際學校合作,在學術研究與實務應用上,期能有更有優秀的表現.
另外,李教授也非常積極於發展新的設計研究工具,例如以微形攝影機與眼鏡結合,
以便能紀錄並分析使用者在使用手機時,操作上所遭遇的實際問題.在新科技上的應 用,台灣應有足夠的相關知識與技術,學界應當更積極跨出設計領域與電資,工程合 作,開發新的工具,以期能發覺消費者之需求,提出創新產品概念.
三、考察參觀活動(無是項活動者省略)
無
四、建議
設計領域之相關研究正蓬勃發展,而設計對於產業發展之重要性亦漸為各國政府所了 解.經由參加國際研討會﹐一方面可以使國外專家學者了解國內相關研究的成果﹐一 方面也可由各國專家學者的發表論文中了解研究的趨勢並發掘將來可能的研究方 向。對於國際和亞洲之重要學術組織與會議,台灣必須積極參與,以期在國際設計相 關領域佔有一席之地.
五、攜回資料名稱及內容
研討會論文集﹐共 2 冊﹐分別是:
Futureground: Design Research Society International Conference 2004,
Volume 1: Abstracts 及 Volume 2: Proceedings, edited by David Durling and Arthur de
Bono.
Morphing as a Tool for Exploring Affective Product Shapes
Lin-Lin Chen, Chun-Chi Yeh, Brandon Wong Graduate School of Design
National Taiwan University of Science and Technology, Taiwan [email protected]
Kun-An Hsiao
Department of Industrial Design Chang Gung University, Taiwan
Introduction
Fierce competition in an increasingly fragmented market forces new products to be developed in rapid cycles for very specific groups of target customers. Automobiles, which used to spend five to seven years in development, are now developed in three to five years. For the highly competitive consumer electronics market, the situation is much worse: a mobile phone is often given merely three months for design and development.
In many product categories, the market is flooded with numerous products that are
almost indistinguishable in terms of functionality, quality, and usability. To stand out
among such abundance of alternatives, a product must appeal to the emotional needs of
the customers. Affective responses evoked by beautifully design product shapes are
fundamental in addressing these emotional needs. Figure 1 shows kettles, armchairs,
and autos that evoke different affective responses via their shapes.
Figure 1
Under intensive market pressure, designers face the challenge of developing products that convey specific affective meanings within extremely compressed development time.
Existing computer-aided tools that only assist designers in drawing and modeling offer little help in this aspect. New tools at the concept design stage are needed for designers to rapidly explore a large number of product shapes and investigating their affective appeals.
The basic idea of morphing is to obtain a series of shapes that interpolate between two given shapes. Given two product shapes, we can obtain a series of gradually changing shapes from one product to the other, for example, by using an image morphing program, such as Elastic Reality from Avid. Figure 2 illustrates several series of shapes that we obtained by morphing coffee makers, and by morphing a New Beetle to a BMW.
Figure 2
When examining the process of metamorphosis, we observe that changes, appearances and disappearances in shape features lead to transformations in the affective responses.
The photo-realistic images produced by the morphing program help to create realistic virtual prototypes that could be used as stimuli to elicit reactions from target consumers, providing a way to investigate the relationship between shapes and their affective meanings. By combining image morphing techniques and perceptual mapping techniques from marketing and psychology research, we propose a set of visualization tools for exploring affective product shapes by combining existing products that are successful in communicating certain affective meaning [Chen and Liang 2001, Chen et al.
2003].
The idea of combining existing products to generate new product shapes is not new.
Previous work along the direction of applying morphing techniques to product design
includes the pioneering work of Chen and Parent on shape averaging [Chen and Parent 1989], where wire-frame computer models are “averaged” to create new shapes.
However, Chen and Parent did not relate shapes to the affective responses evoked by them. Hsiao applied morphing in three dimensions [Hsiao and Liu 2002] in which new shapes are automatically generated based on specifications of desired affective responses. This three-dimensional approach is nevertheless limited in its scope of shapes, because, in order to facilitate three-dimensional shape morphing, product shapes must be parameterized with identical number of vertices, edges, and surfaces, an extremely restrictive constraint.
In this paper, we aim to further examine the feasibility of applying morphing techniques to product design. In particular, we seek answers the following two questions:
1. What is the relationship between interpolated shapes and the affective responses evoked by these shapes? As a product shape gradually changes from one extreme shape to the other, does the affective response change in predictive manner?
2. What is the best way for obtaining the interpolated shapes? Are the results from two-dimensional (2D) image morphing as good as the results from three-dimensional (3D) shape morphing?
To answer Question 2, we shall examine three different approaches to morphing: 2D morphing based on product photos, 3D morphing using computer models and hybrid 2D morphing using computer-generated images from 3D models. Using the best morphing results, we will seek to answer Question 1 by conducting surveys to investigate the relationship between affective responses and the interpolated shapes.
Identifying Extreme Product Shapes
We selected armchair as the target product for our investigation, because of its wide range of shapes and the availability of a large number of high-quality photos. To investigate the applicability of morphing methods, we would like to choose a few armchairs that exhibit strong affective characteristics, and generate sequences of morphed shapes from these extreme shapes. We make use of perceptual mapping techniques [Kruskal 1978; Schiffman 1981; Young 1987] from marketing and psychology for determining the affective responses evoked by product shapes, and for identifying the product shapes that elicits strong affective responses.
We started by collecting a total number of 72 images of armchairs from books and on the
internet. All images were then scaled and converted to gray-scale images with
backgrounds removed, in order to eliminate possible influences from colors and
backgrounds. We next surveyed twenty subjects with design background to collect 510
adjectives that were used by the subjects in describing the affective responses invoked
by armchairs. The 510 adjectives were first reduced to 100 adjectives, after eliminating similar or unsuitable adjectives.
We conducted a survey of 20 subjects to perform card sorting on the 72 armchair images and the 100 adjectives. The frequency data from the survey were analyzed using cluster analysis methods to yield 12 clusters of similar armchair images and 14 clusters of similar adjectives. We selected a final collection of 20 armchairs from the 12 groups based on ranking data obtained during the survey. We also identified 28 adjectives from the 14 clusters for describing the affective responses to the armchair shapes. By consulting related studies and references, we composed 28 bipolar adjectives. We then conducted a semantic differential survey with the 28 bipolar adjectives and the 20 representative armchairs. A factor analysis of the survey data resulted in three main factors:
traditional-modern, rational-emotional, and simple-complex. By using factor scores on
these three main factors as coordinates for the 28 bipolar adjective and performing a clustering analysis on the bipolar adjectives, we identified 7 additional pairs of adjectives to fully cover the range of affective responses elicited by armchair shapes. These additional bipolar adjectives are: truthful-exaggerated, dazzling-ordinary, cute-not cute,
soft-hard, streamlined-rugged, gorgeous-plain, and varied-monotonic.To obtain the perceptual map, we conducted a third survey with 30 subjects, in which the subjects are asked to rate each of the 20 armchairs according to the degree each adjective describes the product shape. We then used a multidimensional scaling program (MDPREF) [Schiffman 1981] to construct the perceptual map from the data obtained in the survey, and to determine the location of the vector corresponding to each pair of bipolar adjectives in the perceptual map.
The result is a perceptual map for armchairs, as shown in Figure 3.
Figure 3.
In this map, each armchair is represented by a point, and each pair of adjectives by a
vector. The distance between any two points reflects the perceived similarity between the
corresponding armchairs. That is, if the shapes of two armchairs are perceived to be similar, the points representing them are placed close together. On the other hand, if they are perceived to be dissimilar, the corresponding points are placed farther away from each other. It is clear that five armchairs lie farthest away from the origin. Each of the five armchair exhibits very strong and distinct character. We will use these five armchairs as the source images in our subsequent studies on morphing techniques.
Three Approaches to Morphing Product Shapes
The basic idea of morphing [Wolberg 1990] is to obtain a series of gradually changing shapes that interpolate between two given graphical objects. Depending on the type of objects to be interpolated, morphing techniques can be classified into curve morphing, image morphing, surface morphing, and volume morphing [Gomes et. al 1999]. Of the four, curve morphing is limited to the interpolation of outlines, and volume morphing often suffers from not being able to specify and maintain characteristic lines, which are very important in product design. The other two approaches are more suitable for our purpose.
To generate photorealistic images of interpolated shapes, one possible way is to apply image morphing techniques to 2D product photos. Another possible way is to apply surface morphing techniques to realistically rendered 3D computer models of the products. Yet another way is the hybrid approach of applying image morphing techniques to 2D computer-rendered images from 3D computer models of the products. In the following, we will refer to these three approaches as the 2D morphing approach, the 3D
morphing approach, and the hybrid morphing approach, respectively.For the 2D morphing approach, we started with product photos that had been converted to grayscale and with backgrounds removed. We then used Elastic Reality program from Avid for generating the series of shapes that interpolates between two given images. To obtain good results, it is important that accurate correspondences between shape features of the two products are established before the morphing.
For the 3D morphing approach, we used Maya software package from Alias/Wavefront
for creating and morphing the computer models. The 3D models were built as NURBS
surfaces in Maya. Maya requires these models to have the same structure, i.e., the same
basic parts, the same number of NURBS surfaces and control points. This rigid
requirement places great restrictions on the model building process and makes model
building very difficult. After much trials and errors, we arrived at a basic structure of the
back, the seat, and the two arms, with a total number of 24 surfaces and 1142 control
points. The resulting computer models are rendered using Mental Ray global illumination
software package to generate near-photorealistic computer images. Comparisons of the
grayscale product photos and the computer rendered images are given in Figure 4. With
the availability of 3D computer models, we use the Blend Shape function provided by
Maya for generating the 3D morphing sequences.
A B C D E
Photo
Computer Model
Figure 4
For the hybrid approach, we still needed to build 3D armchair models before computing the 2D morphing sequences. However, because correspondences in 2D morphing are established through interactive specification of corresponding features on images, rather than through the common structure of models, there is much more flexibility on the structures of the 3D models. This allowed the 3D models to be built in much shorter times (than those for pure 3D morphing). In our case, the 3D models were built in Alias software package and morphing was done using Elastic Reality. Figure 5 displays a few series of shapes that we obtained by applying the three different morphing techniques to pairs of extreme armchair shapes. The top, middle, bottom rows show 3D morphing, hybrid morphing, and 2D morphing results, respectively.
A2D A2E
B2D B2E
Figure 5.
We observed that the 3D approach produces good morphing results. However, because the models were built based on the basic structure of a seat, a back and two arms, the interpolated shapes tend to be fragmented and appear to be less integral. This effect is clear in the slightly disruptive transition from right arm to back to left arm in the top rows of the sequences A2E and B2E. The 2D approach encounters problems when some features are only partially visible, e.g., the hole in armchair B creates problems in the bottom rows of the sequences B2D and B2E. The 2D approach also can generate ambiguous shapes when the two given photos differ greatly in camera view angles, e.g., in B2D. In this case, the morphing sequence interpolates not only the product shapes but also the view angles, resulting in a simultaneously morphing and rotating sensation. The hybrid approach appears to produce the best results of the three approaches, taking advantage of the 3D models that allows both armchairs to be oriented to the same camera view, and the 2D morphing approach that allows correspondences between shapes to be specified across individual components. The resulting shapes, as shown in the middle rows of Figure 5, are sequences of shapes that are both realistic and coherent.
Affective Responses Elicited by Interpolated Shapes
To investigate the relationship between the shapes and the affective responses, we made use of the unambiguous models generated by the 3D morphing approach. Ten morphing sequences between every pair of the five extreme armchair shapes were generated.
Each sequence consists of five shapes, two original armchair shapes (corresponding to α= 0.0 and 1.0), and three interpolated shapes (corresponding to α= 0.25, 0.50, and 0.75).
We then proceed to determine the trajectories or distributions of the sequences of
morphed shapes in the perceptual map for armchairs, by conducting a survey with 30
subjects. We again used MDPREF to compute the perceptual map showing the
trajectories of the 10 sequences of morphed shapes. The resulting perceptual map is
illustrated in Figure 6.
Figure 6
We observed that the trajectories of the sequences of morphed shapes generally follow a
“V” curve. That is, when morphing between shapes exhibiting an “emotional” image and a
“rational” image, the in-between shapes progress in predictive manner from “emotional”
to “rational” but the interpolated often appear to be more “complicated” or “traditional”.
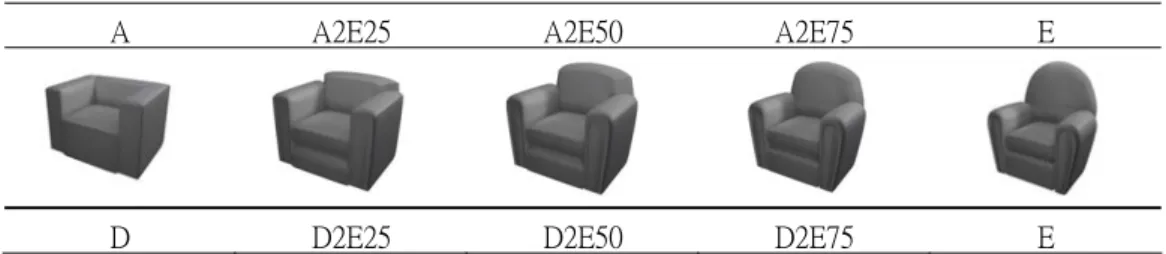
Figure 7 shows the six sequences of shapes that interpolated between product shapes with “emotional” and “rational” images. The affective responses in terms of “traditional-modern” toward these sequences of shapes are plotted in Figure 8; whereas the responses in terms of the “emotional-rational” are plotted in Figure 9. As clearly indicated by the V-shape curves in Figure 8, the interpolated shapes appears to be more complicated, thus projecting more traditional images. On the other hand, the curves in Figure 9 exhibit strong linearity, indicating that the interpolated shapes changes from “emotional” to
“rational”, or vice versa, in fairly predictive way.
A A2E25 A2E50 A2E75 E
D D2E25 D2E50 D2E75 E
A A2B25 A2B50 A2B75 B
A A2C25 A2C50 A2C75 C
B B2D25 B2D50 B2D75 D
C C2D25 C2D50 C2D75 D
Figure 7
Figure 8 (High values in the vertical axis indicate a more modern image. Low values indicate a more traditional image.)
-0.4000 -0.3000 -0.2000 -0.1000 0.0000 0.1000 0.2000 0.3000 0.4000
0% 25% 50% 75% 100%
A2B
A2C
A2E
B2D
C2D
D2E
-0.4000 -0.3000 -0.2000 -0.1000 0.0000 0.1000 0.2000 0.3000
0% 25% 50% 75% 100%
A2B
A2C
A2E
B2D
C2D
D2E
Figure 9 (High values in the vertical axis indicate a more emotional image. Low values indicate a more rational image.)
Discussions
Our investigation found that, as a product shape gradually morphs from one extreme shape to the other, the affective response toward the shape does appear to change in a fairly predictive manner. The interpolated shapes tends to linearly interpolate the
“emotional” and “rational” responses, but the interpolation scheme introduces certain degree of inconsistency to the interpolated shapes, leading to more “complicated” or
“traditional” images. The implication is that morphing techniques could potentially become a viable tool for exploring a large number of product designs, but not as a tool for automatically generating new product design. A feasible scenario is for designers to mix and combine existing products with desirable affective characteristics. The designers can then experiment and fine-tune the different mixtures to arrive at product shapes that evoke specific levels of affective responses. As the resulting shapes will usually be more complicated than desired, the designers will need to make simplification to the interpolated models to move the affective images to be more modernized. Figure 10 illustrates a comparison between an image generated by morphing two automobile and the PT Cruiser. The interpolated shape exhibits proportions similar to those of PT Cruiser.
However, the PT Cruiser is clearly more streamlined and simplified.
Our investigation also shows that the best way for obtaining the interpolated shapes is probably the hybrid method, in which designers build 3D models of the products, obtain realistic computer renderings of the products with identical view point and rendering conditions, and then apply 2D morphing programs on the computer rendered images to obtain the interpolated shapes.
Figure 10
Acknowledgement
This research is the result of a grant (NSC-92-2213-E-011-007) from Taiwan’s National Science Council. The authors are grateful to their support of this work.
References