國立臺灣大學生命科學院生態學與演化生物學研究所 碩士論文
Institute of Ecology and Evolutionary Biology College of Life Science
National Taiwan University Master Thesis
暖化操控對不同海拔的本土種紋白蝶、
外來種紋白蝶及其蜜源植物的影響
Experimental warming impact on a native butterfly (Pieris canidia), an invasive butterfly (P. rapae), and their nectar plant (Bidens pilosa var. radiata)
across altitude?
余淑惠 Shu-Hui Yu
指導教授: 何傳愷 博士 Advisor: Chuan-Kai Ho, Ph.D.
中華民國 105年 3 月 March 2016
謝誌
歷經了幾年的成果,雖然過程辛苦,但卻也學習到很多,是一段相當值得的 經驗。而這些成就首先要感謝我的指導教授何傳愷老師那句”殺不死你的會使你 更強大”支撐我一路到現在,真的很謝謝何老師不斷的給我機會與幫助,讓我從 起跑點後半段一路往前衝而有了現在的成就。謝謝昆蟲系楊恩誠老師、農化系賴 喜美老師大力支持幫助我的研究,謝謝高文媛老師、楊恩誠老師、林仲平老師擔 任我的口試委員,給予我相當多建議讓我更加成長。
在實驗的過程中謝謝生演所雅倫學姊、昆蟲系繹栴、農化系宥萱協助我調查 分析資料。同時也謝謝 Lab1214 同伴們:靖倫、穎婕、忠慧、小松、正鴻、子榮、
怡安、騏銘、韶寬、彝禎,有你們鼓勵我幫助我陪伴我。謝謝工讀生小瑋在我忙 碌中幫我分擔工作以及奇芊學長幫我抓蝴蝶。當然,也感謝科技部的經費支持以 及大氣資料庫的資訊提供。
另外,也謝謝我的朋友們多年的陪伴,在我無助的時候陪我吃飯、散心、吐 苦水,讓我知道自己不孤單。最重要的是謝謝我的家人,家裡雖然不算富裕,但 感謝我的父母無私的讓我在就學期間無憂無慮的學習,每次回家也會努力的把我 餵胖。在我離家多年的時間中,也感謝我的哥哥和妹妹連我的份一起照顧父母和 這個家,讓我很放心的在外地生活。感謝他們陪我到處在大太陽底下抓蝴蝶,也 謝謝他們默默的支持我,讓我去追尋自己的夢想,並且一路上幫我解決所有困 難。
接下來要踏入新的旅程,有許多想感謝的人都記在我的心中,也會讓你們看 見我的成長與收穫,未來的路還很長,還會學習到更多經驗、遇見更多美麗的事,
希望能讓自己更加茁壯。
摘要
授粉者可提供重要的生態系統服務。鑑於暖化可能改變授粉者及/或植物的 生長與發育,進而影響不同環境梯度下的授粉者與植物之關係,本研究想探討 1)暖化會如何影響授粉者與蜜源植物的生長與發育,2)暖化是否會影響授粉者與 蜜源植物的授粉關係,3)暖化對授粉者和蜜源植物的影響是否會隨著海拔或本土 種和外來種授粉者而變化,4)野外的授粉關係如何隨季節和海拔變化。本研究的 物種包含大花咸豐草及兩種紋白蝶。大花咸豐草(Bidens pilosa var. radiata )是台 灣近年來重要的外來入侵物種,已成為許多授粉者重要的蜜源植物,其中常見的 授粉者包含了本土種的台灣紋白蝶(Pieris canidia)與外來種的紋白蝶(P. rapae)。
為探討暖化對不同海拔的兩種紋白蝶與大花咸豐草的影響,本研究包含了實驗室 暖化操控實驗以及野外調查。實驗室暖化操控實驗收集來自中海拔(~1000 m a.s.l.) 和低海拔(~100 m a.s.l.)各三個地點的大花咸豐草種子和兩種紋白蝶雌蝶(使用 F1 做實驗),分別利用三個生長箱調控溫度來記錄暖化對其生長與發育的影響(控制 組、3℃暖化與 6℃暖化)。根據野外平均溫度資料,設置控制組溫度為 16.8℃(中 海拔)或 22.8℃(低海拔)。野外調查則檢測紋白蝶的密度及大花咸豐草花朵的形 質,是否會隨海拔及月分而改變。
研究結果顯示,暖化可對授粉者、植物、及兩者之交互關係造成影響,且此 影響會隨海拔改變。首先,暖化可影響兩種授粉者(紋白蝶)的表現,然其結果受 物種及海拔的影響 - 暖化會減少低海拔外來種紋白蝶的壽命與前翅長度,而暖 化會對中海拔之本土種紋白蝶造成類似的影響。其次,暖化對蜜源植物(大花咸 豐草)的影響亦隨海拔改變 – 暖化使中海拔大花咸豐草的開花時間提前、增加 其開花數量,但減少其花朵的反射率。最後,暖化亦會影響授粉行為,然其結果 受物種及海拔的影響 - 暖化增加了低海拔外來種紋白蝶的訪花頻率與覓食時間。
野外調查顯示,紋白蝶的密度及大花咸豐草花朵的形質會隨海拔與月份改變。低 海拔有較高的授粉者密度,而低海拔大花咸豐草(花蜜總糖量及反射率)和中海拔
大花咸豐草(花蜜蔗糖量)在吸引力形質的表現上則各有優勢,而這些形質會隨月 份而變化。以上的研究結果顯示,暖化可對這兩種紋白蝶(本土種 vs.外來種)造 成不同的影響,而此影響及暖化對大花咸豐草的影響,皆會隨海拔改變。鑒於暖 化對各授粉者物種(兩種紋白蝶)及海拔族群(中低海拔紋白蝶或大花咸豐草)的 影響程度不同,暖化不但可能會改變現有本土種與外來種的生態系統服務,也可 能會改變各海拔的授粉者與蜜源植物之間的交互關係,進而影響當地的動植物群 聚。
關鍵字: 暖化、海拔、授粉、外來種、台灣紋白蝶、 紋白蝶、大花咸豐草
Abstract
Pollination is an important ecosystem service. Given that climate warming has reportedly affected the growth and development of pollinators and/ or plants, likely shifting current plant-pollinator interactions (e.g. mismatches) across spatial gradients (e.g. altitude or latitude), this study examines 1) how warming may affect the growth and development of pollinators and nectar plants (flowers), 2) whether warming will affect the interactions between pollinators and nectar plants, 3) whether the effects above, if any, will vary across altitude (spatially) and between native and invasive pollinators, and 4) how plant-pollinator interactions vary temporally across altitude in the field. This study examined a nectar plant and its two pollinators. Bidens pilosa var.
radiata, a notorious invasive plant in Taiwan, has become an important nectar
resource for many pollinators, including two common butterflies, the native Pieris canidia and invasive P. rapae. To understand warming impact on these butterflies and
their nectar plants across altitude, this study included a laboratory experiment and field survey. The laboratory experiment collected the seeds of B. pilosa var. radiata and females of the two Pieris species (F1 for study) from three sites each at medium (~1000 m a.s.l.) and low altitude (~100 m a.s.l.). Species from medium or low altitude were each raised in three growth chambers (control temperature, 3oC, and 6 oC warming); the control temperature for medium and low altitude was set at 16.8 oC and
22.8 oC, respectively, based on field data. The field survey examined the population density of both Pieris and the flower traits of B. pilosa across altitude over months.
The results showed that warming impact on pollinators, plants, and their interactions varied with altitude. First, warming affected the native and invasive Pieris butterflies differently across altitude. In specific, warming reduced the adult
longevity and forewing length of low-altitude invasive P. rapae, but of medium-altitude native P. canidia. Second, warming affected nectar plants (B. pilosa) differently across altitude. For example, warming facilitated flowering (earlier flowering and more flowers) and reduced flower reflectance in medium-altitude plants, but had no such effects on low-altitude plants. Third, warming also affected pollination activity differently between the two pollinators across altitude. For instance, warming increased the frequency and duration of flower visits by low-altitude P. rapae. In addition, the field survey showed that both Pieris and flower traits varied spatially (altitude) and temporally (months). Low altitude had a higher Pieris density;
low-altitude B. pilosa plants (total sugar weight in flowers, flower reflection) and medium-altitude B. pilosa plants (sucrose concentration in flowers) might have a different strength in attracting pollinators. Many of these traits also varied with months.
In summary, warming may differently affect the ecosystem service (a function of pollinator longevity and flower visit) provided by the two Pieris pollinators across
altitude, and the different response of medium- and low-altitude plants to warming together suggests an upcoming shift in pollinator-plant interactions across altitude under climate warming, potentially shaping local plant-animal communities.
Keywords: climate warming, altitude, pollination, invasive species, Pieris canidia, P.
rapae, Bidens pilosa var. radiata
Content
謝誌... I 摘要... II Abstract ... IV Content ... VII Content of tables ... IX Content of figures ... X
Introduction ... 1
The importance of pollination in ecosystems ... 1
Warming could have a big impact on plants and pollinators ... 1
Plant-pollinator interactions may commonly vary with environmental gradients ... 3
Species invasions are common worldwide ... 6
Aims ... 8
Materials and Methods ... 10
Study system ... 10
Laboratory experimental design ... 11
Laboratory experimental procedure ... 12
Set-up ... 12
B. pilosa var. radiata morphology and growth ... 13
Flower reflectance ... 14
Pieris morphology and growth ... 15
Interaction between Pieris and B. pilosa var. radiata ... 16
Field experimental design ... 17
Field experimental procedure ... 18
Capitulum number ... 18
Flower reflectance ... 18
Sugar composition in nectar ... 19
Pollinator density ... 20
Statistical analysis ... 20
Laboratory experiment... 20
Field survey ... 21
Results ... 22
Warming effect on plant growth and development across altitude ... 22
Reproductive trait - flower ... 22
Reproductive trait- seed ... 22
Warming effect on pollinator growth and development across altitude ... 23
Pieris rapae ... 23
Pieris canidia ... 24
Native vs. invasive pollinators ... 25
Warming effect on plant-pollinator interactions across altitude ... 26
Warming impact on flower-visiting behavior of Pieris on B. pilosa var. radiata in the laboratory ... 26
Flower attractiveness (reflectance) of B. pilosa var. radiata in the laboratory ... 28
Spatial (altitude) and temporal variations in the field ... 28
Flower traits of B. pilosa var. radiata... 28
Pollinator density ... 31
Discussion... 33
Summary... 33
Warming impact on nectar plants, pollinators, and their interactions varies with altitude ... 33
Nectar plants ... 33
Pollinators... 35
Plant-pollinator mismatch ... 38
Native vs. invasive pollinators ... 39
Intraspecific genetic variation ... 40
Spatial and temporal variation in nectar plants and pollinators in the field .... 41
Plant and pollinator interactions vary spatially (altitude) ... 41
Plant and pollinator interactions vary temporally (month) ... 43
The strength and weakness of this study ... 43
Conclusions ... 45
References ... 46
Appendix ... 98
Appendix A: Plant vegetative growth traits ... 98
Appendix B: Pieris larval stage ... 101
Appendix C: Flower analysis ... 103
Appendix D: Weather information ... 104
Content of tables
Table 1. Study sites ... 63
Table 2. Warming impact on B. pilosa var. radiata flower traits across altitude ... 64
Table 3. Warming impact on B. pilosa var. radiata seed traits across altitude ... 65
Table 4. Warming impact on Pieris weight at each life stage across altitude ... 66
Table 5. Warming impact on the duration of each life stage in Pieris across altitude . 67 Table 6. Warming impact on Pieris forewing length across altitude ... 68
Table 7. Warming impact on the flower-visiting behavior of Pieris on B. pilosa var. radiata across altitude ... 69
Table 8. Warming impact on B. pilosa var. radiata flower reflectance across altitude70 Table 9. Field pattern in B. pilosa var. radiata flower reflectance across altitude and season (months) ... 71
Table 10. Field pattern in B. pilosa var. radiata flower sugar content across altitude and months ... 72
Table 11. Field pattern in pollinator density across altitude and months ... 73
Table 12. Plant (B. pilosa) and Pieris traits in common garden. ... 74
Content of figures
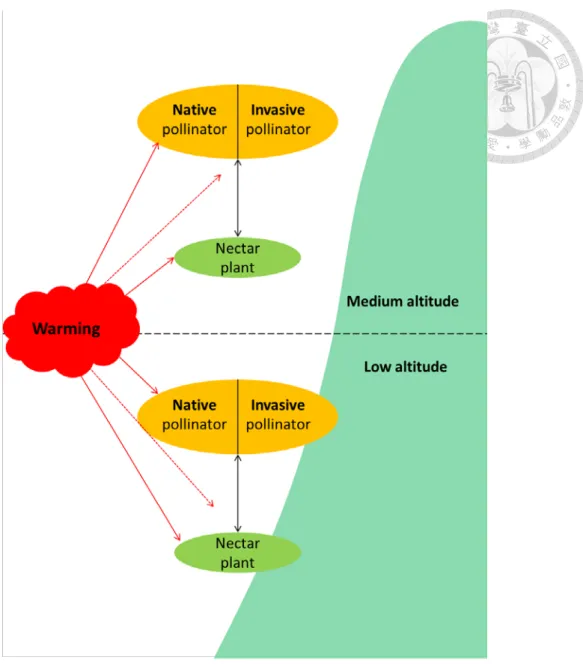
Fig. 1 Concept map ... 75
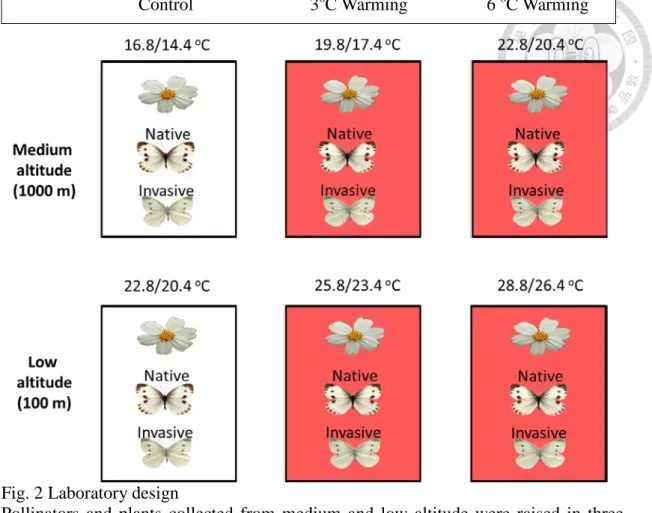
Fig. 2 Laboratory design ... 76
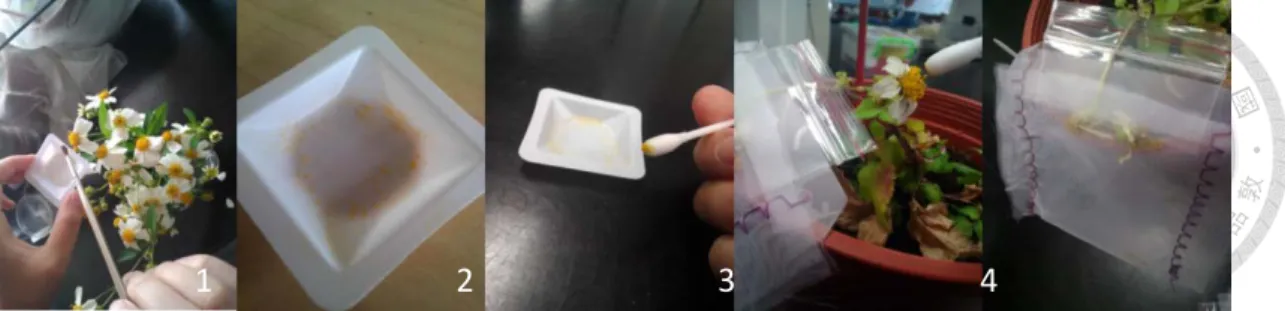
Fig. 3 The protocol of artificial pollination ... 77
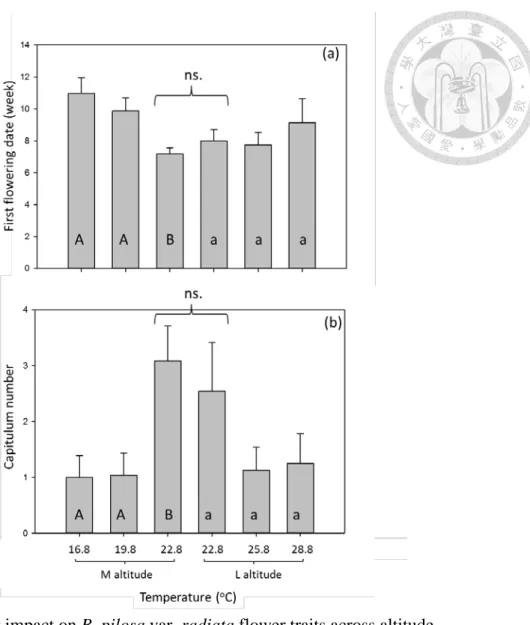
Fig. 4 Warming impact on B. pilosa var. radiata flower traits across altitude ... 78
Fig. 5 Warming impact on B. pilosa var. radiata seed trait across altitude ... 79
Fig. 6 Warming impact on Pieris weight at each life stage across altitude ... 80
Fig. 7 Warming impact on the duration of each life stage in Pieris across altitude .... 81
Fig. 8 Warming impact on Pieris forewing length across altitude ... 82
Fig. 9 Warming impact on flower-visiting rate of Pieris on B. pilosa across altitude . 83 Fig. 10 Warming impact on flower-visiting behavior of Pieris on B. pilosa across altitude... 84
Fig. 11 Warming impact on B. pilosa var. radiata flower reflectance across altitude . 85 Fig. 12 Field pattern in B. pilosa var. radiata capitulum number across altitude and season (months) ... 86
Fig. 13 Field pattern in B. pilosa var. radiata flower reflectance across altitude ... 87
Fig. 14 Field pattern in B. pilosa var. radiata flower reflectance across altitude and season (months) ... 88
Fig. 15 Field B. pilosa var. radiata flower reflectance across season (months) ... 89
Fig. 16 Field pattern in B. pilosa var. radiata flower weight across altitude and month ... 90
Fig. 17 Field pattern in B. pilosa var. radiata sugar content across altitude ... 91
Fig. 18 Field pattern in B. pilosa var. radiata sugar content across altitude and months in Taoyuan ... 92
Fig. 19 Field pattern in B. pilosa var. radiata sugar content across altitude and months in Nantou ... 93
Fig. 20 Field pattern in pollinator density across altitude and months ... 94
Fig. 21 Summary ... 95
Fig. 22 Mismatch occurred under warming ... 96
Fig. 23 Plants and pollinators varied with altitude and season (months)... 97
Introduction
The importance of pollination in ecosystems
A focal interest in modern ecology is to understand how environmental change will shape ecosystem services provided by species, communities or systems (Millennium Ecosystem Assessment 2005, Vanbergen and Insect Pollinators Initiative 2013). Pollination by animals, an example of critical ecosystem services, greatly benefits human beings and is regarded as one of the most important plant-animal mutualisms (Bronstein 1994, Kearns et al. 1998, Fontaine et al. 2005, Bascompte and Jordano 2007, Ollerton et al. 2011, Burkle et al. 2013, Revilla and Encinas-Viso 2015, Melathopoulos et al. 2015). For example, more than three quarters of angiosperms, or one third of major crops benefit from pollinators (Crepet 1984, Fontaine et al. 2005, Klein et al. 2007, Ollerton et al. 2011). Besides its important direct value (e.g.
facilitating food production), pollination by animals also offers important indirect value, such as maintaining natural ecosystems via its close relationships with other species (Kremen et al. 2007).
Warming could have a big impact on plants and pollinators
Environmental changes, such as climate warming, can interrupt plant-pollinator interactions by affecting plants, pollinators, and/or their interactions (Burkle and
Alarcón 2011, Hoover et al. 2012, Robbirt et al. 2014, Miller-Struttmann et al. 2015).
For example, climate warming may alter plant phenology and morphology, leading to earlier flowering and increasing flower number (Anderson et al. 2012, Hoover et al.
2012, Van Etten and Brunet 2013, Høye et al. 2013, Scaven and Rafferty 2013, Bock et al. 2014, Wheeler et al. 2015). In addition, warming may also affect nectar volume,
concentration, or plant seed production (consequently affecting plant dynamics) (Erickson and Markhart 2002, Hoover et al. 2012). As for pollinators, increasing temperature might influence the growth and development of pollinating insects, such as developmental acceleration, reduced body size, emergence advancement, etc.
(Arroyo et al. 1985, Hegland et al. 2009, Karl and Fischer 2009, Forster et al. 2012, Kharouba et al. 2014, Kühsel and Blüthgen 2015).
Regardless of warming, the interaction between plants and pollinators could be affected by each other. For example, higher sucrose in nectar would increase the flower visits by bumble bees (Whitney et al. 2008), suggesting that sugar composition might affect the pollination activity by pollinators. On the other hand, pollinator activity might affect the seed reproduction of plants: higher pollinator activity could increase pollen transfer and increase plant reproduction success (Kearn et al. 1998, Inouye 2008, Zhang et al. 2014). As for warming impact, plants and pollinators may respond differently to warming (Kharouba and Vellend 2015), resulting in a
phenology desynchronization and a temporal or spatial mismatch between plants and pollinators (Willmer 2012, Polce et al. 2014, Petanidou et al. 2014, Kudo 2014, Forrest 2015, Hindle et al 2015).
Knowledge gap 1: An integrated study is needed to understand how warming may
affect plant and pollinator traits together.
Although many studies have examined the response of plants and insects to warming separately (Bartomeus et al. 2011, Liu et al. 2012, Arroyo et al. 2013, Stuhldreher et al. 2014, Springate and Kover 2014, Bennett et al. 2015, Cochrane et al. 2015), there is a lack of studies that integrate most of important plant and
pollinator traits together in the same system and investigate the potential correlations or interactions of these traits. This kind of integrated studies is critical to understand the real impact of climate warming on plant-pollinator communities, since the growth and development of plants (flowers) and pollinators, as well as plant-pollinator interactions, should be affected simultaneously by warming in the real world. In addition, this kind of integrated study will allow us to examine how a mismatch between plants and pollinators (due to different responses to warming) may feedback to a plant-pollinator community (Fagan et al. 2014).
Plant-pollinator interactions may commonly vary with environmental gradients
To fully understand warming impact on plant-pollinator interactions in real world, it is necessary to study whether/how plant-pollinator interactions may vary temporally and/-or spatially (Malo and Baonza 2002, Olesen et al. 2008, Hoiss et al. 2015, Price et al. 2005, Cutler et al. 2015). While this important topic is less explored (Stenström
et al. 1997, Devoto et al. 2005, Crimmins et al. 2010), it has been well known that
other species interactions (e.g. plant-herbivore interactions) often vary with environmental gradients (e.g. altitude or latitude) (Pennings et al. 2009, Schemske et al. 2009, Ho and Pennings 2013, Shrestha et al. 2014, Rasmann et al. 2014),
suggesting that plant-pollinator interactions may likely change with environmental gradients as well. This point of view is supported by a limited number of studies addressing altitudinal or latitudinal variations in plants, pollinators, or their interactions (De Frenne et al. 2011, Vandewoestijne and Van-Dyck 2011, Benadi et al.
2014, Nagano et al. 2014, Pellissier et al. 2014, Kuriya et al. 2015). For example, many plant species have later flowering date toward higher altitude (Frei et al. 2014a and 2014b), and most butterfly species also have later first flight date and increasing wing length toward higher altitude (Illán et al. 2012, Leingärtner et al. 2014). In addition, Zhao and Wang (2015) found that both floral traits and pollinator visit rate could vary with altitude, such as shorter sepal length and fewer bee visits at higher altitude.
Understanding plant-pollinator interactions across environmental gradients (e.g.
altitude or latitude) will significantly improve our prediction in climate warming impact on plant-pollinator communities, especially when the same plant or pollinator species from different altitude or latitude may face different environmental challenges or respond inherently differently to the same degree of warming. For example, species or populations at higher altitude may face stronger environmental challenge under warming-induced range shifts because of the lack of suitable habitat at higher altitude (Roth et al. 2014, Costion et al. 2015). In addition, the same plant or pollinator species at different altitude or latitude may have adapted to local environment condition (temperature, photoperiod, resource, etc.) and/or evolved into various genotypes (Weber and Schmid 1998, Johansson et al. 2006, Zakharov and Hellmann 2008, Fischer and Karl 2010, Kingston et al. 2014). It is important to investigate whether these different populations or genotypes, if exist, may respond similarly or differently to climate warming, because these responses will reveal how plant-pollinator communities will shift under warming across altitude or latitude.
Knowledge gap 2: how will warming affect current plant-pollinator interactions
across environmental gradients (e.g. altitude)?
Species responses to warming might varied with altitude (Deutsch et al. 2008, Karl and Fischer 2009, De Frenne et al. 2011, Brunet and Larson-Rabin 2012,
Scheepens and Stöcklin 2013, Higgins et al. 2014, Yoshie 2014, Baldwin et al. 2014, Frel et al. 2014a and 2014b, Buckley et al. 2015, Bentz et al. 2016). While it is important to understand warming impact on plant-pollinator communities across environmental gradients, few studies have addressed this issue. It has been suggested that warming could decrease nectar volume per flower (Mu et al. 2015, Takkis et al.
2015), and pollinators may prefer warmer nectar resource (Norgate et al. 2010, Nicolson et al. 2013) and higher sucrose concentration (Tan et al. 2013, Williams et al.
2015). However, less is known about warming impact on plant- pollinator interactions across altitude or latitude (Kudo and Ida 2013). As mismatches between plants and pollinators have become a major concern under climate change (Rafferty et al. 2011, Xiao et al. 2015), filling up this knowledge gap will help answer whether and how the mismatches may vary with altitude or latitude.
Species invasions are common worldwide
Many communities have or will have both native and exotic (e.g. invasive) pollinators (Dlugosch and Parker 2008, Sanguinetti and Singer 2014). Although some studies suggested the negative impact of exotic/invasive pollinators on local ecosystems (Aizen et al. 2008, Shimamoto et al. 2011, Russo et al. 2014, Martyniuk et al. 2014), less is known about the interaction between native and invasive
pollinator (Paini 2004, Thomson 2004, Roubik and Villanueva-Gutierrez 2009, Giannini et al. 2015). It is possible that native and exotic pollinators compete against each other, since native and exotic species may require similar abiotic and biotic resource, such as habitat and food resource, respectively (Hanna et al. 2014, Traveset and Richardson 2006, Riley and Dybdahl 2015). This competition may subsequently
affect plant communities. For example, compared to native pollinators, exotic pollinators might spend more time on one inflorescence and produce a lower
efficiency in cross pollination (Dupont et al. 2004). This lower cross-pollination might have a negative effect on native plants and in turn change the native plant and pollinator communities. Since the interaction between native and exotic pollinators can potentially change local communities, understanding this interaction is becoming an important issue in ecosystem management.
Knowledge gap 3: how will warming affect the current status of native and exotic
pollinators?
While it has become increasingly important to understand both native and exotic pollinators in a community, a knowledge gap remains – how the current status of native and exotic pollinators will change under warming (Schweiger et al. 2010, Rader et al. 2013). Given that native and invasive species might respond differently to warming (Verlinden et al. 2014), it is important to examine if warming will shift the
current balance and benefit native or exotic pollinators. In addition, a priority should focus on closely related native and exotic pollinators (e.g. congeneric), since exotic species are more likely to drive more phylogenetically related native species to local extinctions (Li et al. 2015).
Aims
To help fill up the knowledge gaps above, this study aims to understand warming impact on both native and invasive pollinators and their nectar plants across environmental gradients (i.e. altitude) (Fig. 1).
(1) Examine if warming will affect the growth and development of pollinators and nectar plants (flowers).
(2) Examine if warming will affect plant-pollinator interactions.
(3) Examine whether the warming effects above, if any, will vary across altitude.
(4) Examine if native and invasive pollinators may respond differently to warming across altitude.
(5) Besides spatial variation (altitude), how do plant-pollinator interactions vary temporally (e.g. seasonally) in the field?
To achieve these aims, this study examined one of the most common nectar plants (Bidens pilosa var. radiata) in subtropical Taiwan and two of its common
pollinator species other than bees, the native Pieris canidia and invasive P. rapae butterflies, which are common butterflies in Taiwan (Liu and Yang 2010). To examine warming impact on the growth and development of both plants (flowers) and pollinators across altitude, this study included a factorial laboratory experiment, where species from two altitude origins (low and medium) were collected and grew under temperature treatments (ambient, 3 and 6 oC warming), which simulated the warming scenario by 2100 (IPCC 2007, 2013). To understand plant-pollinator interactions in the field over seasons, this study conducted field survey in flower traits (reflectance, nectar analysis), pollinator density, and flower visit by pollinators at both low and medium altitude.
Materials and Methods
Study system
Bidens pilosa var. radiata (Compositae) is among the most notoriously invasive
plants in Taiwan (Chang et al. 2002, Jiang et al. 2003). It was introduced from north and tropical America to Taiwan after 1980s (Wu et al. 2004), serving as a nectar resource to bees. B. pilosa var. radiata is one of the three varieties of B. pilosa in Taiwan (the other two being B. pilosa var. minor and B. pilosa L. var. pilosa L.). B.
pilosa var. radiata and B. pilosa var. minor are exotic species in Taiwan, but only B.
pilosa var. radiata becomes invasive and seriously threatens the ecosystem (Peng et
al. 1998, Hsu 2006, Hsu and Kao 2009, Hsu and Kao 2014, Huang 2014, Huang and
Kao 2015). B. pilosa var. radiata is a perennial herb and produces flowers all year round, providing nectar and/or pollen as nutrient to most pollinators (Grombone-Guaratini et al. 2004, Li 2006, Liu and Yang 2010, personal observations).
It is one of the most common nectar plants to both two Pieris in the field (Liu and Yang 2010; personal observations) and is widespread from low to medium altitude in Taiwan and especially common at low altitude (Huang 2008). One previous study showed that some traits of B. pilosa var. radiata varied with altitude (Huang 2008), which might hint a genetic difference across altitude (Deng 2003, Deng et al. 2005).
Pieris canidia and P. rapae (Lepidoptera: Pieridae) are common butterflies in
lowland Taiwan, and reach high density from autumn-winter to spring (Li 2006, Li 2010, Lin 2015). P. canidia is native to Taiwan, but P. rapae is an invasive species likely with multiple invasions from Japan and China to Taiwan since 1960s (Li 2004).
Larvae of two Pieris exploit Brassicaceae plants including both agricultural plants (e.g. Brassica oleracea var. capitata) and wild plants (e.g. Rorippa indica) (Chew and Renwick 1995). However, Pieris adults can pollinate wild plants, such as Lantana camara L., B. pilosa var. radiata, etc. (Liu and Yang 2010, personal observations).
Laboratory experimental design
To examine warming impact on the growth and development of nectar plants and pollinators across altitude, I conducted a laboratory experiment with a 2 species origins (low, medium altitude) x 3 temperature treatments (ambient, 3, 6 oC warming) design on each species, which were collected from three study sites (Taipei, Taoyuan and Nantou) at each altitude in general.
Seeds of B. pilosa var. radiata and individuals of adult Pieris were collected at low and medium altitude from three sites in 2013 and 2014 (Table 1). A total of 24 pots of B. pilosa var. radiata (8 replicates per study site) were grown in each growth chamber. Each pot was bagged with a mesh net to prevent accidental herbivore damage. In addition, 24 replicates of P. rapae (8 from each study site) and 24
replicates of P. canidia (12 each from Taoyuan and Nantou) were reared in each growth chamber. P. canidia was not collected from Taipei due to low abundance at medium altitude.
Laboratory experimental procedure
Set-up
The low-altitude temperature treatments (growth chambers) were set at 22.8/20.4
oC, 25.8/23.4 oC and 28.8/26.4 oC (Fig. 2). The control temperature (22.8/20.4 oC)
represented the average autumn-winter temperature from 3 sites (Data Bank for Atmospheric Research, October to December, 2003-2012), accordingly with the initial months of occurrence in Pieris, which were among few butterfly species feeding on B. pilosa var. radiata during winter in Taiwan (Liu and Yang 2010). The medium-altitude temperature treatments (growth chambers) were set at 16.8/14.4 oC, 19.8/17.4 oC and 22.8/20.4 oC (Fig. 2). The control temperature (16.8/14.4 oC) was set based on a 6oC reduction rate per 1000 meters increase in altitude (Jump et al. 2009).
The warming treatment (3, 6 oC warming) for each altitude was set to simulate the warming scenarios by 2100, based on an IPCC prediction (IPCC 2007, 2013). The temperature treatment 22.8/20.4 oC (highest temperature treatment for medium altitude and lowest temperature treatment for low altitude populations) represented a common
garden, which allowed us to investigate a potential genetic difference in populations across altitude. The temperature treatments below were presented only in day temperature for simplicity. In addition, each growth chamber was set at a constant relative humidity (70%) and a 12:12 photoperiod. The position of plants and caterpillars in a growth chamber were regularly rotated to account for the potential systematic errors of growth chamber.
B. pilosa var. radiata morphology and growth
I sowed B. pilosa seeds randomly in plastic containers (9cm in diameter and 5cm in height). The substrate of each pot was composed of 100g prewatered peat soil (type B2, Kekkilä, Finland), and mixed with 100ml water. Those containers were then put in growth chambers under experimental temperature treatments. After seedlings emerged, I transplanted each seedling to a larger pot (15.24 cm in diameter and 16 cm in height).
The substrate of each pot was composed of 400g prewatered peat soil, and mixed with 400ml water. The plants were grown in growth chambers and watered 200 ml every two days.
To examine the impact of altitudinal origin and warming on plant performance, I measured weekly the plant vegetative traits (see Appendix A) and reproductive traits (flowering date and capitulum number). The first flowering date was recorded
because a shift in flower phenology might cause a mismatch between plants and pollinators (Iler et al. 2013, Anderson 2013, CaraDonna et al. 2014). Capitulum number is one of the flower attractiveness to pollinators (Brunet et al. 2015); thus, I counted weekly and calculated total capitulum number at the end of experiment (for 5 months).
To understand B. pilosa production under different temperature treatments across altitude, I did artificial pollination, collected seeds (Fig. 3), and then measured seed traits (seed number, length and weight). Based on a previous study, B. pilosa flowers are incomplete protandry, and anther mature before stigma (Huang 2012, Huang and Kao 2014). When stigma of B. pilosa was matured, I collected fresh capitulum from campus of National Taiwan University (25°00' N, 121°32' E) and mixed pollen grains.
I touched the mixed pollen three times with a cotton swab and put it on disk florets to make sure most flowers received pollens. After artificial pollination, I bagged the whole capitulum with a small mesh net in order to collect seeds later on. After seeds matured, I counted the seed number of each capitulum, and measured the mean seed length and weight in each pot. Mean seed length and weight were measured from 5 and 10 randomly selected seeds, respectively.
Flower reflectance
To examine the impact of altitudinal origin and warming on plant attractiveness to pollinators, I measured the reflectance of ray florets (hereafter flower reflectance), which could reflect flower attractiveness to pollinators (Campbell et al. 2010, Koski and Ashman 2015). The capitulum not artificially pollinated were cut down, kept under low temperature to maintain freshness, and measured for their spectral reflectance within 24h to reduce potential water loss. The reflectance was recorded by a spectrometer (S2000, Ocean Optics Inc.), and I placed light probe 0.5cm above the middle of ray florets (Tso et al. 2002, Tso et al. 2004). All of the flower reflectance results were plotted from 300nm. Six wavelengths of flower reflectance (340nm, 380nm, 480nm 560nm and 620nm) were further analyzed because they represent the spectral sensitivity peak of P. rapae (Shimohigashi and Tominaga 1991, Qiu and Arikawa 2003a and 2003b).
Pieris morphology and growth
I collected adult butterflies from low and medium altitude in autumn 2013 for P.
canidia and in spring 2014 for P. rapae. Adult Pieris were put in a cage (length:
width: height=50 cm: 50 cm: 80 cm) with cabbage (Brassica oleracea var. capitata L.) as host plants in green house. I provided B. pilosa var. radiata flowers as nectar resource every two days. After female Pieris laid eggs on host plants, I used the
newly hatched caterpillars in the following laboratory experiment.
To examine the impact of altitudinal origin and warming on pollinator performance, I measured the Pieris growth and development traits (body weight, development time, head width (4th instar) and adult forewing length) from the first instar to adult stage. Larvae grew in plastic containers (9 cm in diameter and 5 cm in height) with a mesh on top until becoming pupae (details in Appendix B). After becoming pupae for one day, pupae were weighted and then removed from the original container to a new one to avoid the failure of eclosion, with the pupal period recorded. After becoming adults for 12hs, Pieris were measured for their forewing length. Females and males were separated in different cages to avoid mating. All cages were put back to growth chambers, and the adult longevity was observed. The adult density of each cage was no more than five individuals to avoid strong competition. B. pilosa flowers, collected from the campus of National Taiwan University (25°00' N, 121°32' E), were supplied every two days as nectar resource to Pieris adults. After adults died, they were kept in triangle paper bags and dried at
40oC for three days at least. I measured the adult dry weight and then calculated adult fresh weight based on the correlation between dry and fresh body weight (Lin 2015).
Interaction between Pieris and B. pilosa var. radiata
To examine the impact of altitudinal origin and warming on plant-pollination interaction, I recorded the flower-visiting behavior (frequency and duration) of Pieris on B. pilosa under different temperature treatment. I collected twenty capitulum of B.
pilosa from National Taiwan University (25°00' N, 121°32' E), and kept the B. pilosa
and each Pieris adult in the center of a cage under each temperature treatment (growth chamber) of this study. I recorded the time period of staying and feeding on flowers for each Pieris individual during 20 minutes of observation. I conducted one to two observation trials per individual, depending on its longevity.
This article focuses on plant flower traits, pollinator traits, and their relationships. Therefore, the results of plants vegetative growth traits and larval growth traits will be listed in appendix.
Field experimental design
To examine the spatial and temporal variation in plants and pollinators in the field, I also conducted field surveys at different altitude (low, medium) across months in three study sites (Taipei, Taoyuan and Nantou) in 2014 and 2015. The field surveys examined: (1) If the attractiveness of B. pilosa plants to pollinators (i.e. capitulum number, flower reflectance, sugar composition) would be different across altitude and months. (2) If the interaction between B. pilosa and pollinators (pollinators density,
flower visit) would be different across altitude and months.
To examine the potential impact of environmental factor (e.g. mean temperature, humidity and diurnal temperature variation) on plant-pollinator interactions in the field, I collected the weather data since 2014 from three study sites using WatchDog B-series button logger (Spectrum Technologies, Inc.) (details in Appendix D).
Field experimental procedure
Capitulum number
To examine the impact of altitudinal origin on flower attractiveness to pollinators in the field, I counted capitulum number at low and medium altitude (each with three study sites) in four months (January, April, July and October 2014). A total of 18 replicates of capitulum number (6 replicates per study site) were counted at each altitude for each month.
Flower reflectance
The protocol to measure field flower reflectance is similar to that in the laboratory experiment. Samples were collected at both altitudes from two study sites (Taoyuan and Nantou) in four months (January, April, July and October, 2014). I kept the samples under low temperature (cooler) to maintain freshness and measured the
flower reflectance within 24hrs. The mean reflectance was calculated from three capitulum per plant, and I plotted reflectance figures from 300nm. The six major wavelengths for Pieris were analyzed over altitude and months. A total of 18 replicates of mean flower reflectance (6 replicates per study site) were measured at each altitude for each month.
Sugar composition in nectar
To examine the impact of altitudinal origin on sugar composition, I collected capitulum from the three study sites at each altitude in three months (March, August and October 2014). This study analyzed nectar because it provides pollinator energy resource and could reflect flower attractiveness to pollinators. The samples were kept under low temperature (cooler) to maintain freshness. The sample from Nantou in August was excluded because of an accident. Sugar, including glucose, fructose and sucrose (Baker and Baker 1983, Nicolson and Thomburg 2007), were be analyzed, and then I calculated the proportion and weight per capitulum for each type of sugar.
The sugar volume, quality and concentration were measured with High-Performance Anion-Exchange Chromatography with Pulsed Amperometric Detection (HPAEC-PAD, details in Appendix C). A total of 18 replicates of sugar composition (6 replicates per study site) were measured at each altitude for each month.
Pollinator density
To examine the impact of altitudinal origin on plant-pollination interactions in the field, I conducted pollinator density observations at both altitudes from two study sites (Taoyuan and Nantou) in three months (January, March, and August) in 2014 or 2015. I observed areas around 3 x 3 m2 with B. pilosa flower coverage over 70% for 30 minutes on sunny days during 9:00 - 15:00. The pollinator group (bee, butterfly, others) and abundance were recorded. The abundance of bees was recorded every 5 minutes due to their high activity, which made counting other pollinators difficult at the same time. One area at each altitude per site in August and three areas at each altitude per site in January and March were conducted.
Statistical analysis
Laboratory experiment
This study examined the impact of warming and altitude origin on plant and pollinator performance with GLMM (Generalized linear mixed models). Plant growth traits (e.g. height, leaf number) were analyzed with temperature treatment (ambient, 3, 6 oC warming) and species origin (low, medium altitude) as fixed factors, site as random factor, week as a repeated factor, and plant individual as a subject. Flower
reflectance under six major wavelengths was analyzed by MANOVA (Multivariate Analysis of Variance), with temperature and species origin as factors. Other plant traits (e.g. flowering date, biomass) were analyzed by GLMM with temperature treatments and species origin as fixed factors, and site as a random factor. The pollinator traits (e.g. body weight, forewing length) were analyzed by GLMM with temperature treatments, species origins, species identity (native, invasive species) as fixed factors, and site as a random factor. Pieris visit rate was analyzed by logistic regression, with temperature treatments, species origins, and species identity as fixed factors and site as a random factor. All analyses above were conducted using SAS 9.4 (SAS Institute Inc., Cary, NC, USA).
Field survey
Pollinator density and capitulum number were analyzed by GLMM, with species origins (low, medium altitude) and month (or season) as fixed factors, and site as a random factor. Flower reflectance was analyzed by MANOVA, with species origin and month as fixed factors and site as a random factor. Flower attractiveness (e.g.
nectar content) within a site was analyzed by GLM, with species origin and month as factors. All analyses above were conducted using SAS 9.4.
Results
Warming effect on plant growth and development across altitude
Reproductive trait - flower
Warming effect on plant vegetative traits (Table A1) and reproductive traits (Table 2) varied with altitude. Warming advanced flowering date and capitulum number in medium-altitude, but did not do so in low-altitude plants (Fig. 4). B. pilosa from both altitudes showed no difference in flowering date or capitulum number in the common garden experiment (i.e. 22.8 oC, capitulum number, P =0.1717; flowering date, P =0.2267).
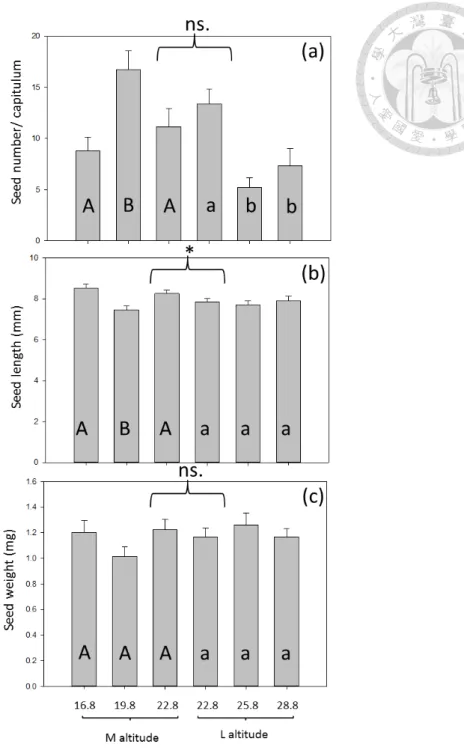
Reproductive trait- seed
Warming had a different effect on seed number, length, and weight (Table 3, Fig.
5). Warming (3oC only) increased seed production by 90% in medium-altitude B.
pilosa, but warming decreased that by 45-61% in low–altitude plants (Fig. 5a). B.
pilosa from both altitudes showed no difference in common garden experiment (Fig.
5a, P =0.7676). Differently, warming (3oC only) reduced seed length by 12% in medium-altitude plants, but had no effect on low-altitude plants. B. pilosa from medium altitude had longer seed length than those from low altitude in common garden experiment (Fig. 5b, P =0.0222). As for seed weight, either warming or plant
origin (altitude) had no effect (Fig. 5c, warming, P=0.6868; plant origin, P =0.9860).
Warming effect on pollinator growth and development across altitude
Pieris rapae
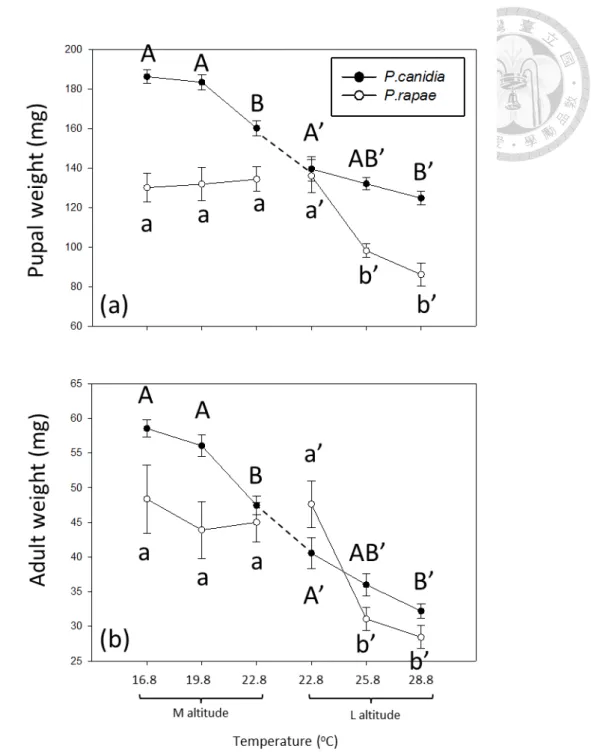
Warming impact on the pupal and adult body weight of P. rapae varied with altitude (Table 4, Fig. 6). In specific, warming had no effect on medium-altitude P.
rapae but decreased the pupal weight of low-altitude P. rapae by 37% (Fig. 6a). The
pupal weight of P. rapae from both altitudes showed no difference in common garden experiment (Fig. 6a, P =0.8444). Warming had no effect on the adult weight of
medium-altitude P. rapae but decreased that of low-altitude P. rapae by 40% (Fig. 6b).
The adult weight of P. rapae from both altitudes showed no difference in common garden experiment (Fig. 6b, P = 0.3629).
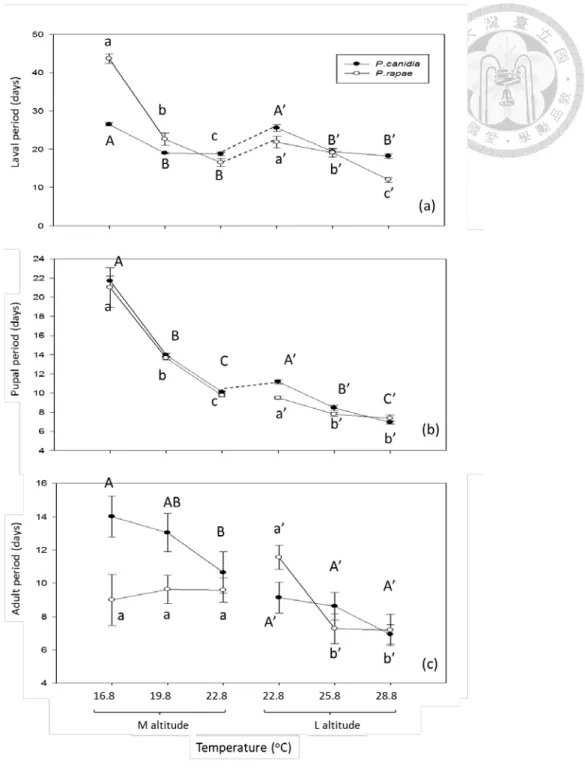
Warming affected the larval period, pupal period, and adult period of P. rapae (Table 5, Fig. 7). In specific, warming reduced the larval period of medium- and low-altitude P. rapae by up to 62 and 45%, respectively (Fig. 7a). Warming also reduced the pupal period of medium- and low-altitude P. rapae by up to 54 and 22%, respectively (Fig. 7b). However, warming did not affect and reduced (19%) the adult period of medium- and low-altitude P. rapae, respectively. In common garden experiments, low-altitude P. rapae had a longer larval period than medium-altitude
ones (larval period, P <0.0001; pupal period, P =0.5464; adult period, P =0.1884).
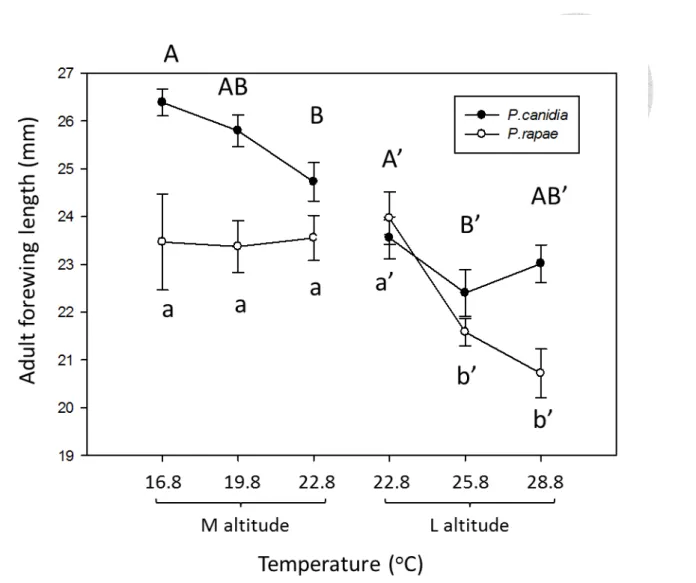
Warming also affected the morphology (wing length) of P. rapae, while this effect varied with altitude (Table 6, Fig. 8). In specific, warming did not affect and reduced (14%) the forewing length of medium- and low-altitude P. rapae, respectively.
The adult forewing length of P. rapae from both altitudes showed no difference in common garden experiment (Fig. 8, P =0.4967).
Pieris canidia
Warming impact on the pupal and adult body weight of P. canidia varied with altitude (Table 4, Fig. 6). In specific, warming decreased the pupal weight of medium- and low-altitude P. canidia by 14 and 11%, respectively (Fig. 6a). In common garden experiment, medium-altitude P. canidia had heavier pupal weight than low-altitude ones (Fig. 6a, P =0.0023). Warming decreased the adult weight of medium- and low-altitude P. canidia by 19 and 21%, respectively (Fig. 6b). In common garden experiment, medium-altitude P. canidia had heavier adult weight than low-altitude ones (Fig. 6b, P=0.0070).
Warming affected the larval period, pupal period, and adult period of P. canidia (Table 5, Fig. 7). In specific, warming reduced the larval period of medium- and low-altitude P. canidia by up to 29 and 28%, respectively (Fig. 7a). Warming also
reduced the pupal period of medium- and low-altitude P. canidia by up to 38 and 16%, respectively (Fig. 7b). However, warming reduced (24%) and did not affect the adult period of medium- and low-altitude P. canidia, respectively. In common garden experiments, low-altitude P. canidia had a longer larval and pupal period than medium-altitude ones (larval period, P <0.0001; pupal period, P =0.0012; adult period, P =0.1164).
Warming also affected the morphology (wing length) of P. canidia, while this effect varied with altitude (Table 6, Fig. 8). In specific, warming reduced the forewing length of medium- and low-altitude (3oC only) P. canidia by 6% and 5%, respectively.
The adult forewing length of P. canidia from both altitudes showed no difference in common garden experiment (Fig. 8, P =0.0758).
Native vs. invasive pollinators
As for pupal and adult weight, the native Pieris was usually heavier than the invasive Pieris, but warming impact may vary with species and altitude (Table 4, Fig.
6). For example, warming reduced the difference between the native and invasive Pieris in pupal weight at medium altitude, but increased the difference at low altitude
(Fig. 6a). Warming reduced the difference between the native and invasive Pieris in adult weight at medium altitude, but did not affect the difference at low altitude (Fig.
6b).
As for the larval, pupal, and adult period, the native Pieris had longer larval period but shorter pupal period than the invasive Pieris, but warming impact may vary with species and altitude (Table 5, Fig. 7). For example, warming reduced the difference between the native and invasive Pieris in larval period at medium altitude, but increased the difference at low altitude (Fig. 7a). Warming did not affect the difference between the native and invasive Pieris in pupal period at medium altitude, but reduced the difference at low altitude (Fig. 7b).
As for forewing length, medium-altitude native Pieris had longer forewing length than the invasive Pieris under ambient or warming treatment. However, low-altitude native Pieris only had longer forewing length than the invasive Pieris under 3 oC warming treatment (Table 6, Fig. 8)
Warming effect on plant-pollinator interactions across altitude
Warming impact on flower-visiting behavior of Pieris on B. pilosa var. radiata in the
laboratory
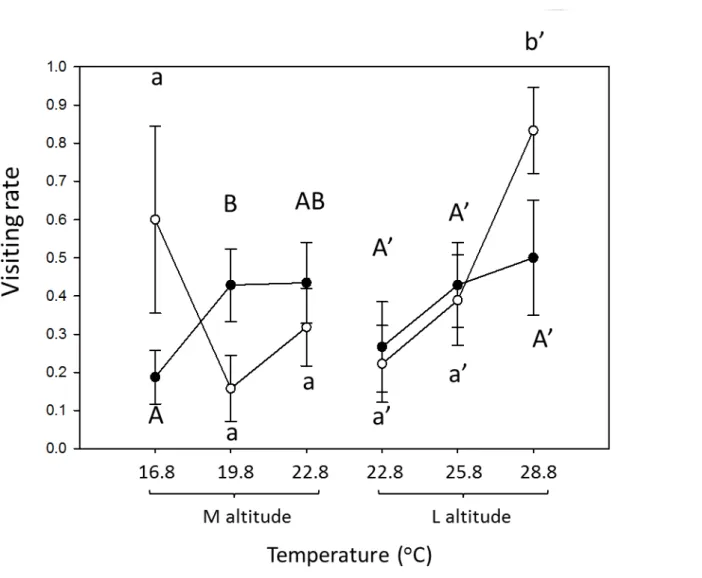
Warming could affect the flower-visiting rate, visit duration, and feeding duration of Pieris in laboratory experiments. As for the flower-visiting rate of Pieris on B. pilosa, warming did not affect and increased that of medium- and low-altitude P.
rapae from, respectively (Table 7, Fig. 9). Warming increased (3oC only) and did not affect the flower-visiting rate of medium- and low-altitudes P. canidia, respectively.
The flower-visiting rate of P. rapae or P. canidia showed no difference across altitude in common garden experiment (P. rapae, P =0.5015; P. canidia, P =0.2990). Warming did not affect the difference between native and invasive Pieris at both altitudes.
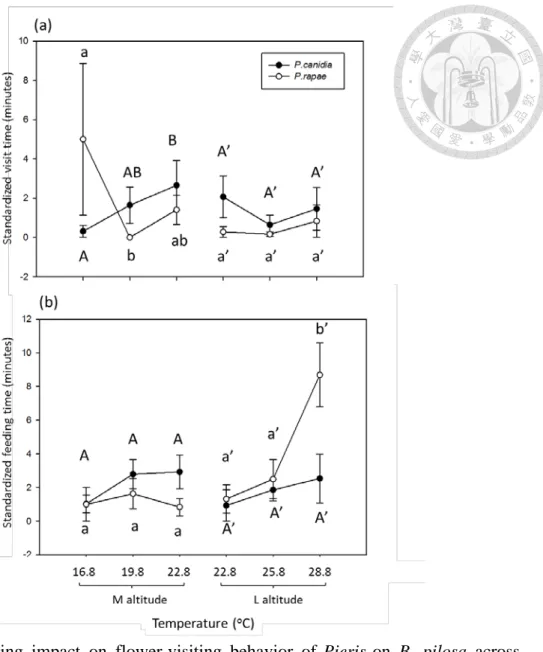
As for the flower-visiting duration, warming overall did not affect that of both Pieris (Table 7, Fig. 10a). However, warming (3 oC only) decreased that of medium-altitude P. rapae on B. pilosa. In addition, warming increased that of medium-altitude P. canidia on B. pilosa but had no effect on low-altitude ones. The flower-visiting duration of P. rapae and P. canidia showed no difference across altitude in common garden experiment (P. rapae, P =0.2547; P. canidia, P =0.7906).
Furthermore, warming reduced the difference in flower-visiting duration between native and invasive Pieris at medium altitude, but had no effect at low altitude.
As for feeding duration, warming increased that of low-altitude P. rapae on B.
pilosa, but had no effect on medium-altitude P. rapae or both low- and
medium-altitude P. canidia (Table 7, Fig. 10b). The feeding duration of P. rapae and P.
canidia showed no difference across altitude in common garden experiment (P. rapae,
P =0.7781; P. canidia, P =0.2478). In addition, warming increased the difference in
feeding duration between native and invasive Pieris at low altitude but had no effect
at medium altitude (Fig. 10b).
Flower attractiveness (reflectance) of B. pilosa var. radiata in the laboratory
Warming impact on flower reflectance under the six wavelengths varied with altitude (Table 8, Fig. 11). Warming decreased and did not affect the flower reflectance of B. pilosa from medium and low altitude, respectively (Fig. 11a, b).
Low-altitude flowers had higher reflectance than medium-altitude ones in common garden treatment (Fig. 11c, P<0.0001).
Spatial (altitude) and temporal variations in the field
Flower traits of B. pilosa var. radiata
The flower traits of B. pilosa (capitulum number, flower reflectance, disk florets weight, and sugar content), which could be related to plant attractiveness to pollinators varied spatially and temporally in my field study.
Capitulum number recorded from the field (Ho et al. unpublished data) showed a spatial and temporal variation (Fig. 12; altitude, P =0.1376; season, P <0.0001;
altitude*season, P <0.0001). Low-altitude B. pilosa had higher capitulum number than medium-altitude ones in winter. At medium altitude, there were more capitulum in fall than in spring, summer and winter. At low altitude, there were more capitulum
in fall and winter than in summer. However, the patterns were different across sites (Fig. A5).
Flower reflectance also varied spatially and temporally (Table 9). Generally, the flower reflectance of field B. pilosa showed a similar pattern to that in the laboratory experiment. Low-altitude B. pilosa had higher flower reflectance than medium-altitude ones in the field (Fig. 13, P=0.0497). Low-altitude B. pilosa had higher flower reflectance than medium-altitude ones in summer and fall, but had no difference across altitude in spring and winter (Table 9, Fig. 14). At medium altitude, higher flower reflectance was observed in summer than in spring and fall. Similarly, at low altitude, higher flower reflectance was observed in summer than in spring, fall and winter (Fig. 15).
Flower weight was also measured in this study, since it might be related to sugar volume (Herrer 1985, Galletto and Bernardello 2004.). Both whole flower weight (P=
0.2899) and disk florets weight (P= 0.4719) had no difference across altitudes in general (Fig. 16). However, flower weight varied with months: flowers were heavier in October than March and August (whole flower weight, P< 0.0001; disk flower weight, P<0.0001). In specific, medium-altitude B. pilosa had higher whole flower weight in October than in March and August, and low-altitude B. pilosa had higher whole flower weight in March and October than in August (Fig. 16a).
Medium-altitude B. pilosa had higher disk florets weight in October than in March and August, but low-altitude B. pilosa had higher disk florets weight in October than August (Fig. 16b). The patterns were different across sites (Fig. A6).
Sugar content also had varied spatially and temporally (Table 10). Generally, nectar analysis showed that the sugar content of field B. pilosa varied with altitude (Fig. 17). In specific, low-altitude B. pilosa had higher glucose content than medium-altitude ones (P =0.0017), but medium-altitude B. pilosa had higher sucrose content (P =0.0084) (Fig. 17a). As for the sugar weight per flower, low-altitude B.
pilosa had more glucose, fructose and total sugar than medium-altitude ones (glucose,
P <0.0001; fructose, P <0.0001; sucrose, P =0.1496; total sugar, P =0.0003) (Fig.
17b). However, the sugar content varied with altitude and months. As for the spatial variation in Taoyuan (Fig. 18), low-altitude B. pilosa had higher fructose and sucrose proportion than medium-altitude ones in October and August, respectively. And the pattern was same for fructose and sucrose weight per flower. However, low-altitude B.
pilosa had less glucose proportion than medium-altitude ones in October and August.
As for the temporal variation at low-altitude, higher glucose proportion was observed in March and October than August, and higher sucrose proportion was observed in August than March and October. At medium altitude, higher glucose proportion was observed in October than in March and August, higher fructose proportion was
observed in March and August than in October, and higher sucrose proportion was observed in August than in March and October. The patterns in sugar weight per flower were similar to those in sugar proportion. However, the patterns in sugar content varied across sites (Fig. 18, Fig. 19).
Pollinator density
Pollinator density survey in the field showed that butterflies (Pieris mainly) were important pollinators besides bees (Table 11, Fig. 20). Pieris abundance (including passing and visiting individuals) in B. pilosa area varied spatially and temporally. As for the spatial variation, Pieris density was higher at low altitude than medium altitude in January and March, but not in August. As for the temporal variation, Pieris density was higher in March and August than in January at medium altitude, but higher in March than in January and August at low altitude.
Total butterfly abundance varied spatially and temporally as well. As for the spatial variation, total butterfly density was higher at low altitude than medium altitude in January and March, but not in August. As for the temporal variation, total butterfly density was higher in August than in January and March at medium altitude, but higher in March than in January and August at low altitude.
Bee density varied spatially and temporally. As for the spatial variation, bee
density was higher at low altitude than medium altitude in January and March but not in August. As for the temporal variation, bee density was similar across months at low altitude, but higher in March and August than January at medium altitude. Overall, total pollinator density (bees+ butterflies+ others) was higher at low altitude than medium altitude in January and March, but not in August. Total pollinator density was similar across months at low altitude, but higher in March and August than in January at medium altitude.
Discussion
Summary
This study has these major findings: 1) Warming impact on plants, pollinators, and their interactions might differ across altitude. 2) Warming may lead to a mismatch between plants and pollinators, since warming mostly affected the performance of adult Pieris from low altitude, but the flower traits of B. pilosa from medium altitude.
3) Warming impact on the native and invasive pollinators differed. In specific, the native P. canidia would be more sensitive to warming than the invasive P. rapae at medium altitude, but invasive P. rapae would be more sensitive to warming than native P. canadia at low altitude. 4) Warming impact on plants and pollinators could be a function of both plasticity and genetic difference across spatial gradients. 5) The field survey showed that both Pieris and B. pilosa traits varied spatially (altitude) and temporally (months) in the field.
Warming impact on nectar plants, pollinators, and their interactions varies with
altitude
Nectar plants
The flower traits of B. pilosa (capitulum number and flower reflectance) could be related to plant attractiveness to pollinators in this study. Since warming impact on
the flower and seed traits of plants (B. pilosa) differed across altitude, warming may have an altitude-dependent consequence on plant reproduction (Fig. 21). For example, warming increased the capitulum number of medium-altitude plants (i.e. increased flower display to pollinators (Strauss 1997, Brunet et al. 2015)), but had no effect on low-altitude plants. Warming reduced the flower reflectance of medium-altitude plants and likely lowered their attractiveness to pollinators, based on a positive correlation between flower reflectance and attractiveness to pollinators (Rae and Vamosi 2013, Song et al. 2015), but warming had no effect on low-altitude plants.
Since flower reflectance could be affected by a change in anthocyanin content, distribution, or epidermal cell shape (Anderson et al. 2013, Papiorek et al. 2014), future studies can examine whether warming changes flower reflectance by affecting these structure factors.
Given that warming caused conflicting effects on the attractiveness of medium-altitude plants, it will require a real pollination study to understand the net effect of warming. While this study (artificial pollination) did not test how warming impact on flower attractiveness to pollinators would subsequently affect seed production, this study did reveal direct warming impact on seed production. For instance, warming decreased the seed production (i.e. seed number) of low-altitude B.
pilosa plants, but warming (3oC only) increased that of medium-altitude plants.
The results in this study help advance our understanding in warming impact on nectar plants. For example, previous studies showed negative impact of warming on flower number and nectar volume, but positive impact on flowering date (i.e.
advancement) (Saavedra et al. 2003, Liu et al. 2012, Mu et al. 2015, Whittington et al.
2015). This study actually suggests that many of these warming effects could be altitude dependent. In addition, previous studies suggested that the response of plant reproductive traits to warming could be plastic (Van Etten and Brunet 2013, Anderson et al. 2013, Frei et al. 2014a, Cranston et al. 2015, Pajoro et al. 2016). This study
further shows that these responses should be a function of both plasticity and genetic difference (i.e. genotypes across altitude). Finally, a previous study showed that B.
pilosa from different altitudes had no difference in leaf chlorophyll content and seed
weight (Huang et al. 2015), but this study demonstrates that medium-altitude B.
pilosa could have higher leaf chlorophyll content than low-altitude ones, in common
garden.
Pollinators
Warming impact on the forewing length of pollinators (Pieris) differed across altitude, and this may have an altitude-dependent consequence on pollination service (Fig. 21). Previous studies have suggested a positive correlation between butterfly
forewing length and flight distance (Greenleaf et al. 2007, Ducatez et al. 2012, Skórka et al. 2013, Shi et al. 2015, Blanken et al. 2015). This study showed that warming reduced the forewing length of both low- and medium-altitude P. canidia, potentially shortening their flight distance from both altitudes. However, warming only reduced the forewing length of low-altitude P. rapae, potentially shortening the flight distance of low- but not medium-altitude P. rapae. Since B. pilosa needs pollens from different flowers for cross-pollination (Huang et al. 2012), pollinators with longer flight distance may facilitate Bidens pollen exchange and successful pollination.
Therefore, B. pilosa might face reduced pollination service from the native P. canidia at both altitude under warming (i.e. due to shorter forewings) and from the invasive P.
rapae at low altitude under warming.
Warming impact on Pieris adult period (longevity) varied with species and altitude, suggesting species- and altitude-dependent warming impact on pollination service (Fig. 21). Longer pollinator longevity might benefit nectar plants because pollinators could provide longer pollination service and increase pollination efficiency.
This study showed that warming reduced the adult period of medium-altitude P.
canidia, potentially decreasing its pollination service. Warming, however, reduced the
adult period of low-altitude P. rapae.
Interestingly, while Pieris adults can serve as beneficial pollinators to many
plants, Pieris larvae are major agricultural pests worldwide. In this study, warming reduced the larval period of Pieris from both altitudes but decreased adult period of P.
canidia and P. rapae from medium- and low-altitude, respectively. Thus, warming
might reduce Pieris larvae damage to crops and Pieris adults’ pollination service to plants simultaneously. However, this prediction is based on an assumption that shorter life cycle will not lead to more Pieris generations per year, unlike the case where more generations of herbivores in a growth season cause more threat to plant in the long term (Gomi et al. 2007, Altermatt 2010, Martín‐Vertedor et al. 2010). The life tables of low- and medium-altitude Pieris were included in Table A5 and A6.
Putting warming impact on adult period and forewing length together, this study suggests a negative impact of warming on the pollination service of P. canidia at medium altitude, since warming decreased the adult period and forewing length.
However, the overall impact of warming on P. rapae is not that straightforward, since warming decreased the adult period and forewing length of low-altitude P. rapae but increased the feeding duration, which might compensate the negative impact of warming.
The results in warming impact on Pieris were similar to many previous studies, which have shown that warming had negative effects on the body weight, development and adult forewing length of butterflies (Kingsolver 2000, Stevens 2004,
Kingsolver et al. 2012, Stuhldreher et al. 2014, Barton et al. 2014, Bauerfeind and Fischer 2014). For example, warming could increase the developmental rate and reduce the pupal weight of P. rapae (Whitney-Johnson et al. 2005). Also, previous studies suggested that larger body size of pollinators had lower visitation rate (Stout 2000, Vivarelli et al. 2011), but higher pollination efficiency (O'Neill and O'Neill 2010, Luo et al. 2012, Pearce et al. 2012, Willmer and Finlayson 2014). Accordingly in this study, warming decreased the body size (forewing length) and increased the visitation rate of low-altitude P. rapae.
Plant-pollinator mismatch
Because plants and pollinators had a different response to warming across altitude (Fig. 22), warming might lead to a mismatch in plant-pollinator communities across altitude and then impede associated ecosystem service (pollination). For example, warming advanced flowering date and increased capitulum number in medium-altitude plants, but decreased adult period in medium-altitude P. canidia.
Therefore, this positive and negative warming impact on plants and pollinators, respectively, can result in a plant-pollinator mismatch at medium altitude.
Furthermore, this plant-pollinator mismatch varied across altitude, since warming did not affect flower traits and the adult period of P. canidia at low altitude.