國立臺灣大學公共衛生學院職業醫學與工業衛生研究所 博士論文
Institute of Occupational Medicine and Environmental Hygiene College of Public Health
National Taiwan University Doctoral Dissertation
六輕石化工業區附近居民多重污染暴露與代謝體關係 之暴露體學研究
Exposomic study on the association between multiple pollutants exposure and metabolome in residents living
near No. 6 Naphtha Cracking Complex
陳其欣 Chi-Hsin Chen
指導教授:詹長權 博士
Advisor: Chang-Chuan Chan, Sc.D.
中華民國 108 年 7 月
July 2019
i
中文摘要
研究背景:暴露體學已成為環境衛生學界的重要方法論,近年來更是發展出
“Public Health Exposome Approach”,探討特定地區的暴露特徵及健康影響。本論文 針對台灣最大的石化工業區第六套輕油裂解廠 (簡稱六輕) 附近居民進行暴露體 學研究,找出暴露程度、代謝體及早期健康效應生物指標物之間的相關性。
研究方法:本研究依住家與六輕距離、尿中暴露生物指標物濃度 (釩與多環芳香 烴暴露生物指標物 1-羥基芘) 將 273 位研究對象分為高暴露組 (9-15 歲小孩 43 人、> 55 歲老年人 77 人) 與低暴露組 (小孩 75 人、老年人 78 人),分析 其 (一) 外在暴露:對六輕主要排放源的距離、住家附近道路面積、住家空氣中 釩及多環芳香烴濃度;(二) 內在暴露:尿中石化工業污染暴露生物指標物砷、
鎘、鉻、鎳、汞、鉛、釩、錳、銅、鍶、鉈與 1-羥基芘濃度;(三) 代謝體:利 用二維氣相層析飛行時間質譜儀建立尿液代謝體,以超高壓液相層析-四極柱飛 行時間質譜儀分析血液代謝體及血液脂質體;(四) 早期健康效應:尿中氧化壓力 指標物與血中醯基肉鹼類濃度。本研究以「中途相遇法」找出潛在可作為連結暴 露與早期健康效應的中間生物指標物,並以生物途徑分析找出多重石化工業污染 物暴露可能影響的生理途徑。
研究成果:本研究結果顯示在小孩及老年人受試者中,高暴露組比低暴露組居住離 六輕主要排放源較近、有較高的住家空氣中釩及多環芳香烴濃度,且高暴露組比低 暴露組有較高的尿中暴露生物指標物濃度與氧化壓力生物指標物濃度。尿液代謝 體在高低暴露組之間有年齡依賴性的改變可連結多重暴露與氧化壓力,在小孩中 是色氨酸代謝等途徑的異常,在老年人中則是甘氨酸、絲氨酸與蘇胺酸代謝等途徑 的異常,且在小孩與老年人的尿液代謝體中發現潛在暴露生物指標物癸烷、十二烷、
十三烷。小孩的血液代謝體在高低暴露組之間有顯著差異,並找到十個潛在可做為 中間生物指標物的代謝物質,連結多重工業致癌物暴露 (國際癌症研究機構定義一
級致癌物:砷、鎘、鉻、鎳;二級致癌物:汞、鉛、釩、多環芳香烴) 與早期健康 效應氧化壓力增加、血中醯基肉鹼類濃度異常。生物途徑分析結果顯示小孩暴露於 多重工業致癌物質可能造成嘌呤代謝途徑異常。小孩的血液脂質體在高低暴露組 之間有顯著差異,並發現有 21 個脂質與多重工業污染物暴露相關,包括溶血卵磷 脂類、卵磷脂類、神經鞘磷脂類及磷脂酸肌醇類,這四種脂質皆可連結到尿中氧化 壓力生物指標物或血中醯基肉鹼類。
結論:Public health exposome approach 可用於探討石化工業影響地區內的易感族 群,並釐清多重工業污染暴露如何影響重要生理途徑,導致與慢性和急性疾病相關 的早期健康效應。氣相層析方法分析尿液代謝體可用於辨識石化工業附近的易感 族群如小孩與老年人,並發現與年齡相關的生理途徑連結多重暴露與氧化壓力。液 相層析方法分析血液代謝體可用於尋找多重工業致癌汙染物暴露在小孩與青少年 體內影響的生理途徑,並連結癌症相關的早期健康效應。液相層析方法分析血液脂 質體可用於辨識多重工業污染暴露在小孩及青少年體內造成與肝功能異常相關的 脂質變化。基於本研究的發現,我們建議顯著降低石化工業污染排放量以減少暴露 程度、改善代謝異常,並持續追蹤六輕附近居民的健康狀態。本研究也證實,暴露 體學可作為公共衛生研究工具,探討工業污染對附近居民既有及潛在的健康效應,
未來可作為尋找新的個人化健康效應指標及暴露生物指標物質、建立個人化風險 評估指標的參考。
關鍵字:石化工業、暴露體學、代謝體學、脂質體學、重金屬、多環芳香烴
iii
Abstract
Background: Exposomics is an important methodology in environmental health research.
Recently, a branching paradigm, the Public Health Exposome Approach, focuses on the impact of exposures on the overall health of a population within a particular region. This dissertation focuses on the exposomics study of residents living near No. 6 Naphtha Cracking Complex, the largest petrochemical complex in Taiwan, and aim to clarify the association between exposure levels, metabolome, and early health effect biomarkers.
Material and Methods: We classified 273 study subjects as high exposure group
(children aged 9-15 N=43; elderly aged > 55 N=77) and low exposure group (children N=75; elderly N=78) by the distance from their homes to the complex, and urinary levels of exposure biomarkers vanadium (V) and polycyclic aromatic hydrocarbon (PAHs) metabolite 1-hydroxypyrene (1-OHP). We analyzed (1) external exposures: distance from their homes to main emission points of the complex, road area surrounding homes, and ambient levels of V and PAHs at homes using previously established models; (2) internal exposures: urinary levels of exposure biomarkers, arsenic (As), cadmium (Cd), chromium (Cr), nickel (Ni), mercury (Hg), lead (Pb), vanadium (V), manganese (Mn), copper (Cu), strontium (Sr), thallium (Tl), and 1-OHP; (3) metabolome: urine metabolomics was analyzed using two dimensional gas chromatography coupled with time-of-flight mass spectrometry (GCxGC-TOFMS), and serum metabolomics and lipidomics were analyzed using ultra-high performance liquid chromatography-quadrupole time-of-flight mass spectrometry (UHPLC-qTOFMS); (4) early health effects: urinary levels of oxidative stress biomarkers, and serum acylcarnitines. We applied “meet-in-the-middle” approach to identify potential intermediate biomarkers connecting exposures with early health effects, and pathway analysis to find biological mechanisms affected by exposure to multiple pollutants.Results: In both children and elderly subjects, high exposure group lived closer to main
emission points of the complex, had elevated ambient levels of V and PAHs at home locations, and increased urinary exposure biomarkers and oxidative stress biomarkers compared to low exposure group. Urine metabolomics identified age-dependent biological pathways that associated multiple pollutants exposure with increased oxidative stress, including tryptophan metabolism in children, and serine, glycine, and threonine metabolism in elderly subjects. In addition, potential exposure biomarkers decane, dodecane, and tridecane were identified in both children and elderly subjects. Serum metabolomics found 10 potential metabolites possibly linking increased exposure to IARC group 1 carcinogens (As, Cd, Cr, Ni) and group 2 carcinogens (V, Hg, PAHs) with elevated oxidative stress and deregulated serum acylcarnitines. Purine metabolism was identified as the possible mechanism affected by children’s exposure to carcinogens.Serum lipidomics results in children also showed significant difference between high and low exposure groups. We found 21 lipids associated with multiple industrial pollutants exposure, including lysophosphatidylcholines, phosphatidylcholines, sphingomyelins, and phosphatidylinositols. All four types of lipids were associated with urinary oxidative stress biomarkers and/or serum acylcarnitines.
Conclusion: Public health exposome approach could be used in a large petrochemical
industry influenced region to identify vulnerable populations, and understand how multiple industrial pollutants exposure are affecting critical biological mechanisms, leading to early health effects that may be precursors to chronic and acute diseases. Urine metabolomics analyzed via GC-based method could be used to identify children and elderly as vulnerable populations in regions influenced by a large petrochemical industry, and found age-dependent pathways linking multiple exposures to increased oxidative stress. Serum metabolomics analyzed via LC-based method could be used to findv
biological pathways affected by multiple industrial carcinogenic pollutants exposure in children and adolescents, that could be linked to cancer-related early health effects. Serum lipidomics analyzed via LC-based method could be used to identify in children and adolescents exposed to multiple industrial pollutants, lipid profile changes that have been implicated in liver dysfunctions. Based on our findings, we suggest significant reduction of petrochemical industrial emissions from the complex to decrease multiple pollutants exposure and metabolic abnormalities, and continued follow up on of residents’ health.
This dissertation also attests the application of exposomics as a public health research tool, in the investigation of current and potential health impacts of industrial pollution on nearby residents, providing information for future identification of novel personalized health indicators and exposure biomarkers, and establishment of individual risk index.
Keywords: petrochemical industry, exposomics, metabolomics, lipidomics, heavy
metals, polycyclic aromatic hydrocarbons.Table of Contents
中文摘要 ... i
Abstract ... iii
Table of Contents ... vi
List of Figures ... viii
List of Tables ... x
1. Introduction ... 1
1.1 Background ... 1
1.2 Exposomics ... 10
1.3 Metabolomics ... 10
1.4 Lipidomics... 11
1.5 Oxidative stress ... 12
1.6 Serum acylcarnitines ... 12
2. Objectives ... 13
3. Material and Methods ... 14
3.1 Study area and subjects ... 14
3.2 External exposure ... 15
3.3 Internal exposure ... 16
3.4 Metabolomics ... 16
3.4.1 Urine metabolomics ... 16
3.4.2 Serum metabolomics ... 19
3.4.3 Serum lipidomics... 21
3.5 Early health effects ... 22
3.5.1 Oxidative stress ... 22
3.5.2 Serum acylcarnitines ... 23
3.6 Pathway analysis ... 24
3.7 Meet-in-the-middle ... 24
vii
3.8 Association between exposure and early health effects ... 25
3.9 Statistical analysis ... 26
4. Results and Discussion ... 27
4.1 Part 1. Linking sources to early effects by profiling urine metabolome of residents living near oil refineries and coal-fired power plants ... 27
4.1.1 Results... 27
4.1.2 Discussion ... 44
4.2 Part 2. Metabolomics of Children and Adolescents Exposed to Industrial Carcinogenic Pollutants ... 50
4.2.1 Results... 50
4.2.2 Discussion ... 63
4.3 Part 3. Lipidomics of Children and Adolescents Exposed to Industrial Pollutants. .. 67
4.3.1 Results... 67
4.3.2 Discussion ... 83
5. Conclusion and Recommendation ... 85
6. References ... 86 7. Appendix ... I
7.1 Appendix 1: Urine metabolite profiles in children and elderly participants and the association with multiple exposures and oxidative stress. ... I 7.2 Appendix 2: Identified potential metabolite features in serum sample of 107 subjects using metabolomics. ... XIV 7.3 Appendix 3: Identified potential lipid species in serum sample of 107 subjects using lipidomics. ... XVII
List of Figures
Figure 1. Study framework ... 13 Figure 2. GIS map of (A) Yunlin County in central Taiwan and (B) location of study
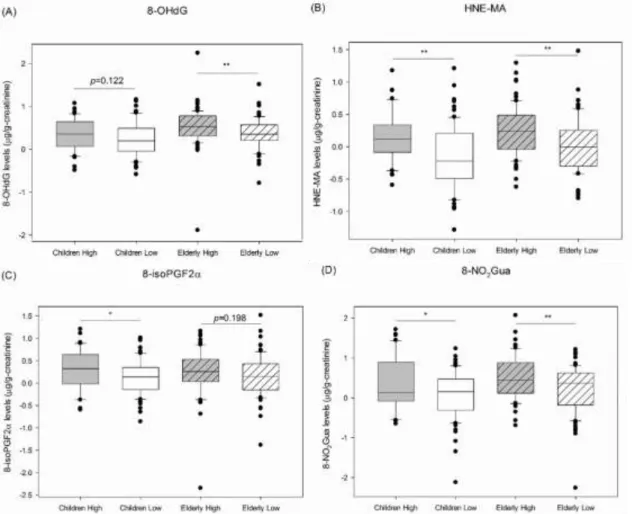
area, petrochemical plants, and 273 study subjects’ homes ... 15 Figure 3. Flowchart of urine metabolomics analysis ... 19 Figure 4. Meet-in-the-middle approach. ... 25 Figure 5. Urine concentrations of (A) oxidative DNA damage biomarker 8-OHDG
(B)(C) lipid peroxidation biomarkers HNE-MA and 8-isoPGF2α and (D) nitrative DNA damage biomarker 8-NO2Gua levels between high and low exposure groups in children and elderly study subjects. ... 32 Figure 6. PLS-DA results for children and elderly urine metabolite profile analysis
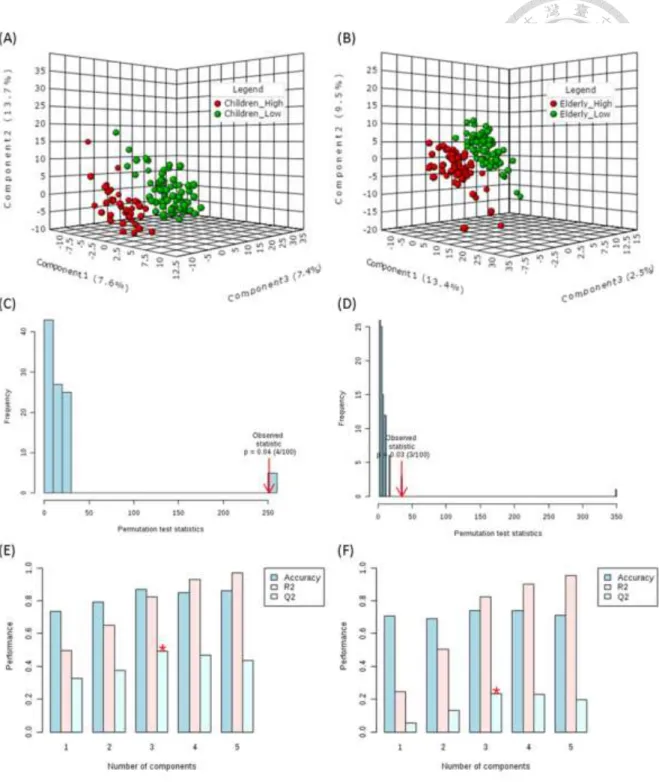
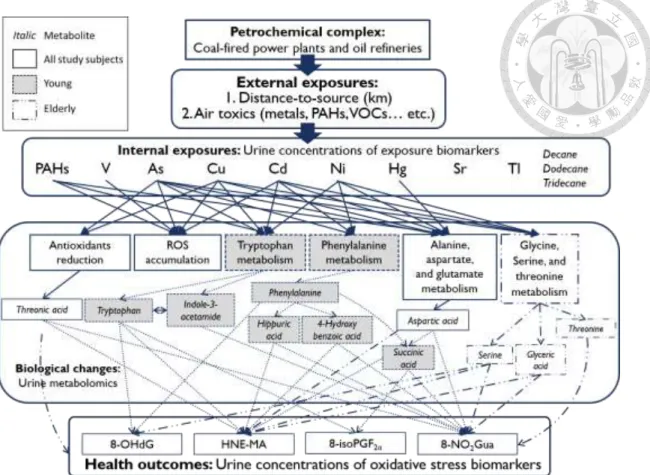
shown as (A)(B) PLS-DA score plots, (C)(D) permutation test results, and (E)(F) cross validation results. ... 34 Figure 7. Exposure pathways of petrochemical air pollution and the effects on urine
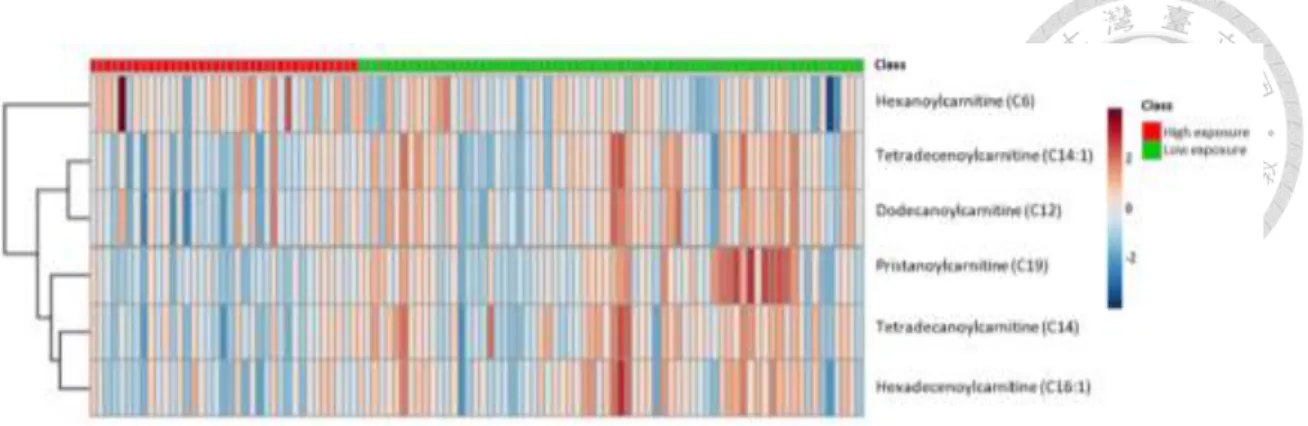
metabolic profile changes and increased oxidative stress ... 41 Figure 8. Heat map of serum acylcarnitine levels in 107 study subjects... 54 Figure 9. Principle component analysis score plot of 61 pooled quality control (QC)
samples data from 11 batches detected under (A) negative mode and (B) positive mode of UHPLC-qTOFMS metabolomics analysis ... 56 Figure 10. Comparison of serum metabolic profile in 107 study subjects using (A) PLS-
DA score plot (Accuracy=0.78, R2=0.53, Q2=0.23, Permutation p=0.01) and (B) heat map of exposure-related potential metabolite levels (average VIP score >1, ANOVA p <0.05 are shown adjusted for sex, age, and BMI) ... 56 Figure 11. Combined associations between internal exposure levels and (A) 8-OHDG
(p=0.002), (B) HNE-MA (p=0.0006), (C) 8-isoPF2α (p= 0.08), and (D) 8- NO2Gua (p=0.0001) levels based on weighted quantile sum (WQS) regression analysis in 99 study subjects. (Adjusted for sex, age, and BMI) ... 59 Figure 12. Principle component analysis score plot of 61 pooled quality control (QC)
samples data from 13 batches detected using UHPLC-qTOFMS analysis ... 69 Figure 13. Heat map of serum acylcarnitine levels in 99 study subjects... 72
ix
Figure 14. Comparison of serum lipid profile in 99 study subjects using (A) PLS-DA score plot (Accuracy=0.85, R2=0.66, Q2=0.42, Permutation test p <0.01) and (B) heat map of exposure-related potential metabolite levels (average VIP score >1, ANOVA p <0.05 are shown adjusted for sex, age, and BMI). ... 74 Figure 15. Combined associations between internal exposure levels and (A) 8-OHDG
(p=0.009), (B) HNE-MA (p=0.0005), (C) 8-isoPF2α (p= 0.1022), and (D) 8- NO2Gua (p=0.00008) levels based on weighted quantile sum (WQS)
regression analysis in 97 study subjects. ... 77
List of Tables
Table 1. Studies on the Environmental and Health Impacts of No. 6 Naphtha Cracking Complex ... 9 Table 2. Comparison of basic characteristics and exposure levels in 252 study subjects
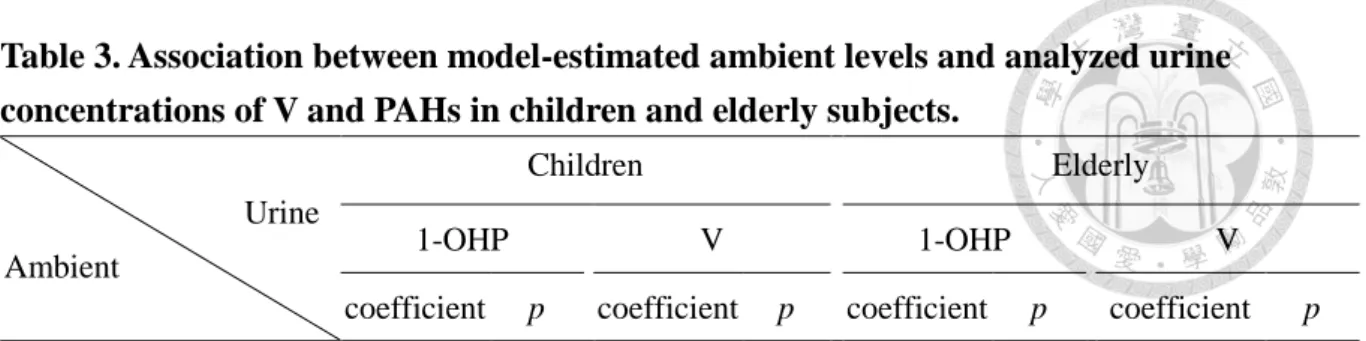
... 29 Table 3. Association between model-estimated ambient levels and analyzed urine
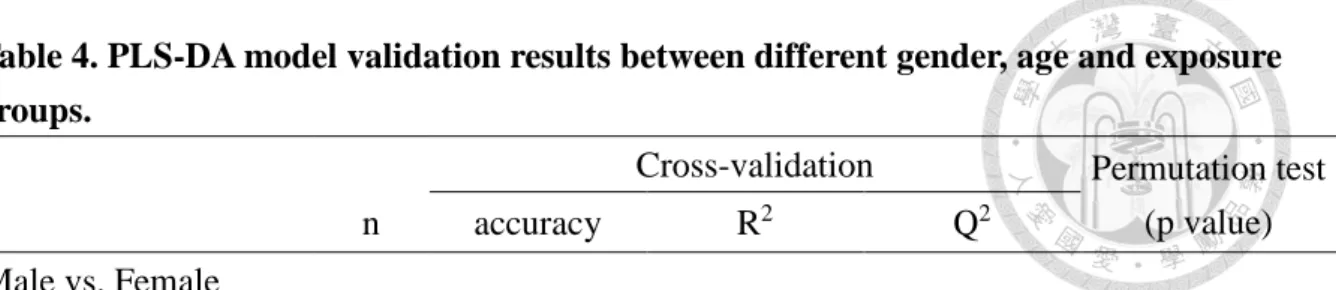
concentrations of V and PAHs in children and elderly subjects. ... 31 Table 4. PLS-DA model validation results between different gender, age and exposure
groups. ... 35 Table 5. Urine metabolic profiling of multiple exposures from refineries and coal-fired
power plants in children and elderly subjects using GCxGC-TOFMS analysis ... 36 Table 6. Potential biological pathways affected by multiple exposures in children and
elderly subjects. ... 40 Table 7. Putative intermediate biomarkers associated with both exposure and oxidative
stress identified in children and elderly subjects. ... 43 Table 8. Comparison of basic characteristics, carcinogens exposure levels, and oxidative stress biomarker levels in 107 study subjects. ... 52 Table 9. Individual association between urine carcinogens and oxidative stress
biomarkers in 99 study subjects. ... 58 Table 10. Association between exposure-related potential metabolites and oxidative
stress biomarkers in 99 study subjects ... 61 Table 11. Association between exposure-related potential metabolites and oxidative
stress biomarkers in 107 study subjects ... 62 Table 12. Comparison of basic characteristics, exposure levels, and oxidative stress
biomarker levels in 99 study subjects. ... 70 Table 13. Individual association between urine exposure biomarkers and oxidative stress biomarkers in 97 study subjects. ... 76 Table 14. Association between exposure-related potential lipids and oxidative stress
biomarkers in 97 study subjects ... 79 Table 15. Association between exposure-related potential lipids and acylcarnitines in 99
study subjects ... 81
1
1. Introduction
1.1 Background
Petrochemical industrial complex is a consortium of high-pollution facilities such as oil refineries and coal-fired power plants. These facilities emit multiple pollutants including sulfur oxides (SOx), nitrogen oxides (NOx), carbon dioxide (CO2), carbon monoxide (CO), volatile organic compounds (VOCs), polycyclic aromatic hydrocarbons (PAHs), and heavy metals arsenic (As), cadmium (Cd), chromium (Cr), nickel (Ni), vanadium (V), mercury (Hg), lead (Pb), manganese (Mn), copper (Cu), strontium (Sr), and thallium (Tl) (Chan et al. 2006; Driscoll et al. 2015; George et al. 2015; Hu et al.
2011; Nadal et al. 2004; Nadal et al. 2009). Cumulative exposure to such complex chemical mixtures may have synergistic effects on health, and warrant the use of novel analytical approaches for a comprehensive evaluation (Carpenter et al. 2002).
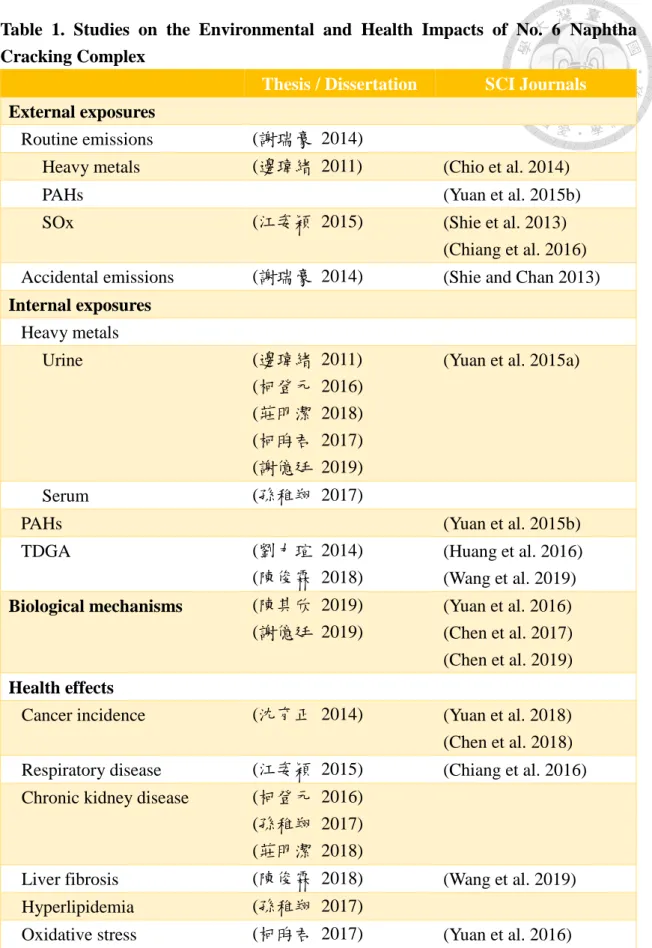
In Taiwan, Chan et al. have conducted for the past ten years, extensive environmental and epidemiological studies near No. 6 Naphtha Cracking Complex, the largest petrochemical complex in Taiwan. To date, Chan et al. have published 15 research articles in SCI journals, 12 master theses and doctoral dissertations, and annual reports documenting the environmental and health impacts of No. 6 Naphtha Cracking Complex on surrounding areas and residents (Table 1).
Environmental studies found significant increase of ambient pollutants within 10 km radius of the complex, including NOx, SOx, VOCs such as ethylene, propylene, propane, butane, and benzene, PAHs such as anthracene, chrysene, fluoranthene, phenanthrene, and pyrene, vinyl chloride monomers (VCM), and metals (詹長權 2010, 2011, 2012, 2013). For his doctoral dissertation, Shie did a comprehensive study of air toxics pollution in areas surrounding No. 6 Naphtha Cracking Complex from accidental and routine
emissions (謝瑞豪 2014). In 2011, he deployed a variety of air-monitoring instruments to evaluate the air toxin levels inside and downwind of No. 6 Naphtha Cracking Complex before and during a fire at the complex caused by a liquefied petroleum gas fuel leak.
They found high levels of combustion-related gaseous and particulate pollutants inside the complex and 10 km downwind for at least two days after the fire, demonstrating that a timely and comprehensive air monitoring is essential for tracing air pollution from industrial accidents (Shie and Chan 2013). Shie also used pollution rose to assess the level of SO2 in townships downwind to the complex in preoperational period (1995–1999) and two postoperational periods (2000–2004 and 2005–2009), and showed that in the postoperational periods, hourly SO2 levels exceeded the U.S. Environmental Protection Agency (EPA) health-based standard of 75 ppb (Shie et al. 2013). Pien established the protocols for analyzing heavy metals in particulate matters collected near No. 6 Naphtha Cracking Complex using Harvard Impactor, and in urine samples of residents living near the complex for her master thesis (邊瑋緒 2011). This methodology was later applied by Chio et al. to construct a two-stage dispersion model to assess the ambient concentrations of V and As in the vicinity of the complex, and by Yuan et al. to confirm association between model-estimated ambient V at home locations and individual urine concentrations of V in residents living near the complex (Chio et al. 2014; Yuan et al.
2015a). Yuan et al. established a kriging model to assess the ambient concentration of 16 PAHs surrounding the complex in 2015, and found significant association between estimated ambient levels of five PAHs including pyrene, benzo[a]anthracene, benzo[k]fluoranthene, fluoranthene, and dibenzo[a,h]anthracene, at home addresses and individual urinary concentrations of 1-hydroxypyrene (1-OHP) in residents living near the complex (Yuan et al. 2015b). These studies established urinary V and 1-OHP as exposure biomarkers for petrochemical industrial pollution within this area.
3
In order to examine the health impact of petrochemical industrialization, Chen et al.
compared life expectancies and personal income between Yunlin County where No. 6 Naphtha Cracking Complex is located, and one reference county (Yilan County) which had no significant industrial activities, using data spanning 11 years before and after the complex began operations in 1999. Their findings showed Yunlin residents had lesser increases in life expectancy over time than Yilan residents, with male residents more vulnerable to the effects of industrialization, and no significant differences in individual income between the two counties (Chen et al. 2014).
Epidemiology studies were also conducted to further investigate the health impact of petrochemical industrial pollution on nearby residents, including chronic diseases such as cancer, chronic kidney disease, and hyperlipidemia, acute disease such as allergic diseases, asthma, and bronchitis, and subclinical abnormalities such as liver fibrosis. For his master thesis, Shen used primary data of demographic information, risk factors, biomarkers, and biochemical indices to investigate the adverse health effects, and secondary data of Taiwan Health Insurance Database (Registry for Catastrophic Illness Database) to retrospectively investigate the incidence of all cancers (ICD-9: 140-165, 170-176, 179- 208) in 2,388 adults aged > 35 years at the time of recruitment (2009-2012), and aged >
20 years when the complex began operations in mid-1999, who have lived in Yunlin County for more than five years (沈育正 2014). Yuan et al. applied his methodology, and geographically classified the 2,388 participants into high exposure group (HE, lived in Mailiao and Taisi Townships, < 10 km from the complex), and low exposure group (LE, lived in Baojhong, Shihhu, Dongshih, Lunbei, Erlun, Citong, Yuanchang, and Huwei Townships, > 10 km from the complex). Temporally, Yuan et al. divided the 12 years participants lived near the complex since the operation of complex began with reported emissions of VOCs into the first period 1999-2007 (0-9 years after operation began) and
the second period 2008-2010 (10-12 years after operation began). Their results showed higher urine levels of carcinogens As, Cd, Hg, Pb, V, and PAHs biomarker 1-OHP at HE compared to LE, with Pb and V urine levels exceeding normal range, and significantly higher body mass index (BMI) and hepatitis C prevalence. Long-term SO2 pollution levels were also significantly higher in HE than LE areas. Significant exposure area effect on elevating the relative risks (RRs) of the all cancer crude cumulative incidence rates (CIRs) were found for elder subjects (1.52; 1.04-2.22), female subjects (1.41; 1.00-1.97), and elder female subjects (1.91; 1.15-3.19) after the complex had operated for 10-12 years (Yuan et al. 2018). Chen et al. conducted a similar study in Changhua County which is north of the complex, with 1,934 adult participants (aged > 20) recruited in 2014-2016 who have lived in this area for more than five years, geographically divided into three study zones: Taisi Village (average 5.5 km from complex), Dacheng Township (average 9.2 km from complex), and Zhutang Township (average 19.9 km from complex), comparing all cause cancer incidence rate (ICD-9: 140-208), and urine exposure biomarkers. Results showed urine levels of carcinogenic pollutants As, Cd, Cr, Ni, and V, as well as other pollutants Mn, Cu, and Tl were significantly higher for participants in Taisi Village compared to the other two study zones. Temporal increase for all cause cancer incidence rates (IRs) were found in all three study zones when comparing 1999- 2007 period (0-9 years after operation began) to 2008-2014 period (10-16 years after operation began), with the highest crude incidence rate ratios (IRRs) in Taisi Village compared to the other two study zones. All cause cancer IRRs were higher for Taisi Village compared with the other two study zones for all subjects and male subjects, and higher for Taisi Villange than Dacheng Township for female subjects, after the complex had operated for 10-16 years, with hepatitis C and age significantly associated with higher all cause cancer IRRs (Chen et al. 2018).
5
In addition to cancer, for his master thesis Ke analyzed 2,069 adult residents from the same epidemiology cohort that Shen used from Yunlin County, for urinary exposure biomarkers and the association with estimated glomerular filtration rate (eGFR) and chronic kidney disease (CKD). He found that decreased eGFR and increased odds ratio of CKD were associated with decreased distance from home address to complex, and increased levels of urine As ( 柯 登 元 2016). Jhuang conducted a similar study in Dacheng Township of Changhua County with 1,374 adult participants recruited from 2014-2016 for her master thesis. Her findings confirmed the association between decreased eGFR and increased risk of CKD with decreased distance from home location to complex, with increased urinary levels of Ni and Cr associated with decreased eGFR and increased risk of CKDs ( 莊 明 潔 2018). Shun’s master thesis discussed the association between serum heavy metals levels and hyperlipidemia and CKD in 1,000 Yunlin adult residents aged > 35 years from the same cohort as Shen and Ke. Her findings showed significant and positive association between serum Cr, As, and Hg with total cholesterol levels, serum Hg with low-density lipoprotein cholesterol levels (LDL-C), and serum As and Hg with risk of hyperlipidemia. She also found association between increased serum As, Cr, and Tl with decreased eGFR, and increased serum As and Cr with increased risk of CKD (孫稚翔 2017).
Epidemiology studies were also conducted in children and adolescents who lived near the complex during critical periods of biological development. Liu established for her master thesis, an analytical method for exposure biomarker urinary thiodiglycolic acid (TDGA), a major metabolite of VCM, and used this method to analyze urine samples from 268 schoolchildren recruited from four elementary schools in Mailiao Township of Yunlin County. She found children attending an elementary school less than 1 km from the VCM/polyvinylchloride (PVC) plants within the complex had higher urine
concentration of TDGA than children attending schools further away, and their urine levels of TDGA significantly reduced during summer vacation (劉力瑄 2014). These findings were later published and gained media attention, which eventually led to a temporary relocation of the children to another school further away from the complex (Huang et al. 2016). In 2018, Wang et al. found association between urine TDGA levels and subclinical abnormal levels of hepatic fibrosis indicators serum aspartate aminotransferase (AST) and fibrosis-4 score (FIB-4) in the same group of schoolchildren (Wang et al. 2019). Chen applied a similar study design on 447 adult residents in Dacheng and Zhutang Townships of Changhua County for his master thesis, and found residents living closer to the complex had increased urine levels of TDGA, and significant association between urinary TDGA concentrations and liver fibrosis level indicator FIB- 4 (陳俊霖 2018). For her master thesis, Chiang recruited 587 11-14 year old school children from junior high schools in Yunlin County from 2009 to 2011, who have lived at the same addresses for more than five years, and classified them as high exposure group (HE, lived in Mailiao, Taisi, Donshih Townships) and low exposure group (LE, lived in Erlun, Lunbei, Huwei, Baojhong, Sihhu, and Yuanchang Townships). Her study covered the time from 1999 to 2010, which was further divided into three periods: four years (1999-2002), eight years (1999-2006), and 12 years (1999-2010) after the complex began operations. Health data were obtained from Taiwan Health Insurance Database, choosing outpatient data for allergic rhinitis (ICD-9-CM: 477), bronchitis (ICD-9-CM: 490-491), and asthma (ICD-9-CM: 493). SO2 was used as an indicator of exposure from the complex, using hourly data measured at two air quality monitoring stations set up by the Taiwan Environmental Protection Administration (TEPA) at HE area Taisi Township and LE area Lunbei Township from 1995 to 2010. From 2001, SO2 concentration increased significantly in HE areas, and the three-year average of the 99th percentile of SO2
7
concentration have exceeded U.S. EPA 75 ppb standards since 2003, and continued to do so with increasing concentrations up to 2010. Hazard ratios of children’s allergic rhinitis and bronchitis were significantly higher in HE compared to LE group for all three time periods, while for asthma the difference was only significant in the first time period. Boys had higher risk of developing allergic rhinitis and asthma, and children living near roads had higher risk of developing allergic rhinitis. Her results showed that association between SO2 exposure and acute respiratory effects occurred as early as < 2 years after the complex began operations, and lasted 8 to 12 years (Chiang et al. 2016; 江姿穎 2015). Killian recruited 168 preschool children aged 4-8 from four kindergartens within 13.7 km of the complex for her master thesis, and analyzed their urine concentrations of heavy metals and oxidative stress biomarkers, and at the same time used a food frequency questionnaire to assess individual’s intake of antioxidants. Her findings showed preschool children living closer to the complex had increased urinary levels of As, Cd, Cr, Ni, Pb, Mn, Cu, and Sr which were associated with elevated levels of urinary oxidative stress biomarker 8-hydroxy-2’-deoxyguanosine (8-OHDG). Increased intake of total oxidants resulted in a decrease of urine 8-OHDG that did not reach statistical significance (柯昀 君 2017).
In order to clarify the biological mechanism between industrial pollutants exposure and oxidative stress, Yuan et al. used nuclear magnetic resonance spectroscopy (NMR) to analyze serum metabolites of 160 residents from a prospective cohort in Yunlin County.
They found that exposure to V and PAHs may cause a reduction in amino acids and carbohydrates levels by elevating peroxisome proliferator-activated receptor (PPAR) signaling pathway, insulin signaling, and oxidative/nitrosative stress (Yuan et al. 2016).
In vitro study was also conducted, and results showed that exposure to PM2.5 from No. 6 Naphtha Cracking Complex emissions significantly correlated with reduced cell viability
and increased cytotoxicity-related lactate dehydrogenase, oxidative stress-related 8- isoprostane, and inflammation-related interleukin (IL)-6 (Chuang et al. 2018).
The findings of Chan et al. showed that adult, elderly, and children residents living near No. 6 Naphtha Cracking Complex are exposed to multiple hazardous industrial pollutants from routine and accidental emissions, and have increased risk of chronic and acute adverse health effects. Children and elderly residents may be more susceptible to these industrial pollutants exposure since children have immature physical development, and higher inhalation of air per unit time, and elderly residents may have compromised immune responses and underlying health conditions (Adler 2003; Makri and Stilianakis 2008). The complexity of industrial pollution and health effects on different age groups, with temporal and spatial differences in this industrial community, indicated that traditional models accessing single toxic exposure and disease are not sufficient in evaluating the health status of people living in this area. Comprehensive evaluation of multiple industrial pollutants exposure and the impact on biological mechanisms and pathways that underlie a range of common complex diseases are needed in order to provide information for future risk assessment and development of personal and community interventions. To achieve this, application of novel approaches were required (Juarez et al. 2014).
9
Table 1. Studies on the Environmental and Health Impacts of No. 6 Naphtha Cracking Complex
Thesis / Dissertation SCI Journals External exposures
Routine emissions (謝瑞豪 2014)
Heavy metals (邊瑋緒 2011) (Chio et al. 2014)
PAHs (Yuan et al. 2015b)
SOx (江姿穎 2015) (Shie et al. 2013)
(Chiang et al. 2016) Accidental emissions (謝瑞豪 2014) (Shie and Chan 2013)
Internal exposures
Heavy metals
Urine (邊瑋緒 2011)
(柯登元 2016) (莊明潔 2018) (柯昀君 2017) (謝億廷 2019)
(Yuan et al. 2015a)
Serum (孫稚翔 2017)
PAHs (Yuan et al. 2015b)
TDGA (劉力瑄 2014)
(陳俊霖 2018)
(Huang et al. 2016) (Wang et al. 2019)
Biological mechanisms
(陳其欣 2019)(謝億廷 2019)
(Yuan et al. 2016) (Chen et al. 2017) (Chen et al. 2019)
Health effects
Cancer incidence (沈育正 2014) (Yuan et al. 2018) (Chen et al. 2018) Respiratory disease (江姿穎 2015) (Chiang et al. 2016) Chronic kidney disease (柯登元 2016)
(孫稚翔 2017) (莊明潔 2018)
Liver fibrosis (陳俊霖 2018) (Wang et al. 2019)
Hyperlipidemia (孫稚翔 2017)
Oxidative stress (柯昀君 2017)
(陳其欣 2019)
(Yuan et al. 2016) (Chen et al. 2017) (Chen et al. 2019)
In vitro study
(Chuang et al. 2018)1.2 Exposomics
Exposomics has become the leading methodology for assessing health impacts of multiple environmental exposures in environmental health studies. The concept of the exposome was first proposed by Wild in 2005, and characterized as the comprehensive evaluation of all exposures and their contribution to disease causation or progression by Rappaport and Smith (Rappaport and Smith 2010; Wild 2005). A branching paradigm, the public health exposome, focuses on the impact of exposures on the overall health of a population within a particular region, with the intention of identifying vulnerable populations with higher risks of chronic illnesses (Juarez et al. 2014; Smith et al. 2015).
The use of omics methods such as transcriptomics, proteomics, and metabolomics have been recommended in exposomics studies to identify the links between exposures and health outcomes, understand the mechanisms of disease development and progression, and potentially developing new biomarkers for exposure and early health effects (Vineis et al. 2013; Wild 2009).
1.3 Metabolomics
Recently, metabolomics was proposed to quantitatively measure exogenous chemicals and biological responses in order to provide “a snapshot measure of an individual’s exposome” (Pennell 2016). Chadeau-Hyam et al. also proposed using metabolomics to identify “intermediate biomarkers” that could connect exposure with early health effects using the “meet-in-the-middle” approach (Chadeau-Hyam et al. 2011).
Metabolites are the endpoint of biochemical activities and the metabolome could best reflect the effects of exposures and correlate with phenotype, since it is more sensitive to perturbations than transcriptome and proteome (Kell et al. 2005; Patti et al. 2012). Due to the complex chemical properties of metabolites, it is not possible to use one single
11
analytical platform to assess the complete metabolome within one biospeciman (Blow 2008). Gas chromatography (GC) -based methods detect metabolites that are of lower molecular weight and relatively polar metabolite classes, while liquid chromatography (LC) -based methods can be used to detect metabolites with higher molecular weight and medium-to-high lipophilicity (Dunn et al. 2011). Bouatra et al. and Psychogios et al.
applied multiple metabolomics platforms including NMR, GC-MS, and LC-MS to assess urine and serum samples, respectively, and found relatively small overlaps in the metabolite profiles identified using different platforms and biospecimen (Bouatra et al.
2013; Psychogios et al. 2011). Urine and blood samples are most often used in metabolomics studies since the collection is relatively less invasive compared to other biological samples, and are integrative biofluids that reflect functions and phenotypes from different parts of the body (Dunn et al. 2011). So far metabolomics have been applied in pharmacology, clinical disease diagnosis, nutritional, and environmental studies (Robertson et al. 2011). However, most environmental metabolomics studies have focused on the assessment of single exposure (Ellis et al. 2012).
1.4 Lipidomics
Lipidomics is considered a sub-discipline of metabolomics that focuses on systemic analysis of lipids and their interacting partners (Wenk 2005). Deregulation of lipid profiles have been associated with disease onset and progression, and is often applied in clinical studies in search for novel biomarkers or understanding pathological mechanisms in diseases such as cancer, liver diseases, cardiovascular disease, diabetes, kidney diseases, and Alzheimer’s disease (Stegemann et al. 2014; Yang et al. 2016; Zhao et al.
2015). When lipidomics approach was applied in exposure studies, most were based on animal models and focused on single toxic exposure (Chi et al. 2019; Hu et al. 2018; Li
et al. 2019).
1.5 Oxidative stress
Oxidative stress is an imbalance between production of free radicals, reactive oxygen species (ROS), and nitrogen reactive species (RNS), and their reduction by protective antioxidants. Accumulation of this imbalance can invoke early health effects such as inflammation, lipid peroxidation, and DNA damage. Oxidative stress is prevalent in CKD patients, elevated in hyperlipidemia patients, contributes to liver fibrosis, and mediates allergic respiratory diseases (Bowler and Crapo 2002; Hopps et al. 2010; Poli 2000; Xu et al. 2015). Oxidative stress also interacts with all three stages of cancer process: cancer initiation, cancer promotion, and cancer progression through ROS and RNS induced DNA damage, lipid peroxidation, and protein damage (Reuter et al. 2010; Valavanidis et al.
2009).
1.6 Serum acylcarnitines
Serum acylcarnitines are involved in transporting fatty acids into the mitochondria for β-oxidation and production of energy (Semba et al. 2017). Deregulations in serum acylcarnitines can activate inflammatory signaling pathways, and have been associated with chronic diseases including cancer, cardiovascular diseases, CKD, and Alzheimer’s disease (Fouque et al. 2006; Ruiz-Canela et al. 2017; Rutkowsky et al. 2014; Toledo et al.
2017; Zhou et al. 2012b).
13
2. Objectives
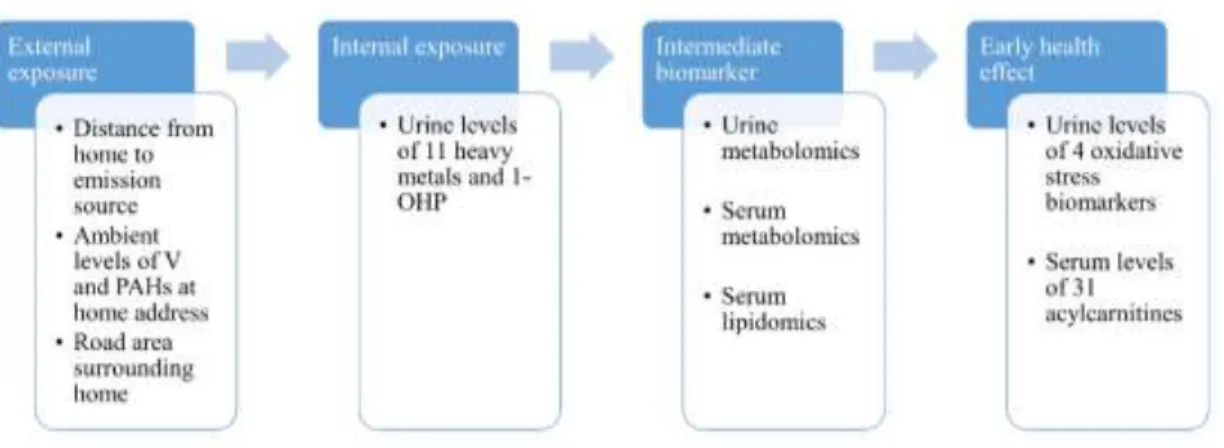
Figure 1 shows the study framework for this thesis, and our objectives are to:
1. Establish comprehensive urine and serum metabolite profiles of children and elderly residents living near No. 6 Naphtha Cracking Complex.
2. Identify deregulations in biological mechanism associated with exposure to multiple industrial pollutants.
3. Use metabolomics to find the link connecting multiple industrial pollutants exposures with early health effect.
Figure 1. Study framework
3. Material and Methods
3.1 Study area and subjects
Our study area surrounded the largest petrochemical complex in Taiwan, No. 6 Naphtha Cracking Complex, located in Yunlin County on the west coast of central Taiwan.
The complex began major operations in 1999. To date, the complex covers a total area of 2603 ha, housing 64 plants including one coal-fired power plant that generates 1800 MW of power, three oil refiner plants that processes 450,000 barrels of crude oil every day, two naphtha cracking plants that produces 160 million tons of ethylene per year, and three cogeneration plants that generates 2820 MW of power. Our subjects were selected from a prospective cohort of 3,230 residents who have lived in three townships in close vicinity to the complex (pink) and seven other townships further away (yellow) as shown in Figure 2 for more than five years. All 3,230 subjects (aged 5–88) have completed interview- administered questionnaire surveys including key factors related to exposure, provided one morning spot urine sample, and one fasting blood sample. Urine samples were stored at -20 oC, serum samples were extracted from coagulated blood samples using centrifuge and stored at -80 oC. All 3,230 participants’ urine samples have been analyzed for As, Cd, Cr, Ni, Pb, Hg, V, Mn, Cu, Sr, Tl, and 1-OHP. We used urine concentrations of V and 1- OHP as well as residential address to identify 257 cohort members who lived in the three townships closest to the complex, with urine concentrations previously established petrochemical industrial exposure biomarkers V and 1-OHP in the top 60 % of the 3,230 residents as high exposure group, and another 337 cohort members who lived in townships further away, with urine concentrations of V and 1-OHP in bottom 40 % of the cohort as low exposure group. We then randomly select 43 children (aged 9–15) and 77 elderly (aged > 55) subjects from the 257 cohort members as our high exposure subjects,
15
and 75 children and 78 elderly participants from the 337 cohort members as our low exposure subjects. This study was approved by the Research Ethics Committee of National Taiwan University Hospital, and informed consent was obtained from each participant.
Figure 2. GIS map of (A) Yunlin County in central Taiwan and (B) location of study area, petrochemical plants, and 273 study subjects’ homes
3.2 External exposure
Geographic coordinates for all 273 participant's home address were determined, and geological information system (GIS) software (ArcGIS version 10.1) was used to calculate the distances from each home address to previously identified main emission points of coal-fired power plant and oil refineries, respectively. GIS software was also used to measure road area surrounding homes, in order to estimate traffic contribution on air toxics levels. Ambient concentrations of V and five PAHs including pyrene, fluoranthene, dibenzo[a,h]anthracene, benzo[k]fluoranthene, and benzo[a]anthracene were calculated using previously established two-stage dispersion model and kriging method model, respectively (Chio et al. 2014; Yuan et al. 2015b).
3.3 Internal exposure
All 273 participants’ urine samples had been analyzed for heavy metals and 1-OHP.
Urine concentrations of heavy metals As, Cd, Cr, Ni, Pb, Hg, V, Mn, Cu, Sr, and Tl were analyzed using previously reported inductively coupled plasma mass spectrometry (ICP- MS) method, and 1-OHP was analyzed using previously reported high performance liquid chromatography (HPLC) method. For heavy metals, spikes were examined to confirm measurement stability, and standard reference materials (SRM) for each metal were analyzed to assess accuracy. For 1-OHP analysis, detection limit was 0.01 ng/mL with an 89.6 % recovery rate and a 4.0 % coefficient of variation for repeated measurements.
Urine concentration of exposure biomarkers below the method detection limit (MDL) was replaced by half of the MDL. Urinary creatinine analysis was conducted using enzyme- linked immunosorbent assay at National Taiwan University Hospital medical diagnosis laboratory and used for adjustment of urinary exposure biomarker levels.
3.4 Metabolomics
3.4.1 Urine metabolomics
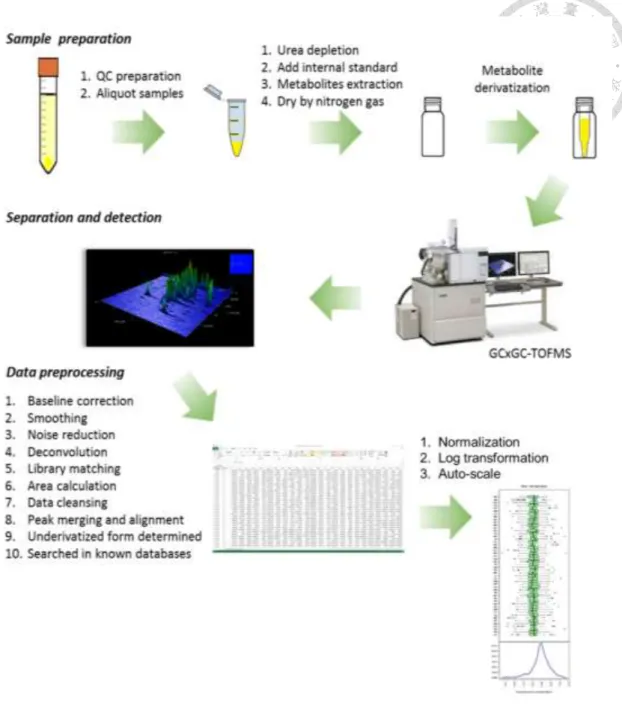
252 participants had urine samples available for urine metabolomics analysis.
Samples were prepared and analyzed following protocols derived from previous publications, using a Pegasus 4D GC × GC − TOFMS (LecoCorp., St. Joseph, MI, USA) for analysis (Figure 3) (Chan et al. 2011; Pasikanti et al. 2013). Briefly, 200 μL urine sample was centrifuged at 12,000 rpm for 10 min at 4 oC. 50 μL supernatant was then transferred to a new Eppendorf tube. 10 μL urease (30 unit/10 μL) was added, vortexed thoroughly, and incubated at 37 oC for 1 hr. Internal standards 10 μL heptadecanoic acid (1 mg/mL) and 10 μL 2-chlorophenylalanine (0.3 mg/mL) were added to the mixture. 620
17
μL methanol was then added, vortexed for 1 min, then centrifuge at 12,000 rpm, 4 oC for 5 min. 550 μL supernatant was then transferred to a glass vial and dried using nitrogen gas. Derivatization steps involved adding 80 μL derivatization agent methoxyamine (15 mg/mL) to the dried sample and incubate at 60 oC for 2 hr for methoximation. Another derivatization agent was added for trimethylsililation, 80 μL N,O- Bis(trimethylsilyl)trifluoroacetamide (BSTFA), and the mixture incubated at 70 oC for 1hr. Derivatized sample was then centrifuged at 6,000 rpm for 3 min, then 100 μL supernatant was transferred to a glass insert, ready for GC analysis. Chromatographic separations were performed using a 30 m×250 μm (i.d.)×0.25 μm RXI-5 column fused together with a 2 m×180 μm (i.d.)×0.2 μm RTX-200 column as primary and secondary columns, respectively (RestekCorp., Bellefonte, PA, USA). Carrier gas was helium, at 1.5 mL/min constant flow rate. Primary oven temperature program began at 70 oC for 0.2 min, and increased at 5 oC/min to 270 oC where it was held for 7.5 min. Secondary oven temperature was maintained at 10 oC higher than the primary oven throughout the program. Thermal modulator was set at 20 oC higher than the primary oven. Modulation time was set at 4 sec with hot pulse of 0.8 sec and 1.2 sec cool time between stages. The inlet, transfer line, and ion source temperatures were set at 220, 200, and 250 oC, respectively. The mass spectrometer source was operated in EI mode with an electron energy of 70 eV at the detector voltage of 1450 V. Data was acquired over the range of m/z 40-600 at an acquisition rate of 100 Hz. For quality control (QC), blanks and pooled QC samples were analyzed at the beginning of each batch, and every five samples within batch. After data cleaning and preprocessing, acquired data were outputted as peak area for NIST library (version 08, National Institute of Standards and Technology, Gaithersburg, MD, USA) identified potential metabolite peaks, and we selected those with mass spectrum matched library spectrum for > 60 % (similarity score > 600 out of
1000). Obtained potential metabolite features were preprocessed by removing those with
> 50 % missing values, and replacing the missing values of the remaining features with half of the minimum positive value in the original data. Preprocessed data were normalized by sum of total peak area, log transformed, and autoscaled (mean-centered and divided by the standard deviation of each variable) prior to further statistical analysis.
NIST library match showed the derivatized form of potential metabolite peaks, which we converted to underivatized forms by replacing methoxyamine and trimethylsilyl groups with carbonyl and hydroxyl functional groups, respectively. ChemSpider was used for the identification of the underivatized forms of potential metabolite peaks (Royal Society of Chemistry, London, UK). All potential metabolites peaks were then put through an online repository (http://cts.fiehnlab.ucdavis.edu/) and searched under three online databases:
the Human Metabolome Database (HMDB) (Wishart et al. 2018), Kyoto Encyclopedia of Genes and Genomes (KEGG) (Kanehisa et al. 2014), and Chemical Entities of Biological Interest (ChEBI) (Hastings et al. 2013), for identification of known metabolites, chemical class, and involved biological pathways.
19
Figure 3. Flowchart of urine metabolomics analysis
3.4.2 Serum metabolomics
252 participants had serum samples available for serum metabolomics analysis.
Serum metabolomics analysis was conducted by The Metabolomics Core Laboratory, Center of Genomic Medicine, National Taiwan University. Sample preparation and analytical method using Agilent 1290 UHPLC system coupled with 6540-QTOF
(UHPLC-QTOF) (Agilent Technologies, Santa Clara, CA, USA) were performed following previously reported protocols (Lai et al. 2015). Aliquots of 100 μL of serum samples were added to extraction solvents by the ratio of 1:4 and extracted using Geno Grinder 2010 (SPEX, Pittsburg, CA, USA) at 1000 rpm for 2 min. Extracts were centrifuged at 15000 g for 5 min at 4 °C. Supernatant was then collected and evaporated using centrifugal vaporizer (EYELA, Tokyo, Japan) for 2 h. Residue was reconstituted in 200 μL of 50% methanol and centrifuged at 15000 g for 5 min, and filtered with 0.2 μm Minisart RC 4 filter (Sartorius, Goettingen, Germany) before analysis. A total of 2 μL of sample was injected into an ACQUITY UPLC HSS T3 column (2.1 × 100 mm; 1.8 μm) (Waters, Milford, MA, USA). The mobile phase was composed of solvent A (water/0.1%
formic acid) and solvent B (acetonitrile/0.1% formic acid). Gradient profile used was 0−1.5 min, 2% B; 1.5−9 min, linear gradient from 2 to 50% B; 9−14 min, linear gradient from 50% to 95% B; 14−15 min, 95% B; the column was then re-equilibrated. Flow rate was maintained at 0.3 mL/min. Column oven and auto-injection system temperatures were set at 40 °C and 10 °C, respectively. Jet Stream electrospray ion source with capillary voltage of 4 kV in positive mode and 3.5 kV in negative mode was used for sample ionization. For MS parameters, dry gas temperature, 325 °C; dry gas flow, 5 L/min;
nebulizer, 40 psi; sheath gas temperature, 325 °C; sheath gas flow, 10 L/min; and fragmentor, 120 V were used. Scan range was set at m/z 50−1700. For QC, blanks and pooled QC samples were analyzed at the beginning of each batch, and every five samples within batch. Synthetic samples containing 40 chemical standards (QC standard) were analyzed at the beginning of each batch to check instrument performance. Three repeated analysis was performed for each sample and total ion chromatogram was manually checked for technical replicates. Acquired data was preprocessed using True Ion Pick (TIPick) algorithm for background subtraction and peak picking (Ho et al. 2013). Peak
21
identification was conducted by matching m/z to an established in-house database: the National Taiwan University MetaCore Metabolomics Chemical Standard Library.
Obtained potential metabolite features were preprocessed by removing those with > 50%
missing values, and replacing the missing values of the remaining features with half of the minimum positive value in the original data. Preprocessed data were normalized by sum of total peak area, log transformed, and autoscaled (mean-centered and divided by the standard deviation of each variable) prior to further statistical analysis.
3.4.3 Serum lipidomics
252 participants had serum samples available for serum lipidomics analysis. Serum lipidomics analysis was conducted by The Metabolomics Core Laboratory, Center of Genomic Medicine, National Taiwan University. Lipidomic profiling for seurm samples was performed using an Agilent 1290 UHPLC system coupled with a Bruker maXis impact QTOF (Bruker Daltonik, Bremen, Germany). 100 uL of serum sample was mixed with 100 uL water and 1000 uL methanol/chloroform (1:2) for extraction. After shaking at 1000 rpm for 5 minutes by using Geno/Grinder 2010 (SPEX SamplePrep., Metuchen, NJ, US), the extract was centrifuged by using Eppendorf Centrifuge 5810R at 15000 rcf for 5 minutes at 4 °C. 600 ul of the lower organic layer was taken to another eppendorf tube for dryness by nitrogen. Dried residues were reconstituted in 120 uL methanol, sonicated 10 minutes and centrifuged at 15000 rcf for 5 minutes at 4 °C. The supernatant were filtered through a 0.2 μm Minisart RC 4 filter (Sartorius Stedim Biotech GmbH, Goettingen, Germany) and subjected to LC-MS/MS analysis. 2 μL of sample from serum extract was injected into an Agilent ZORBAX Eclipse Plus C18 column (2.1 x 100 mm, 1.8μm, Agilent Technologies, Santa Clara, CA); the analytical column was maintained at 55 °C. The mobile phase was composed of solvent A (water/10 mM ammonium
acetate/0.1% formic acid) and solvent B (methanol: isopropanol: water = 60: 40: 1/10 mM ammonium acetate/0.1% formic acid). The gradient elution program was as follows:
0–2 min: linear gradient from 35 to 80% B; 2–7 min: linear gradient from 80 to 100% B;
and 10 min maintenance in 100% B. The flow rate was 350 μL min-1. For ionization, an electrospray ionization source was used for sample ionization. The following parameters were used throughout the study: 180 °C dry gas temperature, 8 L min-1 dry gas flow, 2.0 bar nebulizer, 500 V end plate offset, 4500 V in positive mode for capillary voltage. The mass scan range and acquisition rate were m/z 150–1600 and 2 Hz, respectively. PITracer algorithm was applied for data format conversion, relative mass difference estimation, chromatogram generation, and peak detection (Wang et al. 2015). Peak identification was performed by matching m/z to an established in-house database: the National Taiwan University MetaCore In-House Lipidomics Library. Preprocessed data were normalized by sum of total peak area, log transformed, and autoscaled (mean-centered and divided by the standard deviation of each variable) prior to further statistical analysis.
3.5 Early health effects
3.5.1 Oxidative stress
252 participants had urine samples available for urine oxidative stress biomarkers analysis. Urine concentrations of four oxidative stress biomarkers 8-hydroxy-2’- deoxyguanosine (8-OHDG), 4-hydroxy-2-nonenal-mercapturic acid (HNE-MA), 8- isoprostaglandin F2α (8-isoPF2α), and 8-nitroguanine (8-NO2Gua) were analyzed using previously published methods and adjusted with urinary creatinine concentrations (Wu et al. 2016). QC was conducted following European Medicines Agency guidelines (EMA 2011). The four oxidative stress biomarkers applied in this study represent the different effects of oxidative stress, and all four biomarkers participate in the process of
23
carcinogenesis. 8-OHDG is the most used biomarker for free radical induced DNA damage and has been reported as a good biomarker for risk assessment of cancer (Valavanidis et al. 2009). HNE-MA is a metabolite of lipid peroxidation product 4- hydroxy-2-nonenal (HNE), a cytotoxic and mutagenic signaling molecule that regulates cell cycle and forms DNA adducts leading to DNA damage (Ayala et al. 2014; Bartsch and Nair 2005; Valavanidis et al. 2009). Urine levels of 8-isoPF2α is a biomarker for arachidonic acid peroxidation, and has been associated with increased risk of potential malignant oral disorders and breast cancer progression (Ferroni et al. 2017; Senghore et al. 2018). 8-NO2Gua is formed from DNA damage induced by RNS generated under inflammatory conditions, and reported to participate in carcinogenesis (Hiraku 2010).
3.5.2 Serum acylcarnitines
252 participants had serum samples available for serum acylcarnitines analysis.
Serum acylcarnitines were analyzed by The Metabolomics Core Laboratory, Center of Genomic Medicine, National Taiwan University. Serum levels of 31 acylcarnitines were analyzed using Agilent 1290 UHPLC coupled with an Agilent 6460 triple quadrupole mass spectrometer (Agilent Technologies). A total of 400 μL of methanol (Scharlau, Sentmenat, Spain) was added into 100 μL of human serum to extract metabolites. The extraction was performed on Geno/Grinder2010 (SPEX, Metuchen, NJ, US) at 1,000 rpm for 2 min followed by centrifugation at 15,000 rcf for 5 min at 4 oC. Supernatant was collected and evaporated using EYELA CVE-200D Centrifugal Evaporator (TOKYO RIKAKIKAI CO., Tokyo, Japan) until dry. Dried extracts were reconstituted with 200 μL of 10 % methanol and centrifuged at 15,000 rcf for 5 min. The supernatant was then filtered with 0.2-μm Ministart RC 4 filter (Sartorius, Goettingen, Germany). All aliquots were transferred to glass inserts prior to UHPLC-MS analysis. The MS parameters were 325 oC, 325 oC, 500 V, and 3500 V for the drying gas temperature, sheath gas temperature,
nozzle voltage, and capillary voltage, respectively. The dry gas flow and sheath gas flow were 7 and 11 L min-1, respectively. The nebulizer was set at 45 psi. HSS T3 column (100 x 2.1 mm, 1.8 μm, Waters, Milford, MA, USA) was employed and the column temperature was set at 40 oC. The mobile phase was composed of solvent A (0.1 % formic acid in DI water) and solvent B (0.1 % formic acid in ACN) (J.T. Baker, Phillipsburg, NJ, USA). The gradient elution program was as followed: 0–1.5 min: 2% B; 1.5–9 min: linear gradient from 2 to 50% B; 9–14 min: linear gradient from 50 to 95% B; and 3 min maintenance in 95% B with the flow rate of 0.3 ml min-1. A 3 min equilibrium was used before next injection. All analytes were monitored in positive MRM mode. All the peaks were integrated with MassHunter Quantitative Analysis software (Agilent Technologies).
Pooled QC sample was analyzed every 20 samples and calculated for relative standard deviation (RSD). Out of the 31 analyzed acylcarnitines, 29 had RSD < 20%, and was used for statistical analysis of samples. Preprocessed data were normalized by sum of total peak area, log transformed, and autoscaled (mean-centered and divided by the standard deviation of each variable) prior to further statistical analysis.
3.6 Pathway analysis
Pathway analysis was performed using Metaboanalyst 4.0, which currently supports 80 pathways in the Homo sapiens pathway library (Chong et al. 2018). HMDB ID number and normalized peak area values were used as input. The method “Globaltest” was used for pathway enrichment analysis, and “betweenness centrality” for pathway topology analysis.
3.7 Meet-in-the-middle
Partial least squares discrimination analysis (PLS-DA) was performed using
25
Metaboanalyst 4.0 (The Metabolomics Innovation Center, Edmonton, Alberta, Canada) to identify exposures-related potential metabolites. PLS-DA models were validated using permutation test and cross-validation test. We further used Student’s t test adjusted for false discovery rate (FDR) q value to compare the peak area of each potential metabolite between high and low exposure groups for urine metabolomics results, and analysis of covariance (ANCOVA) adjusted for age, sex, and BMI for serum metabolomics and lipidomics results. Pearson’s correlation analysis was conducted to identify early health effect-related potential metabolites in urine metabolomics, and linear regression analysis was conducted for serum metabolomics and lipidomics, adjusting for age, sex, and BMI (Figure 4).
Figure 4. Meet-in-the-middle approach.
3.8 Association between exposure and early health effects
Individual association between eight carcinogens and four oxidative stress biomarkers were analyzed using linear regression analysis, while association of eight combined carcinogen exposures with four oxidative stress biomarkers were analyzed using weighted quantile sum (WQS) regression, both adjusted for age, sex, and BMI. The weighted contribution of quantile-scored exposures were derived based on bootstrap
sampling (N=100).
3.9 Statistical analysis
For comparison of basic characteristics and external exposure levels between high and low exposure groups, we used Student’s t test to analyze continuous variables, and Chi-squared test or Fisher’s exact test for discrete variables. Urine concentrations of internal exposure biomarkers were adjusted using urine creatinine concentrations and log transformed before comparing between high and low exposure groups using ANCOVA adjusting for age, sex, smoking, alcohol consumption, betel nut chewing, fish consumption, and BMI with a post comparison by Scheffe test. Oxidative stress biomarkers were adjusted using urine creatinine concentrations and log transformed before comparing between high and low exposure groups using Student’s t test. Peak area of urine metabolite features were normalized before comparing between high and low exposure groups using Student’s t test and FDR q value. Peak area of serum metabolite features, lipid features, and acylcarnitines were normalized before comparing between high and low exposure groups using ANCOVA, adjusting for age, sex, and BMI with a post comparison by Scheffe test. Student's t-test, Chi-squared test, Fisher's exact test, ANCOVA test, and linear regression analysis were performed using SAS 9.4 for Windows. PCA and PLS-DA were performed using Metaboanalyst 4.0. FDR q value was measured using fdrtool package in R 3.1.3 for Windows. WQS regression analysis was conducted using the gWQS package in R 3.5.1 for Windows.
27
4. Results and Discussion
4.1 Part 1. Linking sources to early effects by profiling urine metabolome of residents living near oil refineries and coal-fired power plants
4.1.1 Results
For 252 subjects used in urine metabolomics study, the comparison between high and low exposure groups in basic characteristics, external exposure at each subject's home locations, and internal exposures as urine biomarkers concentrations is shown in Table 2.
Overall, high exposure subjects lived 10.07± 2.43 km away from the main emission point of the coal-fired power plant and 9.35 ± 2.65 km away from the main emission point of oil refineries, while low exposure subjects lived 21.64 ± 5.19 and 20.69 ± 5.00 km away from the two main emission points, respectively. High and low exposure subjects in children (13.76 ± 0.93 years old) and elderly (65.88 ± 6.92 years old) age groups showed no significant difference in gender distribution, smoking, drinking, and betel nut chewing history, body mass index, and systolic blood pressure. Ambient concentrations of V, and three PAHs pyrene, fluoranthene, and dibenzo[a,h]anthracene were significantly higher at the home locations of high exposure subjects when compared to low exposure subjects, for both children and elderly participants. Another PAH, benzo[k]fluoranthene, was significantly increased in high exposure group in elderly subjects, but showed no difference between high and low exposure groups in children subjects.
Benzo[a]anthracene was decreased in high exposure groups for both children and elderly subjects. Road areas surrounding participants' homes, which we used to represent traffic contribution of air toxics levels, showed no difference between high and low exposure groups for both children and elderly residents at 25 m buffer. When we increased the buffer to 500 m, elderly subjects in the low exposure group had larger road areas
surrounding their homes than those in the high exposure group. Urine concentrations of 1-OHP, V, Ni, Cu, As, Sr, Cd, Hg, and Tl were significantly increased in high exposure groups compared to low exposure groups for both children and elderly subjects. The difference between high and low exposure groups was most profound for V, 1-OHP, and Tl, followed by Sr. Pearson's correlation analysis results showed significant correlation between ambient and urinary V levels; and between ambient pyrene, fluoranthene, and dibenzo[a,h]anthracene and urine 1-OHP concentrations for both children and elderly subjects (Table 3).
29
Table 2. Comparison of basic characteristics and exposure levels in 252 study subjects
Children Elderly
High (n=40) Low (n=70) p High (n=71) Low (n=71) p
Basic Characteristics
Age (years), mean±SD 13.78 ±0.93 13.83 ±0.89 0.88 66.23 ±6.54 66.36 ±7.47 0.76
Male, n (%) 22 (55.0) 38 (54.3) 0.94 28 (39.4) 35 (49.3) 0.24
Smoking history, n (%) 3 (7.5) 3 (4.3) 0.67 3 (4.2) 7 (9.9) 0.33
Drinking history, n (%) 2 (5.0) 1 (1.4) 0.30 8 (11.3) 7 (9.9) 0.79
Betel nut chewing history, n (%) 1 (2.5) 0 (0) 0.60 4 (5.6) 3 (4.2) 1.00
BMI (kg/m2), mean±SD 21.13 ±3.20 20.05 ±3.43 0.10 26.30 ±3.89 26.36 ±3.35 0.93
SBP (mmHg), mean±SD 117.63 ±13.02 115.79 ±14.26 0.50 140.76 ±20.74 141.76 ±18.95 0.77
External Exposures at study subjects’ homesb, mean±SD
Distance to coal-fired power plant 10.31 ±2.50 22.66 ±10.31 <0.05 9.94 ±2.39 20.62 ±4.72 <0.05
Distance to oil refinery 9.80 ±2.63 21.73 ±5.20 <0.05 9.09 ±2.65 19.66 ±4.59 <0.05
Road area surrounding homes
25 m buffer 241.08 ±279.23 279.23 ±226.64 0.38 269.41 ±222.79 304.52 ±237.50 0.37
500 m buffer 68088.07 ±61248.67 61248.67 ±20502.19 0.18 71269.64 ±22808.14 82235.11 ±27217.15 <0.05
Ambient concentrations
Vanadium 8.60 ±1.39 5.75 ±1.08 <0.05 8.97 ±1.63 6.22 ±0.96 <0.05
Polycyclic Aromatic Hydrocarbonsc
Pyrene 0.026 ±0.005 0.023 ±0.003 <0.05 0.030 ±0.005 0.022 ±0.003 <0.05
Fluoranthene 0.028 ±0.001 0.026 ±0.003 <0.05 0.027 ±0.001 0.024 ±0.003 <0.05
Dibenzo[a,h]anthracene 0.013 ±0.002 0.011 ±0.001 <0.05 0.014 ±0.002 0.011 ±0.001 <0.05