國立交通大學
材料科學與工程研究所
碩士論文
合成不同型態的氧化亞銅粒子探討其用於電化
學還原二氧化碳及光催化甲基橙之能力
Synthesis of Cu
2O Particles in Various Morphologies for
Electrochemical Reduction of CO
2and Photocatalytic
Decomposition of Methyl Orange
研究生: 張庭瑜
指導教授: 吳樸偉 博士
合成不同型態的氧化亞銅粒子探討其用於電化學還原二氧
化碳及光催化甲基橙之能力
Synthesis of Cu
2O Particles in Various Morphologies for
Electrochemical Reduction of CO
2and Photocatalytic
Decomposition of Methyl Orange
學生: 張庭瑜 Student: Ting-Yu Chang
指導教授: 吳樸偉博士 Advisor: Dr. Pu-Wei Wu
國立交通大學
材料科學與工程研究所
碩士論文
A Thesis
Submitted to Department of Materials Science and Engineering College of Engineering
National Chiao Tung University in partial Fulfillment of the Requirements
for the Degree of Master
in
Materials Science & Engineering June 2008
Hsinchu, Taiwan, Republic of China
合成不同型態的氧化亞銅粒子探討其用於電化學還原
二氧化碳及光催化甲基橙之能力
學生: 張庭瑜 指導教授: 吳樸偉 博士 國立交通大學 材料科學與工程研究所 中文摘要 利用化學還原法可以生成顆粒大小均一度的氧化亞銅粒子。我們使用 分子量為 200 的聚乙烯做為界面活性劑、抗壞血酸鈉做為還原劑,並藉由 氫氧化鈉調整反應溶液的酸鹼度以獲得不同粒徑的氧化亞銅粒子。 將氧化亞銅粒子塗布在商用氣體擴散電極上,在電解液中輸入二氧化 碳,由此觀察氧化亞銅的催化活性。為了瞭解催化劑的顆粒大小以及電解 液對於電化學還原二氧化碳的影響,取用直徑分別為 170、640 及 1570 nm 的氧化亞銅粒子,選擇碳酸氫鈉、氫氧化鈉及氯化鈣做為電解液。我們得 知氧化亞銅對於電化學還原二氧化碳具有一定的催化能力。持續通入二氧 化碳以及-1.7 V 的電壓 5 小時,640 nm 的氧化亞銅粒子在 0.5 M 氫氧化 鈉水溶液中可以獲得最高的電流 (-4.82 mAcm-2 )。 探討氧化亞銅粒子做為光催化劑的光催化反應中,粒子形態及光源對 光催化反應的影響,分別取用直徑為 170、640 及 1570 nm 的氧化亞銅粒 子做為光催化劑,並改變光源,分別使用一盞 150 W 鹵素燈、四盞 27 W 白光日光及兩盞 27 W 白光日光燈。170 nm 的氧化亞銅例子顯現最佳的光 催化能力,在 150 W 鹵素燈照射下 6 小時,有 31.7 % 甲基橙降解。Synthesis of Cu
2O Particles in Various
Morphologies for Electrochemical Reduction of CO
2and Photocatalytic Decomposition of Methyl Orange
Student: Ting Yu Chang Advisor: Dr. Pu Wei Wu
Department of Materials Science and Engineering National Chiao Tung University, Hsinchu, Taiwan, ROC
Abstract
Uniform Cu2O particles with various sizes and shapes were prepared by
chemical reduction route, in which the polyethylene glycol (PEG) with average molecular weight of 200 was adopted as the surfactant, the L-ascrobic acid sodium (LAAS) was employed as the reducing agent, and the NaOH was used to adjust the pH value of the solution.
We studied the electrochemical reductions of CO2 on Cu2O catalyzed gas
diffusion electrodes to determine the catalytic abilities of the Cu2O. Three
different sizes of the monodispersed Cu2O particles with diameters of 1570,
640, and 170 nm were explored as the catalysts. The NaHCO3, NaOH, and
CaCl2 were chosen as the electrolytes. The Cu2O particles presented
moderate catalytic abilities for electrochemical reduction of CO2. The highest
average current density recorded was -4.82 mAcm-2 with Cu2O particles of
electrochemical reduction of CO2 at -1.7 V.
The effect for the morphologies and light sources on the photocatalytic abilities of Cu2O was discussed. The Cu2O particles with diameters of 1570,
640, and 170 nm were chosen as photocatalysts. Photocatalytic degradation of methyl orange in an aqueous solution containing those Cu2O particles was
investigated under one 150 W halogen lamp (yellow light), or two to four 27 W fluorescent lamp (white light). The photochemical process catalyzed by the Cu2O particles with a diameter of 170 nm under single 150 W halogen lamp
demonstrated the highest photocatalytic ability, in which 31.7 % methyl orange was decolorized after 6 hours irradiation.
Acknowledgement
哇!不知不覺兩年的研究所生活,就要告一段落啦!兩年的求學生活 裡,要感謝的人,好多好多。首先,一定要感謝我的指導教授,吳樸偉老 師,除了給我課業、實驗上的指導,也常常關心學生平時的生活、未來的 生涯規劃。接著,感謝實驗室的學長姐們,勝結大哥、Kiokio 學長、張雲 閔學長、黃苡叡學長、Kiki 學長、林老師實驗室的映眉學姊、小蔡學長及 朝老師實驗室的欣君學姊,在課業、實驗上的指導以及平時的照顧。感謝 我的好同學們,好滿足三人組之小錚及小均、朝老師實驗室的小媛及林老 師實驗室的小柚,與我討論實驗、分享食物、天南地北地聊天。另外,感 謝阿夢學妹、境妤學妹、馬特先生、澳洲魚丸小姐、三角學妹以及和成學 弟,謝謝你們的幫忙唷!實驗室美好的未來就靠你們啦!還要感謝口試委 員黃暄益老師以及林鵬老師,給予我論文及實驗上的指導與建議。 最後,要感謝親愛的爹地、媽咪,每天用 Skype 陪我分享生活的點點 滴滴,在我沮喪的時候,給我滿滿的鼓勵,感謝親愛的珠妃麗小姐,為我 的生活帶來許多歡笑,感謝蕭忠仁先生,除了協助我解決實驗上的問題, 也與珠妃麗小姐一樣,讓我的生活充滿歡樂。 謝謝大家,因為有你們,我才能擁有快樂充實的研究所生活。Table of Contents
Chapter 1. Introduction………... 1
1.1. Motivation………... 1
1.2. Background of cuprous oxide………. 2
1.2.1. Materials characteristics of cuprous oxide……….. 2
1.2.2. Synthesis of cuprous oxide………. 3
1.2.3. Applications of cuprous oxide……… 7
1.3. Methods in carbon dioxide reduction………. 8
1.3.1. Absorption/Adsorption……… 9
1.3.2. Electrochemical reduction……….. 10
1.4. Properties and applications of photocatalysts………. 14
Chapter 2. Synthesis and Characterizations of Cuprous Oxide……...…. 25
2.1.0. Introduction………. 25
2.2.0. Experimental………... 26
2.2.1. Reagents……….. 26
2.2.2. Synthetic approaches……….. 26
2.2.3. Materials characterizations………. 28
2.3.0. Results and discussion……… 28
2.3.1. Characterization on the synthesized Cu2O particles………... 29
2.3.2. The influence of surfactant concentration on the Cu2O growth………. 29 2.3.3. The influence of base concentration on the Cu2O growth….. 30
2.4.0. Conclusions………. 32
Chapter 3. Electrochemical Reduction of Carbon Dioxide with Gas Diffusion Electrodes Catalyzed by Cuprous Oxide……..….. 45 3.1.0. Introduction………. 45
3.2.0. Experimental………... 46
3.2.1. Electrochemical setup………. 46
3.2.2. Fabrication of gas diffusion electrode………. 46
3.2.3. Electrochemical analysis………. 48
3.3.0. Results and discussion……… 48
3.3.1. Results from cyclic voltammetry……….………... 49
3.3.2. Results from potentiostatic measurement...……… 51
3.4.0. Conclusions………. 53
Chapter 4. Photocatalytic Properties of Cuprous Oxide………... 67
4.1.0. Introduction………. 67
4.2.0. Experimental………... 68
4.2.1. Reagents……….. 68
4.2.2. Determination in photocatalytic ability………... 68
4.3.0. Results and discussion……… 69
4.3.1. The influence of catalysts on the degradation ability of methyl orange……….. 69 4.3.2. The influence of light on the degradation ability of methyl Orange………. 70 4.4.0. Conclusions………. 71
Chapter 5. Summaries and Future Work……….. 79
List of Figures
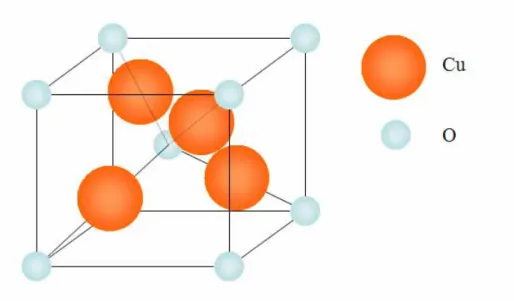
Figure 1.1. The crystal structure of Cu2O………... 18
Figure 1.2. SEM images of Cu2O deposited on ITO substrates from
electrolyte containing 0.02 M Cu(Ac)2, 0.1 M NaAc and
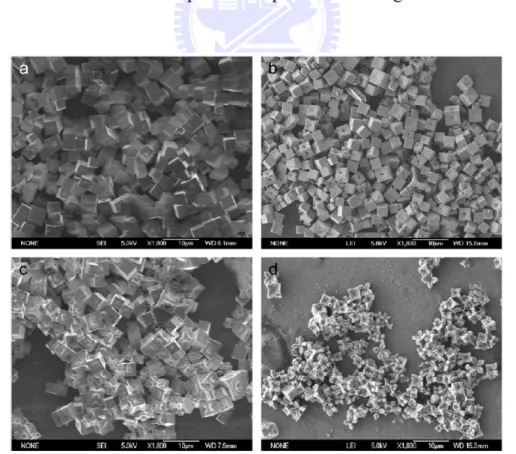
CTAB with different concentrations: (a) 0, (b) 0.4 mM, (c) 0.8 mM, and (d) 2.8 mM………...……… 18 Figure 1.3. TEM images for Cu2O nanocubes fabricated by adding the
mixture of AA and NaOH into the solution containing Cu2+ and (a) 4 mL, (b) 2 mL, and (c) 1 mL of 0.05 M PEG……. 19 Figure 1.4. SEM images (a), (b), and XRD pattern (c) of hollow Cu2O
spheres produced with a NaOH titration rate of 0.25 mLmin−1……… 19 Figure 1.5. SEM (columns 1 and 2) and TEM (columns 3 and 4)
images of the Cu2O nanocubes for samples A to F (seed to
transfer 5 times)……… 20 Figure 1.6. SEM images ((a) to (e)) and EDX spectra (d1 and d2) for
the samples isolated in the time-dependent experiments with glutamic acid………. 21 Figure 1.7. SEM images of Cu2O particles prepared under different
pH values: (a) pH of 6.5, (b) pH of 6.7, (c) pH of 7.5, and (d) pH of 8.0………. 21 Figure 1.8. (a) TEM image (inset is the SAED patterns) and (b)
HRTEM image of the Cu2O nanorods via solvothermal
of ethanol and deionized water at 140 °C for 10 hours…… 22 Figure 1.9. SEM image of Li2O before treatment (A), heat treated at
600 °C for 2 hours in a CO2 flux (B), and scheme of the
mechanism proposed for CO2 absorption on Li2O (C)……. 22
Figure 1.10. (a) The IV curves for CO2 reduction on Pb electrode in 0.1
M K2CO3 at various time periods. (b) Faradaic current
efficiency–potential diagram for formic acid formation on the Pb electrode in 0.1 M K2CO3 at different time
intervals; (■) 30, (●) 60, (▲) 90, and (▼) 120 min. (c) The image of the electrochemical fixed-bed reactor……… 23 Figure 1.11. Photocatalytic ability of bulk and nanoparticulate BFO on
degradation of methyl orange under irradiation of UV-vis and visible light………. 24 Figure 1.12. The mechanisms occurring on TiO2 surfaces exposed to
light for the photodegradation of organic pollutants……… 24 Figure 2.1. Illustration of procedure A (above) and B (below), used to
grow Cu2O particles……….. 34
Figure 2.2. Illustration of synthetic process of Cu2O particles………... 34
Figure 2.3. Four different sizes of Cu2O particles with four different
colors………. 35 Figure 2.4. SEM images of Cu2O particles synthesized through
different concentrations of PEG (200)……….. 37 Figure 2.5. Part of the Pourbaix diagram for the Cu in different
potentials and pH………..……… 41 Figure 2.6. The colors of the solutions after adding 10 mL of various 41
concentrations of NaOH into the solution containing copper(II) and PEG………... Figure 2.7. SEM images of the Cu2O particles synthesized at different
pH values of the solution……….. 42 Figure 2.8. SEM images of the Cu2O particles synthesized through
different methods……….. 44 Figure 3.1. The photograph (a) and the schematic diagram (b) of the
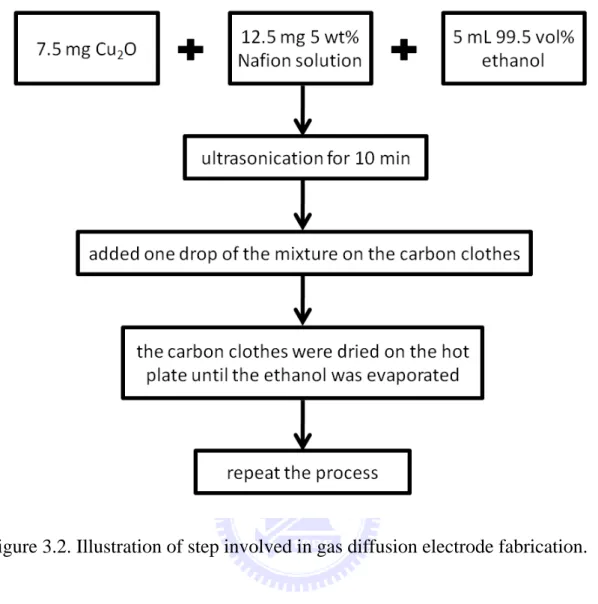
electrolysis cell………. 54 Figure 3.2. Illustration of step involved in gas diffusion electrode
fabrication………. 55 Figure 3.3. The photograph of the gas diffusion electrode catalyzed
with the Cu2O particles of (a) 1570, (b) 640, and (c) 170
nm………. 55 Figure 3.4. The SEM images of the gas diffusion electrode catalyzed
with the Cu2O particles of (a) 1570, (b) 640, and (c) 170
nm………. 56 Figure 3.5. Flow chart for electrochemical analysis…………...……… 56 Figure 3.6. The CV curves of the electrochemical reactions catalyzed
by the Cu2O particles with a diameter of 1570 nm in
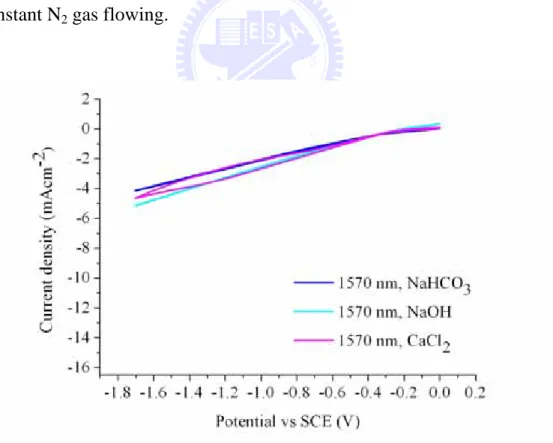
different electrolytes under constant N2 gas flowing……… 57
Figure 3.7. The CV curves of the electrochemical reactions catalyzed by the Cu2O particles with a diameter of 1570 nm in
different electrolytes under constant CO2 gas flowing……. 57
Figure 3.8. The CV curves of the electrochemical reactions catalyzed by the Cu2O particles with a diameter of 640 nm in
different electrolytes under constant N2 gas flowing……… 58
Figure 3.9. The CV curves of the electrochemical reactions catalyzed by the Cu2O particles with a diameter of 640 nm in
different electrolytes under constant CO2 gas flowing……. 58
Figure 3.10. The CV curves of the electrochemical reactions catalyzed by the Cu2O particles with a diameter of 170 nm in
different electrolytes under constant N2 gas flowing……… 59
Figure 3.11. The CV curves of the electrochemical reactions catalyzed by the Cu2O particles with a diameter of 170 nm in
different electrolytes under constant CO2 gas flowing……. 59
Figure 3.12. The CV curves of the electrochemical reactions catalyzed by the Cu2O particles with different diameters in NaHCO3
acted as the electrolyte under constant CO2 gas flowing….. 60
Figure 3.13. The CV curves of the electrochemical reactions catalyzed by the Cu2O particles with different diameters in NaOH
acted as the electrolyte under constant CO2 gas flowing….. 60
Figure 3.14. The CV curves of the electrochemical reactions catalyzed by the Cu2O particles with different diameters in CaCl2
acted as the electrolyte under constant CO2 gas flowing….. 61
Figure 3.15. The CV curves of the electrochemical reactions with and without the Cu2O particles in NaOH acted as the
electrolyte under constant N2 gas flowing……… 61
Figure 3.16. The CV curves of the electrochemical reactions with and without the Cu2O particles in NaOH acted as the
Figure 3.17. The current-time curves for the electrochemical reactions catalyzed by the Cu2O particles with a diameter of 1570
nm in the different electrolytes under constant CO2 gas
flowing at -1.7 V………... 63 Figure 3.18. The current-time curves for the electrochemical reactions
catalyzed by the Cu2O particles with a diameter of 640 nm
in the different electrolytes under constant CO2 gas
flowing at -1.7 V………... 63 Figure 3.19. The current-time curves for the electrochemical reactions
catalyzed by the Cu2O particles with a diameter of 170 nm
in the different electrolytes under constant CO2 gas
flowing at -1.7 V………... 64 Figure 3.20. The EDX images before (a) and after (b) electrochemical
reaction for 5 hours in the CaCl2 electrolyte……… 64
Figure 3.21. The time-current curves for the electrochemical reactions catalyzed by the Cu2O particles with different diameters in
the NaHCO3 electrolyte under constant CO2 gas flowing at
-1.7 V……… 65 Figure 3.22. The current-time curves for the electrochemical reactions
catalyzed by the Cu2O particles with different diameters in
the NaOH electrolyte under constant CO2 gas flowing at
-1.7 V……… 65 Figure 3.23. The current-time curves for the electrochemical reactions
catalyzed by the Cu2O particles with different diameters in
-1.7 V……… 66 Figure 4.1. Illustration of experimental determination in photocatalytic
ability……… 72 Figure 4.2. The photocatalytic ability of Cu2O particles with a
diameter of 1570 nm under one 150 W halogen lamp…….. 72 Figure 4.3. The photocatalytic ability of Cu2O particles with a
diameter of 1570 nm under four 27 W fluorescent lamps.... 73 Figure 4.4. The photocatalytic ability of Cu2O particles with a
diameter of 1570 nm under two 27 W fluorescent lamps…. 73 Figure 4.5. The photocatalytic ability of Cu2O particles with a
diameter of 640 nm under one 150 W halogen lamp……… 74 Figure 4.6. The photocatalytic ability of Cu2O particles with a
diameter of 640 nm under four 27 W fluorescent lamps….. 74 Figure 4.7. The photocatalytic ability of Cu2O particles with a
diameter of 640 nm under two 27 W fluorescent lamps…... 75 Figure 4.8. The photocatalytic ability of Cu2O particles with a
diameter of 170 nm under one 150 W halogen lamp……… 75 Figure 4.9. The photocatalytic ability of Cu2O particles with a
diameter of 170 nm under four 27 W fluorescent lamps….. 76 Figure 4.10. The photocatalytic ability of Cu2O particles with a
diameter of 170 nm under two 27 W fluorescent lamps…... 76 Figure 4.11. The degradation of MeO with Cu2O particles as the
photocatalysts under one 150W halogen lamp.……...……. 77 Figure 4.12. The degradation of MeO with Cu2O particles as the
Figure 4.13. The degradation of MeO with Cu2O particles as the
photocatalysts under two 27 W fluorescent lamps………... 78 Figure 4.14. The degradation of MeO catalyzed by Cu2O particles with
List of Tables
Table 1.1. Faradaic efficiencies for the products obtained in the electrochemical reduction of CO2 at -2.4 V (Ag/AgCl) on
a copper(I) halide-confined Cu-mesh electrode…………... 23 Table 3.1. The current density at -1.7 V with Cu2O particles in
different sizes in three different electrolytes under N2 or
CO2 constant bubbling. ……… 62
Table 3.2. The average current densities of the Cu2O particles in three
different sizes in three different electrolytes under the constant CO2 gas flowing at -1.7 V for 5 hours
electrochemical reaction………... 66
Chapter1.
Introduction
1.1. Motivation
Our life has become more convenient and comfortable ever since the industrial revolution. Unfortunately, there is a price that accompanies the rising living standard, which is the worsening greenhouse effect. The greenhouse effect is a process that makes the surface temperature of earth warmer every year. Among many possible suspects, the carbon dioxide is the primary cause. Hence, there is an urgent need to identify an effective method to reduce the concentration of carbon dioxide in the atmosphere in order to mitigate the greenhouse effect.
To date, there are extensive researches in identifying the appropriate method to reduce the carbon dioxide concentration in the atmosphere. For example, approaches such as chemical absorption, physical adsorption, bioconversion, and electrochemical conversion have been investigated. Since our laboratory is known for electrochemical applications, it becomes our objective to study practical means of CO2 reduction in electrochemical route.
In this study, we synthesized cuprous oxide nanoparticles in different sizes and shapes by a variety of chemical synthetic methods. The as-synthesized powders were used as the electrocatalyst dispersed on a gas diffusion electrode to activate CO2 reduction when immersed in a proper electrolyte. In addition, we studied the effects of shape and size of the cuprous oxide on the resulting CO2 catalytic behaviors. Furthermore, we explored possible photocatalytic
abilities for the Cu2O. This thesis documents our preliminary efforts in Cu2O
material synthesis and application evaluations.
1.2. Background of cuprous oxide
1.2.1. Materials characteristics of cuprous oxide
The Cu2O began to attract considerable interests in 1920s since invention
of the cuprous oxide rectifier was demonstrated by Grondhal et al.[1] Afterwards, many characterizations of Cu2O were carried out and reported
from 1930 to 1940.[1] Typically, the Cu2O is found in red colored rocks.
However, it is likely to reveal many other colors from red to yellow and the color of Cu2O is influenced greatly by its particle sizes.
The Cu2O is insoluble in organic solvents and water but it can be dissolved
in hydrochloric acid to form HCuCl2. In addition, in electrolytes of dilute
nitric acid and sulfuric acid copper(II) sulfate and copper(II) nitrate are formed, respectively. Moreover the Cu2O could be dissolved in concentrated
ammonia solution to form [Cu(NH3)2]+ and the latter oxidizes to
[Cu(NH3)4(H2O)2]2+ readily. The melting point of Cu2O is about 1235 °C and
its density is about 6.0 gcm-3.[2]
The Cu2O is known as a semiconductor with a direct band gap about 2.14
eV. Intrinsically, it is a P-type semiconductor which is due to the presence of copper vacancies. The resistivity for Cu2O is found to vary from a few tens of
Ω.cm to 104 Ω.cm. The crystal structure of Cu2O is cuprite with a lattice
constant of 4.27 Å. The oxygen anions are arranged in a body-centered relatively to each other and the copper cations are positioned in a face-centered
lattice. [1]
1.2.2. Synthesis of cuprous oxide
A. Electrodeposition
Stareck et al. conducted the earliest research in which electrodeposition was employed to fabricate an uniform film of Cu2O.
Generally speaking, the Cu2O could be electrochemically deposited onto
conductive substrates such as gold and indium-doped tin oxide. The applied potential between the anode and cathode is typically less than 0.5 V and the growth conditions determine the morphologies of the resulting films. [1]
Previously, Yan et al. selected anionic surfactant sodium bis(2-ethylhexyl) sulfosuccinate (AOT), oil phase p-xylene, and CuCl2 to
form cuprite nanowires. The electrodeposition was performed at a static potential of -1.1 V for 1 or 2 hours with two copper electrodes as working and counter electrodes, respectively. A large number of nanowires with 3 to 5 µm in lengths and 25 to 45 nm in diameters were obtained at a deposition time of 1 hour. They reported that increasing the deposition time to 2 hours resulting in nanowires longer than 10 µm with average diameters of 100 nm.[3]
Recently, Wang et al. deposited the Cu2O on indium-doped tin oxide
(ITO) substrate via an electrodeposition with a potential of -0.2 V against the Ag/AgCl for 600 seconds. The electrolyte was a mixture of cetyl trimethylammonium bromide (CTAB), NaAc, and Cu(Ac)2. They
obtained flower-leaves to cactus Cu2O through controlling the
concentrations of CTAB. They observed that by increasing the concentration of CTAB the flower-leaves Cu2O became cactus shaped
(shown in figure 1.2).[4]
B. Chemical reduction
Chemical reduction is a relatively simple method to form Cu2O with
unique shapes and sizes. It has been established that the identification of suitable surfactants, reducing agents, copper(II) ion sources, and processing parameters is critical in synthesizing Cu2O with superb
uniformity.
Wang et al. synthesized Cu2O nanowires at room temperature using
the CuCl2 as a copper(II) ion source, hydrazine as a reducing agent, and
PEG (M.W. 20000) as a surfactant. The NaOH solution was added into the solution containing CuCl2 and PEG to form Cu(OH)2 as blue
precipitates. After adding the hydrazine into the solution containing Cu(OH)2, they obtained Cu2O nanowires. The diameters of the
nanowires were about 8 nm and the length of the nanowires ranges from 10 to 20 µm.[5]
Murphy et al. not only changed the adding sequence of base (NaOH) and reducing agent (L-ascorbic acid, AA), but also controlled the concentration of surfactant (PEG with M.W. 600) to prepare the Cu2O
nanocubes with various edge lengths from 25 to 200 nm. They observed that when the reducing agent (AA) was added into CuSO4
affect the particle size of the Cu2O nanocubes. However, when the AA
and base were added simultaneously, decreasing the concentration of PEG from 0.025 to 0.0031 M led to smaller particle sizes with uniform cubic morphologies (shown in figure 1.3).[6]
Chen et al. used the PEG as a reducing agent and gelatin as a soft template to synthesize spherical Cu2O with nanoholes. They prepared
the Cu2O by heating the mixture of CuSO4, PEG, and gelation at 70 °C
and then adding the NaOH solution into the mixture drop by drop. The hollow Cu2O spheres with diameters about 100 to 200 nm were obtained
with a titration rate of 4 mLmin-1 for the NaOH solution. When they adjusted the titration rate to 0.25 mLmin-1, the hollow Cu2O spheres
became much larger (with diameter about 600 nm, shown in figure 1.4).[7]
Recently, Huang et al. used the sodium dodecyl sulfate (SDS) as a capping agent and sodium ascorbate (SA) as a reducing agent to fabricate the Cu2O nanoparticles by the seed-mediate method. The CuSO4 and
SDS were first mixed thoroughly and the SA and NaOH were added subsequently. The as-prepared seed nanoparticles were transferred into another vessel containing CuSO4 and SDS followed by addition of SA
and NaOH. Through the unique seed-mediated route they prepared monodispersed Cu2O particles with adjustable sizes ranging from 40 to
420 nm (shown in figure 1.5). [8]
C. Hydrothermal reduction
crystals at relatively high pressure. Zhu et al. prepared hollow Cu2O
microspheres about 10 µm in diameter with nanocrystals-composed porous multishells by solvothermal synthesis. They added copper nitrate and glutamic acid into ethanol simultaneously and transferred the mixture to a Telfon-lined stainless autoclave followed by heat treatment at 160 °C for different duration. They obtained copper hydroxynitrate hollow microspheres with well crystallinity, after 2 hours of solvothermal treatment. When the solvothermal time was prolonged to 48 hours, the copper hydroxynitrate hollow microspheres were totally transformed to Cu2O microspheres with impressive multilayer hierarchy (shown in
figure 1.6). [9]
Sun et al. developed a similar hydrothermal process to synthesize Cu2O by reducing copper-citrate complex directly. The procedure for
Cu2O preparation was mixing Na3C6H5O7, CuCl2, and NaH2PO2
simutaneously, followed by heating in the Teflon-lined autoclave at 100 °C for 24 hours. By adjusting the pH value of the solution with NaOH they were able to obtain a variety of Cu2O particles. They obtained
Cu2O cubes with particle size about 1 µm at a pH value of 6.5. When
they increased the pH value to 8.0, they observed eight-pod particles with particle size about 2 µm (shown in figure1.7).[10]
Wei et al. also synthesized pure copper nanocrystallites with sizes ranging from 50 to 100 nm and Cu2O nanorods via a solvothermal
treatment. The typical size of Cu2O nanorods is 10 to 15 nm in width
and 20 to 50 nm in length. Pure copper nanocrystallites were prepared by CuSO4 or CuSO4.5H2O, with NaOH in ethanol at 140 °C for 10 hours.
CuSO4.5H2O, with NaOH in a mixed solution containing ethanol and
deionized water at 140 °C for 10 hours (shown in figure 1.8). [11]
In addition to the above-mentioned report, Valtiera et al. adopted the 2,4-pentanedionate copper(II) as a precursor and chose the vapor deposition method to grow Cu2O film on fiberglass.[12] The Cu2O film
was formed by thermal oxidation under suitable conditions.[1]
1.2.3. Applications of cuprous oxide
There have been strong interests in the Cu2O because it is a material with
merits such as low cost, simple preparations into various shapes, and promising applications.
First, the Cu2O acts as a reasonable photo catalyst for water splitting into
oxygen and hydrogen under visible light irradiations. Domen et al. prepared the Cu2O by the hydrolysis of CuCl. Afterwards, they illuminated the
as-prepared Cu2O in distilled water by a 300 W Xe lamp for more than 1900
hours. To their surprise, they observed that the photocatalytic water splitting on the Cu2O powders demonstrate negligible reduction in the activity for more
than 1900 hours.[13]
Second, the Cu2O exhibits high sensitivities to some flammable gases. Li
et al. prepared the Cu2O nanoparticles in 200 nm by chemical reduction of
copper. Some of the as-prepared nanoparticles were subjected to an annealing at 500 °C for 1 to 2 hours to form CuO nanospheres and the others were under aging at room temperature for 0.5 to 3 min forming nanospheres. They determined that the Cu2O nanospheres reveal higher sensitivities than that of
Third, the Cu2O can be used in photo degradation of selective dye
molecules. Wang et al. reduced the CuCl2 by hydrazine and obtained different
shapes and sizes of Cu2O through adjusting the concentrations of NaOH and
NH3. They reported that the octahedral Cu2O adsorbs 80 % methyl orange
under a 500 W Hg lamp for 30 minutes. On the other hand, the cubic Cu2O
demonstrates much less degradation ability for the methyl orange.[15]
Lastly, the Cu2O is believed to exhibit moderate ability in solar energy
conversion.[1] Minami et al. combined an n-type ZnO thin film with a p-type Cu2O thick sheet by methods such as magnetron sputtering (MSP), pulsed laser
deposition (PLD), and vacuum arc plasma evaporation (VAPE). They reported that a Ga-doped ZnO-Cu2O heterojunction solar cell fabricated by a
ZnO thin film prepared by VAPE and an Al-doped ZnO-Cu2O device fabricated
using PLD exhibit efficiencies of 1.52 and 1.42 % using AM2 solar illumination (100 mWcm-2).[16]
In addition, considerable interests have arisen on the Cu2O for novel
applications, including the anode material for lithium ion battery[17] and catalyst for CO conversion.[18]
1.3. Methods in carbon dioxide reduction
In order to avoid the disaster brought by greenhouse effect, numerous methods have been suggested to reduce the CO2 concentration in the
atmosphere. In following section, we would discuss two of the most popular methods of CO2 sequestration.
1.3.1. Absorption/Adsorption
There are many absorbents available to retain CO2. They include
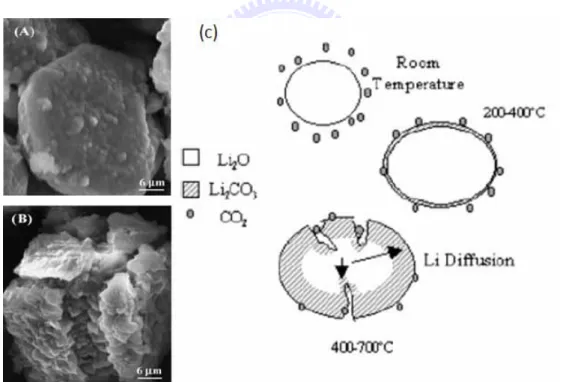
polymer membranes, zeolites, perovskites, magnesia, and sodalime. Pfeiffer et al. used commercial Li2O to absorb CO2 at different temperatures. Result
from the thermogravimetric analyses (TGA) on the Li2O in a CO2 flux
indicated an increase of weight about 14.3 wt% between 190 and 400 °C due to Li2O conversion into Li2CO3. When the reaction temperature was increased
to 600 °C, more Li2O became LiCO3 and the weight increased dramatically
raised to 226 wt% (86 mol%), corresponding to 1.26 g of CO2 per gram of
Li2O. Figure 1.9 depicted the mechanism proposed for the CO2 absorption on
Li2O and the SEM image of Li2O before and after heat treatment at 600 °C for
2 hours in a CO2 flux. [19]
Pfeiffer et al. also prepared Li2-xNaxZrO3 by a heat treatment of Li2CO3,
Na2CO3, and Zr(OCH3)4 at 900 °C to absorb CO2. They determined the CO2
absorption of Na2ZrO3 was higher than that of Li2ZrO3. Results from the
thermogravimetric analyses indicated that the Li2ZrO3 absorbed CO2 with an
increase of weight about 4 wt% after the reaction. Similarly, the Li1.8Na0.2ZrO3 increased its weight to 6.9 wt% and Li1.4Na0.6ZrO3 increased its
weight to 13.1 wt%, respectively. Comparing to other samples they prepared, the LiNaZrO3 demonstrated the highest CO2 chemisorption efficiency of 75.3
% at 600 °C.[20]
Hausler et al. estimated the influence of SO2, N-methyldiethanolamine
(MDEA), and triethanolamine (TEA) on the CO2 absorption capacity by
utilizing aqueous 2-(2-aminoethylamino)ethanol (AEE) solution and its blends with MDEA and TEA to absorb CO2 or CO2/SO2 mixtures at 23 °C. They
found out that the additions of 5 and 10 wt% of MDEA and TEA exerted negligible influence on the CO2 absorption in AEE solution. Furthermore,
adding MDEA increased the CO2 absorption capacity of AEE slightly, whereas
adding TEA decreased the CO2 absorption capacity of AEE in the absence or
presence of SO2. They obtained the highest CO2 absorption capacity about
1.267 mol of CO2 per mol of amine by using 15 wt% AEE + 10 wt%
MDEA.[21]
In order to determine the best adsorbent for CO2, Snap et al. prepared
nitrogen enriched carbons by urea-formaldehyde (UF) and melamine-formaldehyde (MF) in the presence of K2CO3. The K2CO3 acted as
a chemical activation agent activating the reaction over a range of temperatures from 400 to 700 °C. The UF with an activation temperature of 500 °C presented the highest CO2 capacity, capturing over 8 gram CO2 per 100 gram
of adsorbent at 25 °C. Higher activation temperature resulted in higher surface area, but did not improve CO2 capturing ability, suggesting that sites
suitable for the adsorption of CO2 were destroyed at higher temperature.[22]
1.3.2. Electrochemical reduction
Electrochemical reduction of CO2 has attracted much attention because it
might be a promising method for turning CO2 to useful materials. Some
common products of CO2 from the electrochemical reduction are listed below.
The equilibrium potentials of each reaction have been reported by Sullivan et al. under the standard conditions against NHE.[23]
2CO2 + 2H+ + 2e- → H2C2O4 E0 = -0.475 (1.1) CO2 + 2H+ + 2e- → HCOOH E0 = -0.199 (1.2) CO2 + 2H+ + 2e- → CO + H2O E0 = -0.109 (1.3) CO2 + 4H+ + 4e- → HCHO + H2O E0 = -0.071 (1.4) CO2 + 6H+ + 6e- → CH3OH + H2O E0 = +0.030 (1.5) CO2 + 8H+ + 8e- → CH4 + 2H2O E0 = +0.169 (1.6)
Fujishima et al. used various metal wires (Ti, W, Ni, Pd, Pt, Cu, Ag, Zn, Sn, and Pb) as the working electrode, Pt wire as the counter electrode, and 0.3 M tetrabutylamonium perchloride (TBAP) in methanol as a supporting electrolyte to conduct electrochemical reduction of CO2 galvanostatically at 25
°C, 41 atm, mainly at 200 mAcm-2. The electrochemical reduction products were analyzed by flame ionization detector (FID) and thermal conductivity detector (TCD). They found out that W, Ti, and Pt electrodes did not possess the required ability in electrochemical reduction of CO2. Formate was
produced at Sn and Pb electrodes, but much more CO was also observed. In contrast, electrolysis at Ag, Zn, and Pd electrodes yielded CO mostly. The Cu electrode revealed better ability to form hydrocarbons in aqueous electrolyte than in methanol system. However, the hydrocarbon formation at Ni electrode was more efficient in methanol than that of the aqueous system.[24]
Fujishima et al. also used RuO2 deposited on boron-doped diamond (BDD)
as the working electrode, the Pt used as the counter electrode, and SCE as the reference electrode to reduce CO2. They adjusted the pH value of the solution
by NaOH and they obtained the optimized efficiency for CO2 reduction (almost
acid. The applied potential was -0.55 V and the current density was about -0.45 mAcm-2. In their study, their found out the use of BDD as a substrate for the RuO2 layers resulted in much lower Faradic efficiency for CO2
reduction to methanol as compared to using the TiO2 as a substrate.[25]
Hori et al. prepared the silver-coated ion exchange membrane (solid polymer electrolyte, SPE) electrodes through the electroless method to deposit silver onto the ion exchange membrane. The SPE electrode was used as the working electrode, a Pt plate was used as the counter electrode, and 0.2 M K2SO4 was adopted as the electrolyte. Ag/SPE prepared from an anion
exchange membrane (AEM) reduced CO2 to CO and HCOOH for more than 2
hours. They controlled the current density at 50 mAcm-2 and obtained average electrode potential about -1.8 V (vs. SHE) when the reduction process was performed at the AEM electrode with silver coated two layers. However, the SPE electrode system prepared from the cation exchange membrane (CEM) was not suitable for CO2 reduction, since OH-, HCO3-, and CO32- formed in the
CO2 reduction could not be removed from the metal membrane interface.[26]
Ogura et al. prepared copper(I) halide-confined Cu-mesh electrodes by electrochemical oxidation (applied potential: 0.2 to 0.4 V) of HCl, KBr, and KI, respectively. The electrolysis potential for the electrochemical reduction of CO2 was -2.4 V (Ag/AgCl). When they used the CuCl as working electrode,
they chose 3 M KCl as electrolyte and recorded current density about 46 mAcm-2. When they used the CuBr as working electrode, they selected 3 M KBr as electrolyte and obtained current density about 37 mAcm-2. Although the CuBr electrode presented lower current density, it conversed 24.3 % of CO2
more than that of CuCl electrode (17.1 %). Table 1.1 presents the Faradaic efficiencies for the products obtained in the electrochemical reduction of CO2
at -2.4 V (Ag/AgCl) on a copper(I) halide-confined Cu-mesh electrode. [27] Köleli et al. used the electrodeposition method to deposit polypyrrole on the platinum as working electrode for electrochemical reduction of CO2. The
electrolyte was MeOH/0.1 M LiClO4/H+/H2O, the applied potential was -0.4 V
(Ag/AgCl) and the obtained current density was smaller than 13 mAcm-2 under ambient condition. When the electrochemical process was operated under ambient condition, only a minute amount of CO2 became HCOOH, CH3COOH,
and HCHO. However, they obtained much more HCOOH, CH3COOH, and
HCHO under high pressure (20 bar).[28]
Kaneco et al. used copper the electrode in methanol with sodium supporting salts to reduce CO2 by electrochemical method. The reduction
process was investigated with various sodium supporting salts, such as acetate, chloride, bromide, iodide, thiocyanate, and perchlorate, at a low temperature (-30 °C). The best results they obtained were utilizing 0.5 M NaClO4
(methanol-based) electrolyte at -3.0 V (Ag/AgCl). The current density was 27 mAcm-2 and the faradic efficiency of methane was 70.5 %.[29]
Koleli et al. studied the electrochemical reduction of CO2 on Pb and Sn
electrodes in aqueous KHCO3 and K2CO3 electrolyte in a fixed-bed reactor.
The highest current efficiency for formic acid, the predominant product, obtained in 0.5 M KHCO3 at -1.5 V (SCE) after 30 min electrolysis was found
to be 90 % for Pb electrode and 74 % for Sn electrode. Meanwhile, the current efficiency for the formic acid in 0.1 M K2CO3 at -1.5 V (SCE) after 30
min electrolysis was found to be 39 % for Pt electrode. Figure 1.10 depicted the image of the electrochemical fixed-bed reactor, the current-potential diagram and the Faradaic current efficiency–potential diagram for formic acid formation on Pb electrode in 0.1 M K2CO3 at different time intervals.[30]
1.4. Properties and applications of photocatalysts
Photochemistry is the subject studying the relationship between light and molecules. Light is the common name for electromagnetic (EM) radiation in the visible, near-ultraviolet, and near-infrared spectral range. The electromagnetic spectrum includes a variety of radiations from very long radio waves with the dimension of buildings to very short gamma rays which are much smaller than an atom nucleus. In the wave model, the frequency (λ) is inversely proportional to the wavelength (ν) according to the equation:
c = λν (1-7)
The value of c is constant (2.998 × 10⁸ ms-1 in vacuum).[31]
In the quantum model, the photon is used to describe the quantized energy of an electromagnetic wave. A photon has no mass but it has a specific energy (E) directly proportional to the frequency (ν) of the radiation, according to the Planck relation:
E = hν (1-8)
Where h is the Pranck constant (6.626 × 10⁻³⁴ J.s).[31]
The reactions induced by light are defined as photochemical reactions. The first step of a photochemical process is the photoexcitation (the mechanism of electron excitation by photon absorption), where the reactant is elevated to an excited state possessing a higher energy than that of ground state.
M + hν → M* (1-9)
where M is the molecule at ground state, M* is the molecule at excited state, and hν is the photon energy. [31]
The molecule in the excited states could return to the ground state by various processes.
M* → M + hν’ (1-10) M* → M + heat (1-11) M* + Q → M+ Q’ (1-12)
where Q is the molecule that absorbed the excited energy of M*.
The photochemical reaction could be categorized by the usage of photosensitizing materials (photocatalyst). If the initial reactant could not absorb light energy or the light energy could not derive sufficient energy for photochemical reaction, the photocatalysts were added to absorb light and promote the desirable photochemical reaction. In principle, the photochemical reaction with photocatalysts added may proceed on the surface of a semiconductor through several steps. First, electron-hole pairs are created by exciting the semiconductor with light or suitable energy. Second, isolation of the electrons and holes on the semiconductor surface takes place. Third, the separated electrons and holes would initiate individual redox process with the reactants adsorbed on the surface. Finally, the products are released and the surface reconstructed.[31]
Yang et al. prepared the Cu2O nanoparticles with diameter of 35 nm via
and K2Cr2O7 as additive. Electrolysis was performed under stable current
densities (50, 70, 90, 100, and 110 mAcm-2) at 70 °C for 1 hour and the Cu2O
nanocrystal prepared under 100 mAcm-2 was chosen as the catalyst. They observed thtat 97 % of 50 mgL-1 methyl orange (MO) was decomposed under a 125 W high-pressure mercury lamp for 2 hours or under sunlight for 3 hours when Cu2O in 2gL-1 was added. In contrast, pure TiO2 and CdS
photocatalysts were effectively only under UV irradiation.[32]
Andronic et al. prepared the TiO2 film by Spray Pyrolysis Deposition
(SPD) in order to study the influence of the TiO2 in specific surface (powder,
film) on the photocatalytic degradation of MO. The photcatalysis process was operated under an 18 W fluorescence lamp by adding 1 g TiO2 powder per 1 L
solutions with different MO concentrations. At higher MO concentrations, the light penetration was reduced which was due to heavy MO adsorption on the TiO2 and fewer photons were able to reach the catalyst surface. When the
film and powder were 0.004 gL-1 and the MO was 7.8125 mgL-1, the film of TiO2 demonstrated photocatalytic efficiency about 5.10 % after 6 hours of
reaction, this value was lower than that of TiO2 (efficiency: 7.12 %).[33]
Liu et al. synthesized the BiFeO3 (BFO) nanoparticles via a sol-gel
method and studied their photocatalytic abilities through decomposition of MO. They dissolved bismuth nitrate and iron nitrate within 2-methoxyethanol and added polyethylene glycol as a dispersant. The mixture was calcinated under 500 °C for 2 hours to form perovskite-type BFO. The initial concentration for MO was 15 mgL-1 with a catalyst loading of 30 mmolL-1 (11.545 gL-1) and more than 90 % of MO was decolorized after 8 hours of irradiation under a 300 W Xe lamp. Figure 1.11 presents the photocatalytic ability of bulk and nanoparticlate BFO on degradation of MO under UV-vis light irradiation and
visible light irradiation. [34]
Parida et al. prepared the hydrated titanium oxide by a sol-gel approach, adopting titanium isopropoxide as starting material. The as-prepared TiO2
nanoparticles were made into a series of sulfated TiO2 samples via an aqueous
wetness impregnation method with various weight percentages of SO42-. The
photocatalytic degradation of MO was carried out under sunlight with a solar intensity about 800 Wm-2 by taking 20 mL of 150 mgL-1 MO solution with 1.0 gL-1 catalyst. The samples loaded with 2.5 wt % SO42- indicated higher
degradation ability than without or less loading and its behavior may be due to the addition of sulfate that effectively decreased the crystal size of the TiO2.
By adjusting the pH value of the solution from 8 to 2, they found out the percentage of degradation was increased with decreasing pH values. Since the surface of the sulfate-modified TiO2 became positively charged at pH lower
than 4.5 to 5.0 and MO was an anionic dye, the photocatalytic reaction was likely to be faster at acidic pH. Figure 1.12 depicts the mechanisms occurring on the TiO2 surfaces exposed to light for the photodegradation of organic
Figure 1.1. The crystal structure of Cu2O.[1]
Figure 1.2. SEM images of Cu2O deposited on ITO substrates from electrolyte
containing 0.02 M Cu(Ac)2, 0.1 M NaAc and CTAB with different
Figure 1.3. TEM images for Cu2O nanocubes fabricated by adding the mixture
of AA and NaOH into the solution containing Cu2+ and (a) 4 mL, (b) 2 mL, and (c) 1 mL of 0.05 M PEG.[6]
Figure 1.4. SEM images (a), (b), and XRD pattern (c) of hollow Cu2O spheres
Figure 1.5. SEM (columns 1 and 2) and TEM (columns 3 and 4) images of the Cu2O nanocubes for samples A to F (seed to transfer 5 times). [8]
Figure 1.6. SEM images ((a) to (e)) and EDX spectra (d1 and d2) for the
samples isolated in the time-dependent experiments with glutamic acid.[9]
Figure 1.7. SEM images of Cu2O particles prepared under different pH values:
Figure 1.8. (a) TEM image (inset is the SAED patterns) and (b) HRTEM image of the Cu2O nanorods via solvothermal treatment of CuSO4·5H2O and NaOH in
a mixed solution of ethanol and deionized water at 140 °C for 10 hours.[11]
Figure 1.9. SEM image of Li2O before treatment (A), heat treated at 600 °C for
2 hours in a CO2 flux (B), and scheme of the mechanism proposed for CO2
absorption on Li2O (C).[19]
Table 1.1. Faradaic efficiencies for the products obtained in the electrochemical reduction of CO2 at -2.4 V (Ag/AgCl) on a copper(I) halide-confined Cu-mesh
electrode.[27]
Figure 1.10. (a) The IV curves for CO2 reduction on Pb electrode in 0.1 M
K2CO3 at various time periods. (b) Faradaic current efficiency–potential
diagram for formic acid formation on the Pb electrode in 0.1 M K2CO3 at
different time intervals; (■) 30, (●) 60, (▲) 90, and (▼) 120 min. (c) The image of the electrochemical fixed-bed reactor.[30]
Figure 1.11. Photocatalytic ability of bulk and nanoparticulate BFO on degradation of methyl orange under irradiation of UV-vis and visible light.[34]
Figure 1.12. The mechanisms occurring on TiO2 surfaces exposed to light for
Chapter 2.
Synthesis and Characterizations of
Cuprous Oxide Particles
2.1. Introduction
As the Cu2O with various shapes and sizes demonstrates different physical
properties, the formation of Cu2O with unique morphologies has been pursued
for a long time. In chapter 1, we have already provided the background information in the synthesis of Cu2O. After careful evaluations, we selected
the chemical reduction method to fabricate Cu2O with desirable attributes.
In this research, we investigated the relations between the synthetic parameters and morphologies of the resulting powders. Our objective was to determine the critical processing conditions for specific Cu2O and further to
develop methods in effective morphologic control. We believe the results would enable us to fabricate the Cu2O with unique structures as well as
uniform sizes and shapes. Our study started with various copper(II) ion precursors in different concentrations of surfactant and sodium. Copper sulfide(II), copper(II) acetate, copper(II) nitrate, and copper(II) chloride were chosen as the copper ion sources. Polyethylene glycol with average molecular weight of 200 in different concentrations was used as the surfactant. Sodium hydroxide was used to adjust the pH value of the solution and L-ascrobic acid sodium was employed as the reducing agent. The as-synthesized Cu2O
Electron Microscopy (SEM). We obtained uniform Cu2O particles with
various sizes and shapes through manipulating the synthesis parameters.
The materials and processes for the Cu2O formation are mentioned in the
experimental section (Section 2.2). The correlation between the experimental parameters and the resulting powders are discussed in section 2.3. The conclusions for this work are provided in section 2.4.
2.2. Experiment
2.2.1. Reagents
1. CuSO4‧5H2O Riedel-de Haën, 99 ~ 100.5 %
2. CuAc2‧1H2O J. T. Baker, 98.23 %
3. Cu(NO3)2‧5H2O Riedel-de Haën, 98 %
4. CuCl2‧5H2O J. T. Baker, 99.3 %
5. PEG (av. MW. 200) Fluka 6. L-ascorbic acid sodium SIGMA
7. NaOH Riedel-de Haën, 99 %
2.2.2. Synthetic approaches
The starting solutions were prepared by mixing 10 mL of 0.005 M copper(II) aqueous solutions with 10.0 mL of polyethylene glycol (PEG) at various concentrations followed by shaking for 5 seconds. The concentrations for PEG were 4, 2 and, 1 M, respectively. In separate vessels, 5 mL of 0.5 M L-ascorbic acid sodium (LAAS) and 5 mL of various concentrations of NaOH
were prepared. Subsequently, the LAAS and sodium hydroxide solutions were added into the copper(II) solution with two different procedures (designed as A and B, respectively) . In procedure A, the NaOH solution was added into the solution containing copper(II) and PEG first. After 5 seconds of shaking, the LAAS was injected into the solution followed by shaking for another 5 seconds. In procedure B, the LAAS and sodium hydroxide solutions were mixed initially. Afterwards, the mixture was poured into the solution containing copper(II) and PEG. The solution was shaken for another 10 seconds. After aging for 18 hours, the Cu2O particles precipitated at the
bottom of the vessels with their color appearing in different colors. The precipitates were collected by removing the supernatant liquid. The obtained Cu2O particles were re-dispersed in water and another supernatant liquid
removing process was used as soon as the Cu2O particles re-precipitated at the
bottom of the vessels. Through these processes we fabricated pure Cu2O
particles without surfactant.
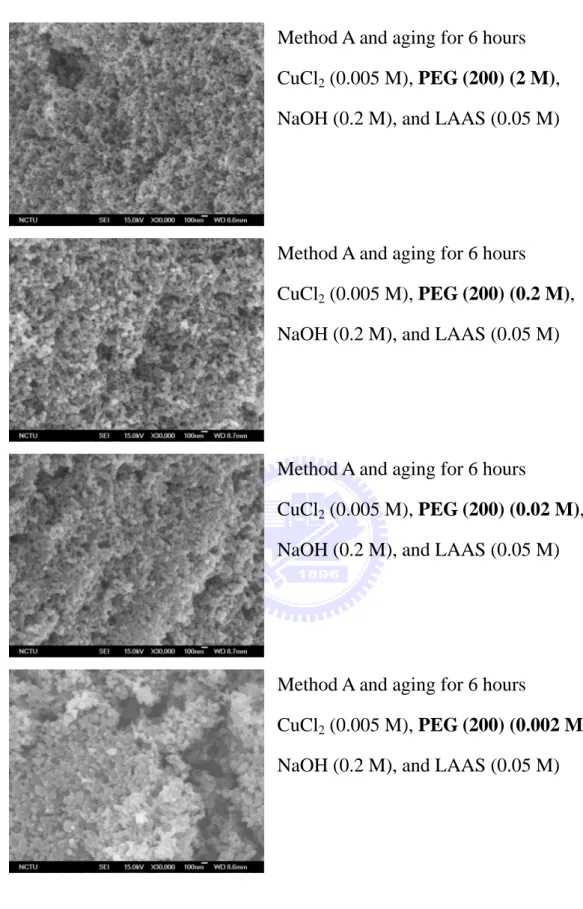
We also adopted the Taguchi Method to find the relation between the products and the experimental parameters. A set of solutions was prepared by mixing 10 mL of 0.005 M copper(II) solutions with 10.0 mL PEG at various concentrations. The concentrations of PEG are 2, 0.2, 0.02, and 0.002 M, respectively. After shaking for 5 seconds, we added NaOH solution with a variety of concentrations from 2 to 0.002 M to the solution containing copper(II) and PEG. The mixture was also shaken for 5 seconds and 0.05 M LAAS was injected into the mixture. After 10 seconds of shaking, the whole solutions were aged for 6 hours to obtain the Cu2O particles precipitating at the
bottom of the vessels. The precipitates were collected by removing the supernatant liquid. The obtained Cu2O particles were re-dispersed in water
and another supernatant liquid removing process was employed as soon as the Cu2O particles re-precipitated at the bottom of the vessels. Through these
processes we fabricated pure Cu2O particles without any precursors.
2.2.3. Materials Characterizations
A. High Resolution X-ray Diffractometer (XRD)
To determinate their crystal structures, the obtained Cu2O particles
were characterized by X-ray diffraction (XRD) using a Bedi D1 diffractometer with Cu Kα radiation in a Bragg-Brentano geometry.
B. Scanning Electron Microscopy (SEM)
The SEM images for the Cu2O particles were taken by a Hitachi JSM
6700F. The samples were prepared by spreading the powders onto a carbon substrate on the sample holder followed by a conductivity improvement step by Pt deposition.
2.3. Results and Discussion
In this section, we discuss the influence of the experimental parameters such as copper(II) ion sources, surfactant concentration, base concentration, and synthetic method on the growth of Cu2O particles.
2.3.1. Characterization on the synthesized Cu2O particles
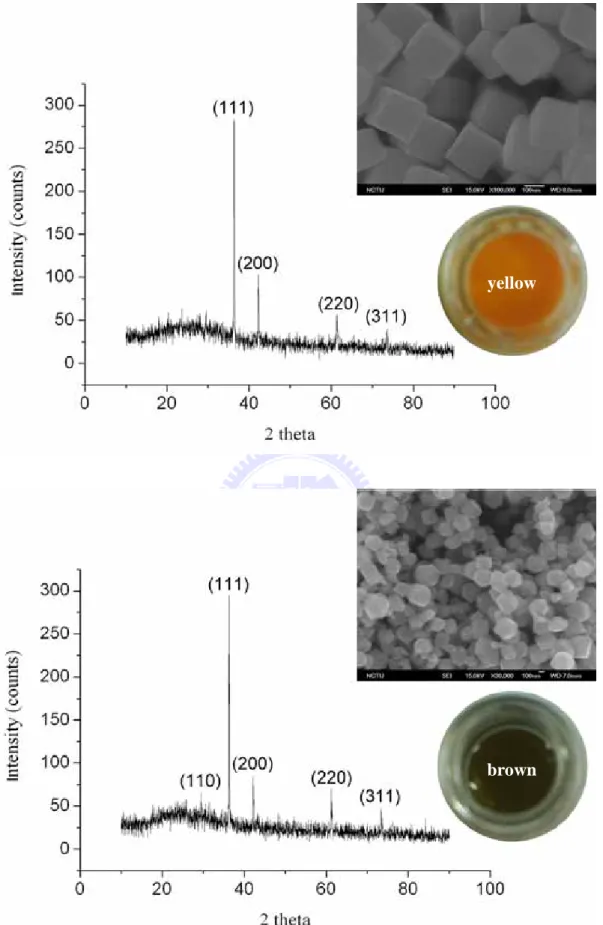
After altering the relevant experimental parameters we obtained the Cu2O
powders with four different colors. The XRD was used to identify their respective phases and the results indicated pure Cu2O phases were present for
all samples. The most intense XRD peak for the Cu2O powder was the (111)
peak followed by the (200), (220), and (311).
The (111) peak was located at 2 theta of 36.4°, the (200) peak was positioned at 2 theta of 42.4°, the (220) peak was located at 2 theta of 61.4°, and (311) peak was located at 2 theta of 73.6°. The (110) peak, which was almost buried in the noises, was located at 2 theta of 29.6°. Figure 2.3 exhibits the XRD data.
We determine the colors of the Cu2O particles corresponding to various
sizes and shapes by SEM images. The Cu2O particles with diameters larger
than 1 µm exhibit red color. The Cu2O cubes with diameters from 300 to
1000 nm appeared in orange color. The Cu2O cubes with diameters from 100
to 300 nm revealed yellow color. The disordered Cu2O particles with
diameter less than 300 nm were brown color.
2.3.2. The influence of surfactant concentration on the Cu2O growth
Surfactants are typically organic compounds containing hydrophobic and hydrophilic groups to reduce the interfacial tension between water and oil. As a general rule, one expects that as the concentration of the surfactant (capping agent) increases, the resulting particle size would be decreased. It is because that the sites for further nucleation and growth are blocked by the
capping agent.
We adjusted the concentration of PEG from 0.002 to 2 M in order to explore the relationship between the particle sizes and surfactant concentrations. The SEM images (figure 2.4) confirmed the results that the morphologies of the Cu2O particles revealed negligible change when we used CuCl2 as the
copper(II) ion source. In contrast, when we used CuAc2 or Cu(NO3)2 as the
copper(II) ion source, 2 M PEG led to the smallest Cu2O particles and the other
concentrations of PEG produced Cu2O particles with identical sizes.
2.3.3. The influence of base concentration on the Cu2O growth
To attain the relation between base concentration and Cu2O particle sizes
we controlled the concentration of the NaOH solution from 0.002 to 2 M. Decreasing the concentration of base from 2 to 0.02 M we obtained the Cu2O
particles with diameters varying from 1570 to 170 nm. However, when we reduced the concentration of NaOH further from 0.02 to 0.002 M, the Cu2O
particles changed their shapes from uniform cubes to irregular spheres.
In thermodynamics, the Pourbaix diagram (figure 2.5) provides the equilibrium phase of a material at various pH and potentials. Through Pourbaix diagram we knew the states of copper ions at equilibrium and possibly their effects on subsequent Cu2O growth. There were other ions such
as Cl-, SO42-, NO3-, and CH3COO- in the solution which may affect the states of
copper ions at equilibrium, but the concentration for those ions were too small to influence the equilibrium states.
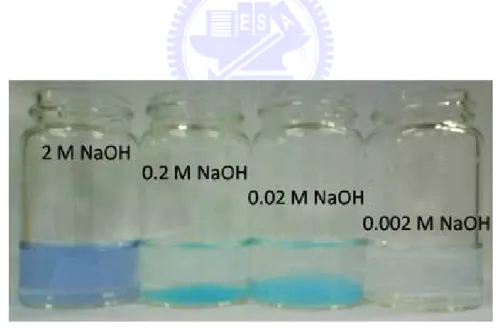
With addition of 2 M NaOH into the solution including copper(II) and PEG, the pH value of the solution was increased over 13 and the solution
became blue, which meant copper(II) existed as CuO22-. The CuO22- in the
solution was likely to be surrounded by Na+. Thus the copper ions used to grow the Cu2O were released slowly and the Cu2O particles were found to
grow gradually. From the SEM pictures at pH of 13 the Cu2O particles was
approximately 1500 nm.
When 0.2 M PEG was added into the solution including copper(II) and PEG, the pH of the solution was increased to 12 to produce Cu(OH)2, which
exhibited blue and small particles suspended in the solution (However, it is to be noted that the observation were inconsistent with the Pourbaix diagram.) The suspended blue particles disappeared instantly when the LAAS was added and the solution changed its color from light blue to orange. The SEM pictures presented that the particle size of Cu2O particles growth at pH of 12 is
about 700 nm.
Adding 0.02 M NaOH into the solution including copper(II) and PEG, the pH value was 11 and the copper(II) in the solution also became Cu(OH)2.
When the LAAS was added into the light blue solution containing suspended Cu(OH)2, the small Cu2O particles appeared with yellow color, changing the
solution color from blue to yellow. The particle size of Cu2O growth at pH of
11 was smaller than that of pH of 12. It may result from the particle size of the Cu(OH)2. We found out that the Cu(OH)2 particles formed in the pH of 12
solution precipitated faster than the particles formed in the pH of 11 solution (shown in figure 2.6). We believe that the particle size of Cu2O at different
pH changed significantly since the copper(II) exists in various forms at different pH values.
2.3.4. The influence of synthetic method on the Cu2O growth
We used two methods (method A and B) in preparing the Cu2O particles to
study the relationship between the synthetic method and morphologies of Cu2O
particles. In procedure A, the NaOH and the LAAS were added into the solution containing copper(II) sources and PEG. In this way we prepared the Cu2O particles with base concentrations from 0.002 to 2 M. On the other
hand, when procedure B (NaOH and LAAS were mixed and injected into the solution containing copper(II) sources and PEG) was used to prepare the Cu2O
particles, the base concentration was higher than 0.2 M. If the base concentration was lower than 0.2 M, the Cu2O particles could not be formed
ever after aging for 6 hours.
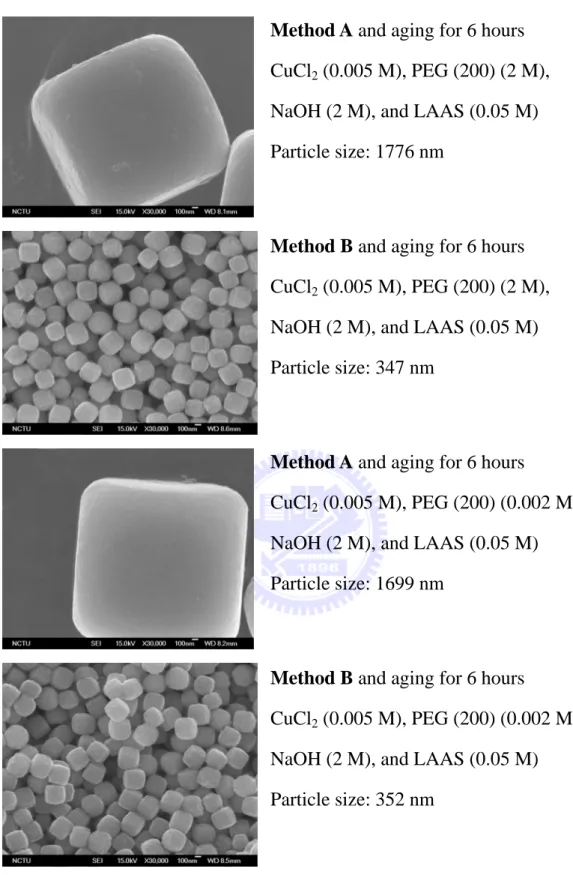
Through SEM pictures we determined that procedure B was able to produce smaller Cu2O particles than procedure A under identical conditions.
We surmise that differences of copper(II) sources in the solutions were responsible. The copper ion sources for procedure A were CuO22- and
Cu(OH)2 when the base concentrations were 2 and 0.2 M. In contrast, the
copper ion sources for procedure B were copper(II) when the base concentrations were 2 and 0.2 M.
2.4. Conclusions
After careful analysis of our data, we come to several conclusions. First, changing the concentration of the surfactant (PEG) plays negligible influence over the particle sizes of the Cu2O. Second, the adding sequence of NaOH
the NaOH was added to the solution containing copper(II) before LAAS, the obtained Cu2O particles were bigger than the particles obtained from adding
NaOH and LAAS simultaneously. Third, adjusting the pH value of the solution leads to distinct particle sizes, a fact from the differences of copper ion sources. Lastly, we have succeeded in synthesizing the Cu2O cubes with
tunable edge length from 1570 to 170 nm through varying the NaOH concentrations of the solutions from 2 to 0.02 M.
Figure 2.1. Illustration of procedure A (above) and B (below), used to grow Cu2O particles.
red
Figure 2.3. Four different sizes of Cu2O particles with four different colors.
yellow
Method A and aging for 6 hours CuCl2 (0.005 M), PEG (200) (2 M),
NaOH (0.2 M), and LAAS (0.05 M) Particle size: 647 nm
Method A and aging for 6 hours CuCl2 (0.005 M), PEG (200) (0.2 M),
NaOH (0.2 M), and LAAS (0.05 M) Particle size: 642 nm
Method A and aging for 6 hours
CuCl2 (0.005 M), PEG (200) (0.02 M),
NaOH (0.2 M), and LAAS (0.05 M) Particle size: 661 nm
Method A and aging for 6 hours
CuCl2 (0.005 M), PEG (200) (0.002 M),
NaOH (0.2 M), and LAAS (0.05 M) Particle size: 655 nm
Method A and aging for 6 hours CuAc2 (0.005 M), PEG (200) (2 M),
NaOH (0.2 M), and LAAS (0.05 M) Particle size: 430 nm
Method A and aging for 6 hours
CuAc2 (0.005 M), PEG (200) (0.2 M),
NaOH (0.2 M), and LAAS (0.05 M) Particle size: 522 nm
Method A and aging for 6 hours
CuAc2 (0.005 M), PEG (200) (0.02 M),
NaOH (0.2 M), and LAAS (0.05 M) Particle size: 605 nm
Method A and aging for 6 hours
CuAc2 (0.005 M), PEG (200) (0.002 M),
NaOH (0.2 M), and LAAS (0.05 M) Particle size: 598 nm
Method A and aging for 6 hours
Cu(NO3)2 (0.005 M), PEG (200) (2 M),
NaOH (0.2 M), and LAAS (0.05 M) Particle size: 927 nm
Method A and aging for 6 hours Cu(NO3)2 (0.005 M), PEG (200) (0.2 M), NaOH (0.2 M), and LAAS (0.05 M)
Particle size: 1109 nm
Method A and aging for 6 hours
Cu(NO3)2 (0.005 M), PEG (200) (0.02 M), NaOH (0.2 M), and LAAS (0.05 M)
Particle size: 1092 nm
Method A and aging for 6 hours
Cu(NO3)2 (0.005 M), PEG (200) (0.002 M), NaOH (0.2 M), and LAAS (0.05 M)
Method A and aging for 6 hours CuCl2 (0.005 M), PEG (200) (2 M),
NaOH (0.2 M), and LAAS (0.05 M)
Method A and aging for 6 hours CuCl2 (0.005 M), PEG (200) (0.2 M),
NaOH (0.2 M), and LAAS (0.05 M)
Method A and aging for 6 hours
CuCl2 (0.005 M), PEG (200) (0.02 M),
NaOH (0.2 M), and LAAS (0.05 M)
Method A and aging for 6 hours
CuCl2 (0.005 M), PEG (200) (0.002 M),
NaOH (0.2 M), and LAAS (0.05 M)
Figure 2.4. SEM images of Cu2O particles synthesized through different
Figure 2.5. Part of the Pourbaix diagram for the Cu in different potentials and pH.
Figure 2.6. The color of the solution after adding 10 mL of various concentrations of NaOH into the solution containing copper(II) and PEG.
Method A and aging for 6 hours
Cu(NO3)2 (0.005 M), PEG (200) (0.2 M), NaOH (2 M), and LAAS (0.05 M)
Particle size: 2513 nm
Method A and aging for 6 hours
Cu(NO3)2 (0.005 M), PEG (200) (0.2 M), NaOH (0.2 M), and LAAS (0.05 M)
Particle size: 1109 nm
Method A and aging for 6 hours
Cu(NO3)2 (0.005 M), PEG (200) (0.2 M), NaOH (0.02 M), and LAAS (0.05 M)
Particle size: 167 nm
Method A and aging for 6 hours
Cu(NO3)2 (0.005 M), PEG (200) (0.2 M), NaOH (0.002 M), and LAAS (0.05 M)
Method A and aging for 6 hours
CuSO4 (0.005 M), PEG (200) (0.2 M), NaOH (2 M), and LAAS (0.05 M)
Particle size: 1273 nm
Method A and aging for 6 hours
CuSO4 (0.005 M), PEG (200) (0.2 M), NaOH (0.2 M), and LAAS (0.05 M)
Particle size: 582 nm
Method A and aging for 6 hours
CuSO4 (0.005 M), PEG (200) (0.2 M), NaOH (0.02 M), and LAAS (0.05 M)
Particle size: 188 nm
Method A and aging for 6 hours
CuSO4 (0.005 M), PEG (200) (0.2 M), NaOH (0.002 M), and LAAS (0.05 M)
Figure 2.7. SEM images of the Cu2O particles synthesized at different pH
Method A and aging for 6 hours
CuCl2 (0.005 M), PEG (200) (2 M),
NaOH (2 M), and LAAS (0.05 M) Particle size: 1776 nm
Method B and aging for 6 hours
CuCl2 (0.005 M), PEG (200) (2 M),
NaOH (2 M), and LAAS (0.05 M) Particle size: 347 nm
Method A and aging for 6 hours
CuCl2 (0.005 M), PEG (200) (0.002 M),
NaOH (2 M), and LAAS (0.05 M) Particle size: 1699 nm
Method B and aging for 6 hours
CuCl2 (0.005 M), PEG (200) (0.002 M),
NaOH (2 M), and LAAS (0.05 M) Particle size: 352 nm
Figure 2.8. SEM images of the Cu2O particles synthesized through different
Chapter 3.
Electrochemical Reduction of Carbon
Dioxide with Gas Diffusion Electrodes
Catalyzed by Cuprous Oxide
3.1. Introduction
Reducing the CO2 atmospheric concentration has become a popular
subject since the CO2 is recognized as one of the primary greenhouse gases that
contributes to the rising temperature. Previously in chapter 1, we mentioned how the other researchers explored practical methods to reduce the CO2
concentration in the atmosphere. In our lab, we adopted the electrochemical reduction method to investigate possible CO2 reduction by gas diffusion
electrodes catalyzed by Cu2O particles.
In this chapter, we report our progress over the influences of the electrolytes and catalysts on the CO2 reducing abilities for the gas diffusion
electrodes catalyzed by the Cu2O. Our objective was to determine whether
the Cu2O could be a desirable catalyst for electrochemical reduction of CO2.
Furthermore, we intended to identify the optimized parameters for CO2
reduction. Three different sizes of Cu2O particles with diameters of 1570, 640,
and 170 nm were chosen as the catalysts depositing on the gas diffusion electrodes. NaHCO3, NaOH, and CaCl2 were used as the electrolytes. The
performances for electrochemical reduction performances were analyzed by a potentiostat. Among those electrodes, we obtained the best result when the
NaOH was used with the Cu2O particles in diameter of 640 nm.
The electrochemical setup, fabrication of gas diffusion electrode, and electrochemical analysis are mentioned in the experimental section (Section 3.2). The correlation between the experimental parameters and electrochemical performances for the electrolytes and catalysts are discussed in section 3.3. The conclusions for this work are provided in section 3.4.
3.2. Experimental
3.2.1. Electrochemical setup
An unique electrolysis cell (shown in figure 3.1.) was designed for electrochemical reduction of CO2 and we employed a potentiostat model 263A
from Princeton Applied Research to characterize the performance of the gas diffusion electrode. The electrolysis cell consisted of a glass container with an electrolyte volume about 600 mL. The Pt plate with a surface area about 8 cm2 was used as the counter electrode and saturated calomel electrode (SCE) was used as the reference electrode. The working area for the working electrode was 2.835 cm2.
3.2.2. Fabrication of gas diffusion electrode
A. Reagents
2. Nafion solution Grand Hand Instrument Co., LTD., 5 wt% 3. Hydrophobic carbon
clothes
Chung- Shan Institute of Science and Technology (CSIST)
4 NaHCO3 J. T. Baker, 100.1 %
5 NaOH Riedel-de Haën, 99 % 6 CaCl2 J. T. Baker
7. As-prepared Cu2O particles with a diameter of
1570 nm
Method: method A and aging for 6 hours Reagents: CuCl2 (0.005 M), PEG (200) (2 M),
NaOH (2 M), and LAAS (0.05 M)
8. As-prepared Cu2O particles with a diameter of
640 nm
Method: method A and aging for 6 hours Reagents: CuCl2 (0.005 M), PEG (200) (0.002
M), NaOH (0.2 M), and LAAS (0.05 M) 9. As-prepared Cu2O particles with a diameter of
170 nm
Method: method A and aging 6 hours
Reagents: CuCl2 (0.005 M), PEG (200) (0.002
M), NaOH (0.2 M), and LAAS (0.05 M)
B. Fabrication process
To fabricate the gas diffusion electrodes we mixed the as-prepared Cu2O particles, 5 wt% Nafion solution, and 99.5 vol% ethanol together.

![HPSH [ 氧化數平衡反應式係數 ]](data:image/gif;base64,R0lGODlhAQABAIAAAP///wAAACH5BAEAAAAALAAAAAABAAEAAAICRAEAOw==)