國 立 交 通 大 學
財 務 金 融 研 究 所
碩 士 論 文
公司治理與
公司治理與
公司治理與
公司治理與競爭者公司
競爭者公司
競爭者公司
競爭者公司破產宣告效果
破產宣告效果
破產宣告效果
破產宣告效果
Do Firms with Poor Corporate Governance Become
More Vulnerable When Competing Firms
Bankrupt?
研 究 生:林以文
指導教授: 鍾惠民 博士
許和鈞 博士
公司治理與
公司治理與
公司治理與
公司治理與競爭者公司
競爭者公司
競爭者公司破產宣告效果
競爭者公司
破產宣告效果
破產宣告效果
破產宣告效果
Do Firms with Poor Corporate Governance Become More
Vulnerable When Competing Firms Bankrupt?
研 究 生 : 林以文 Student : Yi-Wen Lin
指導教授 : 鍾惠民 博士 Advisor: Dr. Huimin Chung
許和鈞 博士 Advisor: Dr. Her-Jiun Sheu
國 立 交 通 大 學
財 務 金 融 研 究 所 碩 士 班
碩 士 論 文
A Thesis
Submitted to Graduate Institute of Finance
National Chiao Tung University
in partial Fulfillment of the Requirements
for the Degree of
Master of Science
in
Finance
June 2008
Hsinchu, Taiwan, Republic of China
中華民國九十七年六月
公司治理與
公司治理與
公司治理與
公司治理與競爭者公司
競爭者公司
競爭者公司破產宣告效果
競爭者公司
破產宣告效果
破產宣告效果
破產宣告效果
研究生: 林以文 指導教授 : 鍾惠民 博 士
許和鈞 博 士
國立交通大學財務金融研究所碩士班
2008年 六月
摘要
本文首先估計 1990 年到 2006 年美國上市公司宣告破產後對於其他同產業間未破產 的存活公司股價之影響,依據每一破產事件逐筆分別形成 equal-weighted 及value-weighted 的 portfolio,再利用所形成的 portflio 計算研究期間破產宣告事件 造成的異常報酬,結果顯示在 1990 至 2000 間存活公司呈現顯著負報酬,顯示傳染效果 主導了整個破產宣告效果;但是 2001 至 2003 為一轉折期,傳染效果及競爭效果皆不顯 著,直至 2004 之後轉變為顯著正報酬,呈現競爭效果主導的狀況。第二部份是探討公 司治理與破產宣告效果的關聯。關於公司治理的議題已經廣泛被討論,而有部分論文指 出公司治理較差的公司股價較脆弱,較容易受到市場的影響,尤其是負向事件發生時, 公司治理差的公司會較好的公司有更大的負向股價波動。因此本文想知道是否公司治理 差的公司,若傳染效果影響主導而產生負報酬時,是否公司治理較好的公司負向報酬會 較公司治理差的公司為小;而相對的,當競爭效果主導時,是否公司治理較好的公司正 報酬會較公司治理差的公司為大。實證結果顯示,公司治理較差的公司在同業其他公司 宣告破產時,雖然不顯著,但公司治理指標與異常報酬間的確存在負向關係,也就是公 司治理較好的公司在同業間有破產事件發生時,將較公司治理較差的公司呈現較高的異 常報酬。 關鍵字:公司治理、併購條款、破產宣告效果、傳染效果、競爭效果
Do Firms with Poor Corporate Governance Become More
Vulnerable When Competing Firms Bankrupt?
Student: Yi-Wen Lin Advisor: Dr. Huimin Chung
Dr. Her-Jiun Sheu
Graduate Institute of Finance
National Chiao Tung University
June 2008
ABSTRACT
This paper examines the value and equal weighted SIC-code based surviving firms’ portfolios around the bankruptcy announcement date during 1990 to 2006. The significantly negative cumulative abnormal returns show that contagion effect dominates during 1990 to 2000, while 2001-2003 is a transition period when neither contagion nor competitive effect dominates. Finally, the significantly positive cumulative abnormal returns display competitive effect dominates during 2004 to 2006. Moreover, I examine whether corporate governance mechanisms, especially the market for corporate control, affect the stock price performance when a firm in the same industry announce for bankruptcy. Consistent with the hypothesis, though not significant, the regression analysis shows negative relation between GIM index and the 11-day cumulative abnormal returns, which means that firms of managers protected by more anti-takeover provisions deed face significantly lower cumulative abnormal returns while competing firms bankrupt.
Keywords: corporate governance; takeover provisions; bankruptcy announcement effect; contagion effect; competitive effect.
誌謝
誌謝
誌謝
誌謝
這篇論文的順利完成,也代表著兩年的交大研究所生活到了一個尾聲,學生生活也 暫告一個結束。我要感謝我的爸爸媽媽,養育我到今天;要感謝我的指導教授鍾惠民老 師,感謝他全力栽培支持我;也要感謝周幼珍老師、趙捷謙老師,感謝他們常常與我聊 天,指導我課業以及待人處事上的細節。更要感謝我財金所的所有好朋友們,因為有他 們的陪伴,讓我的研究生生涯充滿了歡樂。 林以文 九十七年六月 謹誌於 新竹交大
Content
I. INTRODUCTION ... 1
II. LITERATURE REVIEWS ... 3
2.1CONTAGIOUS EFFECTS ... 3
2.2COMPETITIVE EFFECTS ... 4
2.3FACTORS AFFECTING BANKRUPTCY ANNOUNCEMENT EFFECT ... 5
2.4CORPORATE GOVERNANCE ... 8
III. DATA... 11
IV. EMPIRICAL RESULTS ... 14
4.1ABNORMAL RETURNS BASED ON SIC PORTFOLIOS ... 14
4.2ABNORMAL RETURNS BASED ON CORPORATE GOVERNANCE INDEX PORTFOLIOS ... 17
4.3REGRESSION ANALYSIS ... 19
IV. CONCLUSIONS ... 22
List of Figure and tables
FIGURE I DIAGRAMS OF CUMULATIVE ABNORMAL RETURN FOR
DEMOCRACY AND DICTATORSHIP PORTFOLIOS ... 25
TABLE I NUMBER OF EVENTS AND PORTFOLIOS FORMED FOR EACH SIC CODE ... 26
TABLE II NUMBER OF FIRMS MATCHED OF GIM-INDEX AND BCF-INDEX PORTFOLIOS ... 27
TABLE III EQUAL-WEIGHTED ABNORMAL AND CUMULATED ABNORMAL RETURN (1990-2001) ... 28
TABLE IV EQUAL-WEIGHTED ABNORMAL AND CUMULATED ABNORMAL RETURN (2002-2006) ... 31
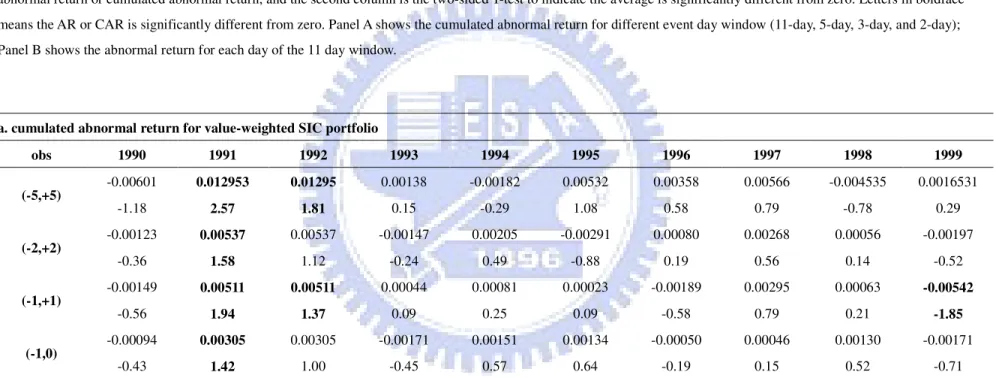
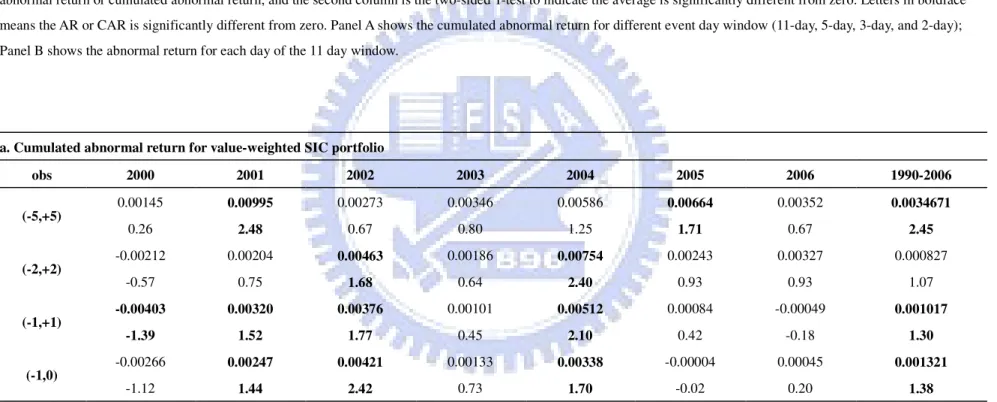
TABLE V VALUE-WEIGHTED ABNORMAL AND CUMULATED ABNORMAL RETURN (1990-1999) ... 34
TABLE VI VALUE-WEIGHTED ABNORMAL AND CUMULATED ABNORMAL RETURN (2000-2006) ... 37
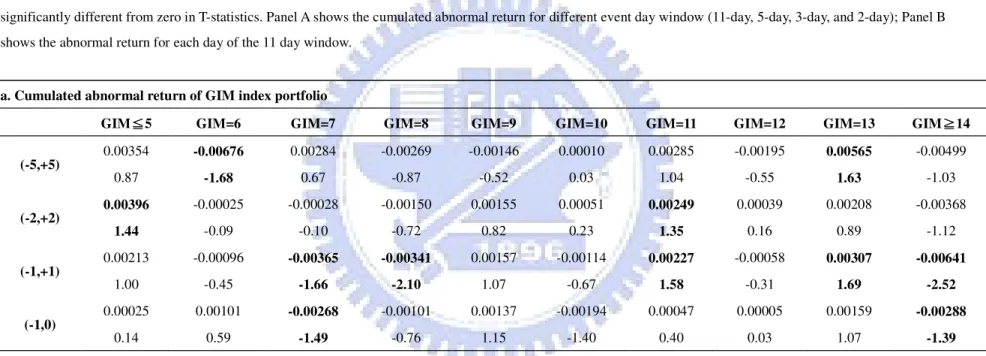
TABLE VII ABNORMAL AND CUMULATED ABNORMAL RETURN OF GIM INDEX PORTFOLIO ... 40
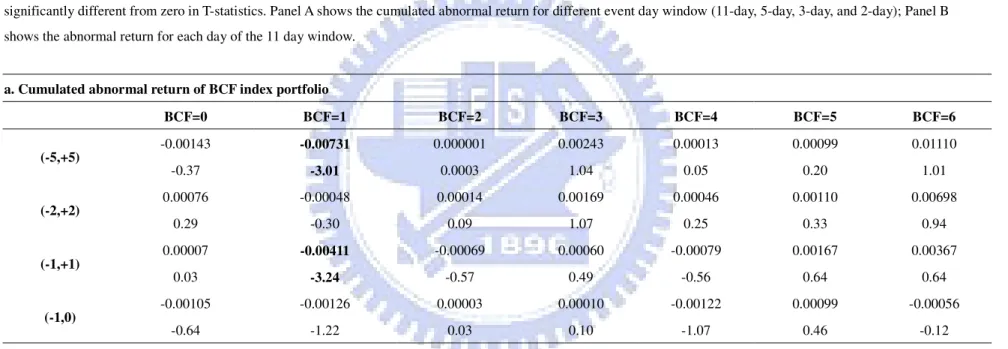
TABLE VIII ABNORMAL AND CUMULATED ABNORMAL RETURN OF BCF INDEX PORTFOLIO ... 43
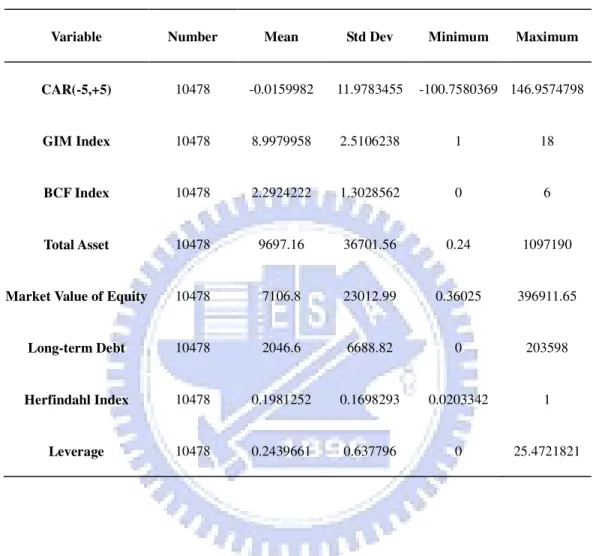
TABLE IX SUMMARY STATISTICS ... 46
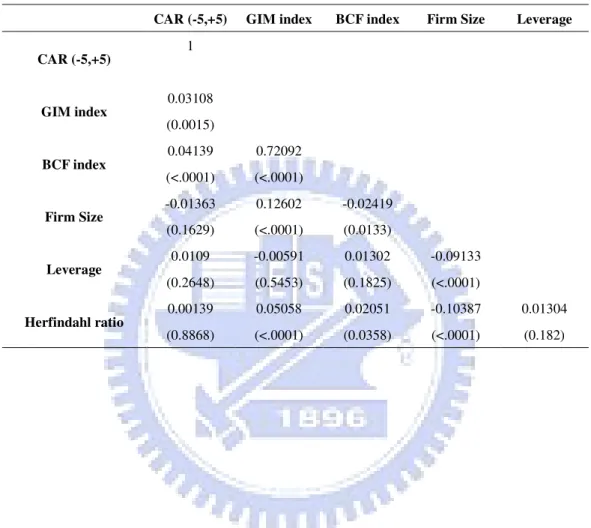
TABLE X PEARSON CORRELATION MATRIX ... 47
I. Introduction
Society has long been of high interests to the nature and extent of linkages between firms in the economy, especially in the case of financial distress. Financial distresses at a firm can more or less result in valuation fluctuations of other relevant surviving firms. From industry rivals to firms on the supply chain (customers and suppliers), announcements of bankruptcy ripples the stock price reaction both in the bankruptcy firm and other existing firms.
Now there are two main hypotheses trying to explain the bankruptcy announcement effect. First is contagious effect: the announcement of bankruptcy results in negative stock price reaction in not only bankrupt firms but also existing firms. The other hypothesis is competitive effect: the existing firms benefit from the bankrupt firms thus exhibit positive stock price reaction.
The common view of contagious effect in the same industry is the wariness of other firms in the same industry are irrespective of the economic health. Another view is considering bankruptcy announcement reveals negative information about the components of cash flows that are common to all firms in the industry, consequently decreases the market’s expectation of the profitability. Therefore, contagious effect should result in negative stock price reaction.
However, for the intuition of competitive effect, the supporters argue that the bankruptcy announcement reveals the inefficiency of the bankrupt firm, thus improves the competitive position of that industry. Moreover, indirect bankruptcy costs lessen the competitiveness of bankrupt firm and hence create profitable opportunities for other firms in the industry. Thus, the stock price of surviving firms should present a positive reaction under competitive effect.
The bankruptcy announcement effect is the mixture of contagious and competitive effects. From the previous literatures, no one can definitely tell which hypothesis is correct. Most of the researches are aiming at which effect dominates the other, or under what kind of circumstances, that the existing firms are more likely to be affected by the certain kind of effect.
The first part we want to present in this paper is whether contagious or competitive effect dominates in the competing industry during January 1990 to December 2006 by forming SIC code based industrial portfolio for each bankruptcy announcement. Further, in the second part, we want to check whether corporate governance plays a role in explaining the abnormal return caused by the bankruptcy announcement effect. The hypothesis is as follow: Does contagion (competitive) effect dominate the bankruptcy announcement effect when firms are of worse (better) corporate governance? Further, if contagious effect dominates, do the firms of better corporate governance suffer less from the negative abnormal return? Vice versa, if competitive effect dominates, do the firms of better corporate governance perform better than bad corporate governance firms?
The following is organized as follows. Section II is the literature reviews. Section III describes the data, sample period, and the methodology. Section IV presents the empirical results, and Section V concludes the paper.
II. Literature Reviews
Most of the papers researching for the topic of bankruptcy are focusing on how investors predict the occurrence of bankruptcy and how firms lessen the risk to default. The first empirical research directly focusing on the effect of bankruptcy announcement is started from Altman (1969) and Clark and Weinstein (1983). They documented that on average, the announcement of bankruptcy filing has a strong negative effect on the value of the filing firm’s stock. But at that time, there is no any empirical approach directly measures how strong and critical the impact is.
Presumably, the stock price falls because of an increase in the present value of bankruptcy costs, and because the bankruptcy announcement provides information about the true value of the firm’s assets and the shareholders’ claim on those assets. But this doesn’t reveal how much of the information is firm-specific or industry-wide, not to mention the details of the possible benefit gained by other competitive firms from the difficulties of the bankrupt firms. In order to specifically separate the different affection from bankruptcy announcements, the existing literatures categorize the effect into two distinct dimensions: the contagious effects and competitive intra-industry effects.
2.1 Contagious Effects
Contagion has been studied in various disciplines. At first, contagious is used in explaining the spread of a disease, now is applied in finance as a behavior of one identity affecting other innocent or similar identity into the same result, such as financial distress. The first empirical study devoted to contagious effect is Bernanke (1983), he takes the context of the Great Depression to show that bankruptcy is contagious within an industry. And Warner (1977) is the first study to report stock returns of competitors after a firm in the same industry making a bankruptcy announcement; though he found no contagion in the railroad industry with monthly returns.
The common view is that a firm’s bankruptcy makes investors wary of the other firms in the same industry also careless of their economic health and hence makes them worse off. Another more benign view of contagion is that the bankruptcy announcement reveals negative information about the components of cash flows that are common to all firms in the industry thus decreases the market’s expectation of the profitability toward this industry.
In sum, the contagious effect resulting from the bankruptcy announcement will cause negative stock return in other surviving firms.
2.2 Competitive effects
The bankruptcy announcement conveys not only bad news for competitors. It can potentially increase the value of the nonbankrupt firms through wealth redistribution. First, the bankruptcy announcement can reveal the less efficiency of bankrupt firms and the competitive position of the other firms in the industry has improved. Second, other firms in the industry can create profitable opportunities from the indirect bankruptcy costs of the bankrupt firms. In simplicity, the bankruptcy announcement should improve the competitive power of non-bankrupt firms in the same industry; hence the wealth redistribution from the bankrupt firm to the surviving firms raises the stock prices of these firms.
The early statement of this hypothesis is from Altman (1984). And he also argues that competitive effect hypothesis should generate more significant positive effects in the more concentrated industry. In short, the competitive hypothesis supports the view that a bankruptcy announcement can convey information about how well firms performs relative to the bankrupt firms in the industry, hence result in the wealth distribution within the industry, then raise the stock prices of these companies and generate positive stock return.
Not only after Lang and Stulz (1992) presented the first empirical study directly measure whether contagion or competitive effect dominates the bankruptcy announcement effect in competing firms (the same industry), do other following empirical researches notice of this
topic. Lang and Stulz (1992) directly measure the bankruptcy announcement effect during the period of January 1970 to December 1989 of firms with more than $120 million in liabilities, and find a significant -1% in the portfolio of competitors.
Following is Haensly, Theis, and Swanson (2001), using the same sample period as Lang and Stulz (1992), they found that the significant contagious effect in 1970 to 1980 may be restricted by a single legal regime, without it, the bankruptcy announcement is unclear.
Another empirical paper from Ferris, Jayaraman, and Makhija (1997) extends the scope to take all the firms in the competitor industry into accounts and separate them into larger and smaller firms due to the listed exchange during January 1970 to December 1989. They also find contagion effect dominates though the magnitude is much smaller than what is found by Lang and Stulz (1992) and ambiguous existence of competitive effect.
A more recent paper regarding the bankruptcy announcement effect is from Hertzel, Li, Officer, and Rodgers (2008), enlarging the scope of the intra-industry valuation consequences to the effects along the supply chain, though they don’t find significant results in demanders, the distress related to bankruptcy filings is associated with negative and significant stock price effects for suppliers and competitors for the period from January 1978 to December 2004.
2.3 Factors affecting bankruptcy announcement effect
Following are factors considered and discussed by the literatures as influencing factors in the bankruptcy announcement effects.
1. Leverage
From the MM optimal capital structure theory, the cost of issuing debt is less than the cost of issuing equity. Moreover, issuing debt can signal the investors of the better credit-worthiness of the firm. However, as the debt ratio getting higher, the higher the bankruptcy cost the company will have. This is known as capital structure trade-off theory. In the application of the bankruptcy announcement effect, leverage is of high correlation.
How leverage relates to the contagion effects?
Intuitively, the higher the leverage ratio, the more likely the competitor firms suffer from the contagious effect. The greater the leverage ratio is, the greater the increase in the present value of direct bankruptcy costs, thus the value of equity is more vulnerable to the changes in the total value of the firm. In short, if the bankruptcy filing conveys negative information about the industry, all else being equal, the greater the leverage is, the larger the percentage fall in equity of nonbankrupt firms. Lang and Stulz (1992) show a significant negative abnormal return in the portfolio of firms with leverage ratio above median, which implies that higher leverage increase the level of contagious effect.
How leverage related to competitive effects?
For given cash flows accruing to nonbankrupt firms, the competitive effects should be stronger in high leverage firms; however, the high leverage reduces firms’ ability to invest and hence prevent firms to gain the benefit of the bankrupt firms. Bolton and Scharfstein (1990) provide an explicit model to prove that low leverage firms can prey on a highly leveraged firm for its lack of flexibility to respond to changes in market conditions. As a consequence, leverage is ambiguous in the competitive effect. Thus, leverage magnifies the contagion effect rather than the competitive effect,
In Lang and Stulz (1992), taking the sample median as a critical point for the high and low leverage level, gets a coordinate result that the high-leverage samples’ abnormal stock return is significantly negative whereas the low-leverage is of positive but insignificant abnormal return. The afterwards research from Ferris, Jayaraman, and Makhija (1997) apply leverage only to the portfolio of competitive effect with companies survive more than three years after the bankruptcy announcement. But the competitive effect is still ambiguous in their test.
In short, leverage magnifies contagion but is ambiguous in competitive effect, hence leverage is used as measuring contagious effect in the bankruptcy announcement
literatures.
2. Degree of competition
According to literatures, the degree of competition affects the degree of competitive effect, but with no direct connections to contagious effect. Scholars argue that if the market is of imperfect competition, the bankrupt announcement of one firm is positive information for other firms in the industry for they will expect an increase in demand from an imperfectly elastic demand curve.
Lang and Stulz (1992) categorize the degree of competition with the Herfindahl ratio, which is the most traditional measure of concentration used in the industrial organization literature and is widely viewed as a proxy for imperfect competition. Since the competitive effect increases with the degree of concentration whereas the contagion effect is unrelated to concentration, as expected, Lang and Stulz (1992) get the result of significantly lower average abnormal return for the industry with lower Herfindahl index. For industry concentration, Ferris, Jayaraman, and Makhija (1997) also use the median of Herfindahl Index as a measurement; however, they apply only to the sample of competitors that do not file for Chapter 11 in the next three years. Unfortunately, they have a result opposite to expected.
3. Interaction of leverage and the degree of competition
Lang and Stulz (1992) suggest that since the competitive effect increases the equity value of competitors whereas the contagion effect decreases it, one would expect industries with the strongest competitive effect to have significantly higher abnormal returns than industries of the strongest contagion effect. As a result, the competitive effect should be strongest for the sub-sample with low leverage and a low degree of competition, whereas the contagion effect should be highest for the sub-sample with high leverage and a high degree of competition and Lang and Stulz (1992) get a coincide result.
The contagion effect is expected to be larger for industries with similar investments to the bankrupt firm. Lang and Stulz (1992) use the correlation of returns between the competitors and the bankrupt firm as proxy and the sample median as the deviation point. Although the industries with returns highly correlated with the bankrupt firm show significantly lower abnormal returns than the other industry portfolios, this measurement of similarity is highly negatively correlated with the Herfindahl index. Thus, it is still controversial to use the correlation of returns as representative factor for similarity of cash flows.
5. Separation of large and small firms
Lang and Stulz (1992) measure the bankruptcy announcement effect with only the bankruptcy liability more than 120 million, Ferris, Jayaraman, and Makhija (1997) extend the scope to all of the bankrupt files of the same period. Ferris, Jayaraman, and Makhija (1997) regard the NYSE/AMEX-listed bankrupt firms as large firm samples, and NASDAQ-listed bankrupt firms as small firm samples. Though the small firm samples react later than other categories, for the liquidity constraint, all of the categories show significant dominant contagious effects.
2.4 Corporate Governance
As Adam Smith (1776) said: “When ownership and control of corporations are not fully coincident, there is potential for conflicts of interest between owners and controllers.” After that, the paper from Jensen and Macklin (1985) raised the theory of agency problem; since then, the conflicts between managers and shareholders has long been the researching topics for the financial scholars. Especially after a serious of huge financial scandals such as Enron and other corporate crimes, investor protection gains more and more attention both from the market and academics.
generations and corporate governance mechanism is also separated into two dimensions: internal and external governance. Internal governance mechanisms are board of directors and ownership structure, while external governance mechanisms are the takeover market and the legal system. The first generation focusing more on the discussion on the internal governance mechanism, as for the second generation, external governance attracts more attention.
As Johnson, Boone, Breach and Friedman (2000) and Chung (2006) show, firms of poor corporate governance will be more financially vulnerable, for they find the magnitude of decline in the stock market is negatively related to the degree of investor protection.
But what is the standard to corporate governance?
The focus of the criterion to corporate governance changes through time. But as the second generation of corporate governance suggests, now focus more on the external governance mechanism. Especially the takeover market, in US called ‘a court of last resort’, is an important corporate governance mechanism to monitor whether assets are being utilized to full potential. Poorly performing firms are more likely to be targets of takeover attempts and the managers of poorly performing firms are more likely to be fired. That is to say, if a company has more anti-takeover clauses such as golden parachutes, the more unlikely it will be takeover, thus the manager will be more protected from being fired and is more likely to exploit the benefit from shareholders.
The IRRC publications cover 24 unique anti-takeover provisions, from which Gomper, Ishii, and Metric (GIM, 2003), Bebchuk, Cohen, and Ferrell (BCF, 2004) have construct their governance index by adding one point for each provision that enhances managerial power. GIM index takes all of the provision into consideration while BCF index extend the GIM results by creating a more parsimonious ATP index based on the six provisions that they consider to be the most important from a legal stand point: staggered boards, limits to shareholder bylaw amendments, limits to shareholder charter amendments, supermajority requirements for mergers, poison pills, and golden parachutes. Both of them document
negative relations between indices of anti-takeover provisions (ATPs) and both of long-run stock return performance and firm value.
In this paper, I want to directly examine the impact of a firm’s antitakeover provisions on the surviving firms while other firms in the same industry announce for bankruptcy.
Gompers, Ishii, and Metrick (2003) extract 24 anti-takeover provisions as measurement of corporate governance, called GIM index. The intuition is like this, the more anti-takeover provisions are adopted, the more protection to managers, hence results in the increase of agency costs to the company and the decrease of the firm value. For each point is given to a firm for one more anti-takeover provision is adopted, the higher the G-index, the worse the corporate governance is. This paper also shows the existence of abnormal positive stock returns in the portfolios of well-governance companies during the period of 1990-1999.
While GIM index is based on 24 ATPS, Bebchuk, Cohen, and Ferrell (BCF, 2004) construct another BCF index based on 6 out of 24 ATPs from GIM. They think that these 6 ATPs are enough for representing corporate governance than the 24 ATPs from GIM index. In this paper, I check daily and cumulative abnormal return for both of the index categories and see that whether corporate governance a significant factor to the degree of contagious or competitive effects resulting from the bankruptcy announcements.
III. Data
For the restriction of the historical data of GIM and BCF index, the sample period is from January 1990 to December 2006.
The definition of bankruptcy will follow the United States Bankruptcy Code Chapter 11. The reason why we exclude the bankruptcy events from United States Bankruptcy Code Chapter 7 are the data restriction and individual bankruptcy events included in Chapter 7 includes, which are easily diluted by bankruptcy announcement effect by individual person. In order to focus on the effect contributed only by firm level bankruptcy announcement, this paper considers only the bankruptcy effect reported by Chapter 11.
The list of all the bankruptcy filing firms is from the SDC platinum database. And the data of return is from CRSP database (Center for Research in Security Prices). The surviving firms’ indentities are from CRSP and Compustat, and the data of GIM index will be downloaded from the website of Metricks while BCF index is from Bebchuk’s website. The number of original bankruptcy events from January 1990 to December 2006 in SDC database is 2245. After deleting the cases of no other firms in the same SIC (Standard Industrial Classification) code, there remains 2145 bankruptcy filing during January 1990 to December 2006. Table Ι shows the detailed statistics of the event number of bankruptcy filing and the industries (based on SIC code) involved.
【 【 【
【Insert Table Ι here】】】 】
To calculate abnormal returns, both the value-weighted and equal-weighted portfolios are formed for each SIC code following Lang and Stulz (1992), but all of the firms in the same SIC code are involved. The bankruptcy announcement effect is measured by market model stock returns around bankruptcy announcement of the same 4-digit SIC code industry. I compute 2-day, 3-day, 5-day and 11-day cumulative abnormal returns (CARs), where event day 0 is the bankruptcy announcement date. The event date is the date recorded in the financial restructuring in SDC database. The abnormal return on a particular day is computed
as a market model residual, where the parameters of the market model are estimated from -205 to -5 days before the distress date in SDC database, the market portfolio is the CRSP value-weighted and equal-weighted portfolios, and t-statistics are used to evaluate the significance of the abnormal returns of the industry portfolios and the individual surviving firms.
I first calculate the abnormal returns with all of the bankruptcy announcements during the sample period then calculate abnormal returns for each year to see the bankruptcy announcement effect on yearly and periodic bases.
Market Model:
it i i mt
E[R ]=α β+ R× +εi it
R :Return for each existing firm ]
[Rit
E :Expected return for each existing firm Rmt : Market return
The calculation of abnormal returns and cumulative abnormal returns will all follow the event study method.
After computing the average abnormal returns for each industry, the next step is to expand to individual competitive firm. We get individual firms’ return data from CRSP and characteristic data from Compustat. Then, we merge the competitive companies with the company data of GIM and BCF index by ticker, and get 1620 matching firms and 11084 firm events during 1990 to 2006. The number of firm events in each GIM and BCF index portfolio and the matching individual companies are provided in Table II.
【 【【
【Insert Table II here】】】】
The next step is using returns of competitive firms with GIM and BCF index data to calculate abnormal returns for each GIM and BCF index portfolios during the sampling period to see whether the contagion effect dominates or the competitive effect dominates in each portfolio. The categorization of GIM portfolios will follow Gompers, Ishii, and Metrick
(2003) by separate the firms into ten categories by GIM index: G-index smaller than 5 will be categorized as democracy portfolio while G-index larger than 14 will be viewed as dictatorship portfolio. Afterwards, equal-weighted portfolios according to the 10 GIM categories are formed to see whether the negative abnormal returns (or positive) are decreasing (increasing) with the lower (higher) GIM index. In addition, I especially separate the G-index portfolios into democracy (with G-index less than 5) and dictatorship (with G-index more than 14) to see whether the negative (or positive) abnormal return of the democracy portfolio is significantly smaller (larger) than the dictatorship portfolio.
The same approach are also applied to BCF index following Bebchuk, Cohen, and Ferrell (BCF, 2004) into 7 categories (from BCF=0 to BCF=6). Equal-weighted portfolios are also formed for the 7 BCF index categories.
IV. Empirical Results
The abnormal returns of SIC based portfolios will be presented in the first part of the result. The second part is the abnormal return based on corporate governance portfolios.
4.1 Abnormal returns based on SIC portfolios
From the SDC financial restructuring database, we got 2145 bankruptcy events during January 1990 to December 2006, and formed 2145 SIC portfolios form each bankruptcy event during the sample period. As Lang and Stulz (1992), each bankruptcy event will form one equal-weighted and value-weighted SIC portfolio to represent the reaction of the surviving firms of the SIC industry. The bankruptcy events recorded in SDC database are of similar number as reported by Hertzel, Li, Officer, and Rodgers (2008) before 1998; however, after 1998, the events recorded is much more than Hertzel, Li, Officer, and Rodgers (2008). For the SDC database recorded each Chapter 11 bankruptcy announced by the court, and thus includes a lot of relatively small firms.
We use the SIC code provided by SDC to finds out companies representatives of each SIC industry from both of COMPUSTAT and CRSP database. Based on the return availability on CRSP, I formed value-weighted and equal-weighted portfolios of each SIC portfolio for each bankruptcy event. The average abnormal return of industry portfolios is the equally-weighted average return of all of the value-weighted and equal-weighted portfolios of certain period and of certain year. Table III and IV document the equal-weighted and Table V and VI document value-weighted abnormal and cumulative abnormal returns based on each SIC industry during January 1990 to December 2006.
【 【【
【Insert Table III, IV, V, and VI here】】】】
During the sample period of January 1990 to December 2006, the equal-weighted portfolio shows significant negative cumulative abnormal return of -0.161% on the three-day window (1day before and after bankruptcy announcement) while value weighted portfolio
shows significant positive 0.3467%, 0.1017% and 0.1321% cumulative abnormal returns separately on 11-day (5 days before and after bankruptcy announcement), 3-day and 2-day window (one day before bankruptcy announcement to the event date). The contrary results of equal-weighted and value-weighted can also be seen on the abnormal returns and cumulative abnormal returns on the yearly bases. Except years of 1990, 1994, 1999 and 2002-2006, all of other years in the value-weighted portfolio during the sample period exhibit opposite results of abnormal returns while equal-weighted get the opposite trend. We think the reason might be the much larger bankruptcy events we got compared to other related literatures. Most of the literatures focus on large bankruptcy events, such as liability more than $120 million dollars, and the bankruptcy events recorded by SDC database are of greater amounts compared to the latest paper of Hertzel, Li, Officer, and Rodgers (2008). Thus, the opposite results may be affected by the relatively small bankruptcy in industry, for small bankruptcy affects smaller firms more than larger firms in the same industry. Equal-weighted portfolio is more capable of showing the effects of all firms while value-weighted portfolio is affected more by the large companies. Thus, I focus on equal-weighted portfolio to try more abnormal returns for different period. Both on the value-weighted and equal-weighted portfolios demonstrate positive abnormal returns and cumulative abnormal returns from 2002 to 2006, though not all of them are significant, there seems to exist a timely trend in the bankruptcy announcement effect. After separating equal-weighted portfolios into different periods, the 1990-2000 portfolio shows significant negative -0.561%, -0.447%, -0.479%, -0.258% individually on 11-day, 5-day, 3-day and 2day window. But after adding years of 2001 to 2003, the significance of negative return decrease. The 11-day window cumulative abnormal returns are no longer significant, while the significance of 5-day, 3-day, and 2-day window decrease as well. As a result, I calculate the cumulative abnormal from 2001 to 2003 and find 0.402% significant positive cumulative abnormal return on 11-day window, but insignificant results in other day windows. However, the positive significance appears after adding the year from
2004 to 2006. The 11-day and 5day window of 2003-2006 portfolio display significant positive cumulative abnormal of 0.325% and 0.260%, and 2004-2006 portfolio exhibit even more significant positive cumulative abnormal returns, 0.559%, 0.378% and 0.247% separately, on 11-day, 5-day, and 3-day window. The empirical results shows that, contagion effect dominates the bankruptcy announcement effect during 1990 to 2000, while neither contagion nor competitive effect dominate from 2001 to 2003, and competitive effect dominate the bankruptcy announcement after 2004. That is to say, bankruptcy announcement reveals more bad news than good news to other firms in the same industry from 1990 to 2000, for the average cumulative abnormal returns display significantly negative during this period. But after 2004, the situation changed, bankruptcy announcement becomes positive events to competing firms of the same industry, and the average cumulative abnormal returns inversely display significant positive in this period. The period of 2001 to 2003 is the transition period when cumulative abnormal returns are insignificant and neither of the effects dominates. According to literature related to bankruptcy announcement effect, almost all of the empirical results suggest that contagion effect dominates the bankruptcy announcement effect, and only of certain circumstances that competitive effect appears, thus the empirical results from 1990 to 2000 is consistent to the former studies.
But why there is a twist in bankruptcy announcement effect of the same industry during 2001 to 2006? One of the possible reasons is that during 2000 to 2003 U.S. is in the age of turbulence. From the internet bubble in 2000 to Enron, WorldCom, and 911 attacks in 2001 to 2002, the economy in U.S. is in recession. According to Table I, the number of bankruptcy announcements increase sharply from 2000, reach the highest peak of 390 in 2001, and go back to normal level after 2004. During the age of uncertainty like 2001 to 2003, a lot of unhealthy firms announce for bankruptcy and the market enters into reorganization. The elimination mechanism in the market enhances the efficiency in the industry, and consequently results in the afterward competitive effect dominated period.
4.2 Abnormal returns based on corporate governance index portfolios
GIM index is constructed by Gompers, Ishii, and Metrick (2003) from 24 individual anti-takeover provisions (ATPs) announced by IRRC publications, and the more of the ATPs are adopted by a firm, the more protection for the managers from being supervised from the outside market, and resulted in worse corporate governance. BCF index is of similar intuition, but Bebchuk, Cohen, and Ferrell (2004) specifically choose 6 ATPs from the 24 ATPs suggested by Gompers, Ishii, and Metrick (2003) and argue that the 6 ATPs they chose are enough for representing corporate governance. Therefore, BCF index ranges from 0 to 6, and the higher the BCF index, the worse the corporate governance is.
Because GIM and BCF index update only in 1990, 1993, 1995, 1998, 2000, 2002, 2004, and 2006, years without renew GIM and BCF index will be merged with the former updated data. Following Gompers, Ishii, and Metrick (2003) and Bebchuk, Cohen, and Ferrell (2004), I match the GIM and BCF index recorded firms with surviving firms of the bankruptcy announcement industry, and get 11,084 matched firm events (1620 individual firms) with available return and characteristic data from CRSP, COMPUSTAT. Afterwards, following Gompers, Ishii, and Metrick (2003) separate firms into 10 GIM index groups and Bebchuk, Cohen, and Ferrell (BCF, 2004) separate firms into 7 BCF groups, I run the abnormal returns and cumulative abnormal returns separately for each corporate governance portfolio.
【 【 【
【Insert Table VII and VIII here】】】 】
Table VII exhibits the results for the 10 GIM index portfolios and Table VIII shows the results of the 7 BCF index portfolios.
The empirical result of BCF index doesn’t show any trend between abnormal returns and corporate governance. Although the abnormal return on the event date (day 0) seems to show the better corporate governance (BCF=0) portfolio exists positive abnormal return while the worst governance portfolio (BCF=6) shows negative abnormal return, they are all insignificant. Referring to the cumulative abnormal return on different day window, there is
neither trend of decreasing positive nor increasing negative cumulative abnormal returns from better corporate governance portfolio (BCF=0) to worse corporate governance portfolio (BCF=6). Except in the portfolio of BCF=1 shows significant negative cumulative abnormal returns of -0.731% and -0.411% on 11-day and 3-day window, all of other portfolios show insignificant results. That is to say, BCF index doesn’t appear to have negative relation to the abnormal and cumulative abnormal returns around bankruptcy announcement date.
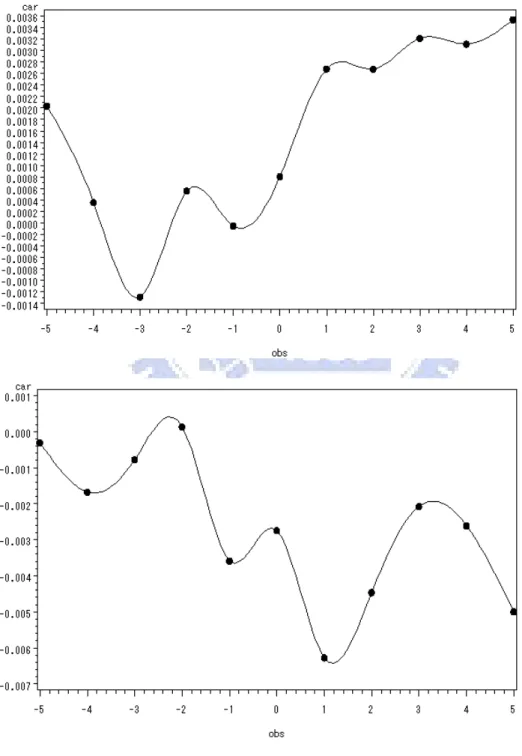
However, there seems to be relation between GIM index and bankruptcy announcement effect in the results of GIM index portfolio. Panel a of Table VII shows significant positive cumulative abnormal return of 0.396% in the better governance portfolio (GIM≦5) while portfolio of worse governance (GIM≧14) show significant negative cumulative abnormal returns of -0.641% and -0.288% separately on 3-day and 2-day window. Although there is still no significant trend of decreasing positive nor increasing negative from better governance (GIM≦5) to worse governance (GIM≧14) portfolio, the categories of democracy portfolio (GIM≦5) and (GIM≧14) seems to follow the intuition of competitive effect dominate in firms of better corporate governance while contagion effect dominate the firms of worse corporate governance. The CAR graphs of democracy and dictatorship portfolio are provided in figure 1. The CAR graphs in figure I also seems to support that firms with higher GIM index deed show negative abnormal return and firms with lower GIM index shows positive abnormal return when competing firm announcement for bankruptcy.
【 【 【
【Insert Figure I here】】】 】
In order to check for the relation between cumulative abnormal returns (CAR) and the corporate governance index (GIM and BCF index), I further apply regression analysis taking CAR as dependent variable, corporate governance indices as key explanatory variable, and some firms’ characteristics as control variables.
4.3 Regression analysis
The bankruptcy announcement effect is measured by market model stock returns around bankruptcy announcement of the same 4-digit SIC code industry. We choose 11-day
cumulative abnormal returns (CARs) as dependent variables, GIM and BCF indices as the key explanatory variables. Since they are highly correlated with each other, the paper separately examines their effects on bankruptcy announcement cumulative abnormal returns. From the inconsistency between results of equal-weighted and value-weighted SIC portfolio abnormal returns, firm size seem to play a role in the bankruptcy announcement effect. As a result, we take firm size as one of the control variable in the regression analysis. Besides, prior
literatures related to bankruptcy announcement effect also take leverage ratio (measuring firms’ financial flexibility), and Herfindahl ratio (measuring the degree of competition in the market) in to consideration and found significant result in explaining whether contagion or competitive effect dominate, we put these two variables into the regression analysis as control variables. The empirical results of the prior section indicate that there exist a transition during the sampling period of 1990 to 2006, thus we suspect that there exists a nonlinear correlation between the cumulative abnormal returns and the main explanatory variables. In order to be more specific in controlling other affecting factors, we also put the four interaction terms into regression function. Herfindahl ratio represent the competition level in one industry, the larger the Herfindahl ratio, the more the industry incline to monopoly and less competition. Thus, intuitively, if the market is more competitive, more firms and products investors can choose from, and the abundance of substitutes will force the firms to perform better and should be of better governance. In order to capture the effect, we put Herfindahl ratio×GIM index and Herfindahl ratio×BCF index into regression analysis. As to the interaction terms of
Leverage×GIM index and Leverage×BCF index, they are computed to capture whether firms of better corporate governance will be less restrain in management investment decision. Table IX shows the summary statistics of all of the variables and Table X shows the correlation
matrix.
【 【 【
【Insert Table IX and X here】】】】
Firm size is computed by logarithm of market value of equity following Palia (2000), leverage ratio is calculated by firm’s long-term debt divided by firm’s total asset, I computed the statistics of original variables of market value of equity , total assets and total long term debt. Herfindahl ratio is constructed from the sales of the competitors for the whole industry with all firms in COMPUSTAT with the same primary four-digit SIC code even of firms with no corresponding stock returns.
The minimum of GIM index in the sample group is 1 while the maximum is 18, the mean is almost 9. The average 11-day CAR displays -0.0134% around the bankruptcy announcement date, but the average 5-day CAR displays 0.1111%. The mean of Herfindahl ratio is 0.2 indicate that the sample firms are of more competitive industry, for the mean is much lower than monopoly (Herfindahl ratio=1). The average leverage is 0.24, which suggests that most industries in the sample are not highly leveraged.
The regression models are as follows:
1 2 3 4 5 6 ( 5, 5)t t t t t t CAR − + =
α
+β
G +β
FS +β
Lev +β
H +β
H×G+β
L G× +ε
... (1) 1 2 3 4 5 6 ( 5, 5)t t t t t t CAR − + =α
+β
B +β
FS +β
Lev +β
H +β
H×B+β
L×B+ε
... (2) The first model is for GIM index and the second one is for BCF index.I present results for regression models of 11-day CAR in Table XI, and the regression is adjusted for heteroscadasticity.
【 【 【
【Insert Table XI here】】】 】
According to the hypothesis, if contagion effect dominates, firms with worse corporate governance (higher GIM or BCF index) will display more negative abnormal return than better governance firms (lower GIM or BCF index). Vice versa, if competitive effect dominates, firms with worse corporate governance (higher GIM or BCF index) will display
less positive abnormal return than better governance firms (lower GIM or BCF index). That is to say, corporate governance index should be negatively related to the cumulative abnormal returns and the coefficient of regression should be negative.
The result of BCF index regression is of insignificant positive coefficient of 11-day CAR, which is consistent with the former portfolio CAR analysis, but against the hypothesis.
However, the coefficient of CAR with GIM index is also insignificant but negative and is consistent with the hypothesis, which means that no matter contagion or competitive effect dominate, firms with more antitakeover provisions deed experience lower abnormal return while other firms in the same industry announce for bankruptcy. The GIM index result is consistent to the former portfolio CAR analysis, for the stock price of firms with worse corporate governance is considered more vulnerable to market fluctuation.
The inconsistent result in BCF index may be affected by the much less ATPs under consideration compares to GIM index. Although GIM index regression displays negative coefficient but is also of insignificance. From the former portfolio analysis and CAR diagrams, there seems to be apparent negative relation between CAR and GIM index under democracy (GIM≦5) and dictatorship (GIM≧14) portfolios. The reason may be other portfolios of GIM index are not of obvious trend, and most of the samples are in these portfolios thus lessening the significance. Another reason might because of GIM and BCF index has a stronger association with long-run stock returns and firm value while CAR around bankruptcy announcement is the short-term stock returns and is affected by more other factors.
IV. Conclusions
This paper examines the value and equal weighted SIC-code based surviving firms’ portfolios around the bankruptcy announcement date during 1990 to 2006. The significantly negative cumulative abnormal returns show that contagion effect dominates during 1990 to 2000, while 2001-2003 is a transition period when neither contagion nor competitive effect dominates. Finally, the significantly positive cumulative abnormal returns display competitive effect dominates during 2004 to 2006. The inconsistency of this result may be affected by the market adjustment during 2000 to 2003, for some large scale defaults of companies as Enron, negative event as 911 attacks, and the internet bubble. Most of the bankruptcy events happened during this period, and thus eliminate the inefficient firms from the industry, which resulted in the competitive effect dominated period of 2004 to 2006.
Moreover, I examine whether corporate governance mechanisms, especially the market for corporate control, affect the stock price performance when a firm in the same industry announce for bankruptcy. The hypothesis is firms of more anti-takeover provisions (worse corporate governance with higher GIM and BCF index) will display more negative abnormal returns when contagion effect dominates, and less positive abnormal returns when competitive effect dominates. To dress in another way, corporate governance index should be of negative coefficient to cumulative abnormal returns.
The regression analysis shows consistent but insignificant result in GIM index regression that firms of managers protected by more anti-takeover provisions deed face significantly lower cumulative abnormal returns while competing firms bankrupt. The result may be affected by the sample restriction, for bankruptcy announcements are clustering in some of the industry and firms, and it can also be that GIM and BCF index has a stronger association with long-run stock returns and firm value while CAR around bankruptcy announcement is the short-term stock returns and is affected by more other factors.
References
Aharony, J., Swary, I., 1983. Contagion effects of bank failures: Evidence from capital markets. Journal of Business 56, 305-322.
Altman, E., 1969. Bankrupt firms’ equity securities as an investment alternative. Financial
Analyst Journal, July-Aug., 129-133.
Altman, E., 1984. A further investigation of the bankruptcy cist question. Journal of Finance 39, 1067-1089.
Altman, E., 1990. Investing in distressed securities. Mimeo. (New York University, New York, NY).
Bebchuk, L., Cohen, A., Ferrell, A., 2004. What matters in corporate governance? Working
paper, Harvard Law School.
Bernanke, Ben S., 1983. Nonmonetary effects of the financial crisis. American Economic
Review 73, 257-276.
Clark, Truman A. and Weinstein, M.,1983. The behavior of the common stock of bankrupt firms. Journal of Finance 38, 489-504.
Core, J., Guay, W., Rusticus, T., 2005. Does weak governance cause weak stock returns? An examination of firm operating performance and investors’ expectations. Journal of Finance 61, 655–687.
Daily, C., Dalton, D., 1994. Corporate governance and the bankrupt firm: an empirical assessment. Academy of Management Journal 15, 643-654.
Daily, C., Dalton, D., 1994. Bankruptcy and corporate governance: the impact of board composition and structure. Academy of Management Journal 37, 1603-1617.
Ferris, S., Jayaraman, N., Makhija, A., 1997. The response of competitors to announcements of bankruptcy: an empirical examination of contagion and competitive effects. Journal of
Corporate Finance 3, 367–395.
Galai, Dan and Masulis, R., 1976. The option pricing model and the risk factor of stock.
Gompers, P., Ishii, J., Metrick, A., 2003. Corporate governance and equity prices,
Quarterly Journal of Economics 118, 107–155.
Haensly, P., Theis, J., Swanson, Z., 2001, Reassessment of contagion and competitive intra-industry effects of bankruptcy announcements. Quarterly Journal of Business and Economics 40, 45-63.
Hertzel, M., Smith, J., 1993. Industry effects of interfirm lawsuits: evidence from Pennzoil v. Texaco. Journal of Law, Economics, & Organization 9, 425–444.
Hertzel, M., Z. Li, M. Officer and K. Rodgers, 2008, Inter-firm linkages and the wealth effects of financial distress along the supply chain. Journal of Financial Economics 87, 374-387.,
Jensen, Michael C., 1986. Agency costs of the free cash flow, corporate finance, and takeovers, American Economic Review 76, 323-329.
Lang, L., Stulz, R., 1992. Contagion and competitive intra-industry effects of bankruptcy announcements. Journal of Financial Economics 32, 45–60.
Masulis, R., Wang, C., Xie, F., 2007. Corporate governance and acquirer returns. Journal of
Finance 62, 1851-1889.
Slovin, M., Sushka, M., Polonchek, J., 1999. An analysis of contagion and competitive effects at commercial banks. Journal of Financial Economics 54, 197–225.
Warner, Jerold B., 1977. Bankruptcy and the pricing of risky debt. Journal of Financial
Economics 4, 239-276.
Weiss, L., Wruck, K., 1998. Information problems, conflicts of interest, and asset stripping: Chapter 11’s failure in the case of Eastern Airlines. Journal of Financial Economics 48, 55–97.
Wruck, Karen H., 1990. Financial distress, reorganization, and organization efficiency.
Figure I Diagrams of cumulative abnormal return for democracy and dictatorship portfolios
The first diagram is the cumulative abnormal return for democracy portfolio (GIM index less than 5) while the second diagram is for dictatorship portfolio (GIM index more than 14) from 1990 to 2006. The event date is the date recorded in the financial restructuring in SDC database where event day 0 is the bankruptcy
announcement date. The X axis is the event date for 11-day window, and the Y axis is the cumulative abnormal return for 11-day window.
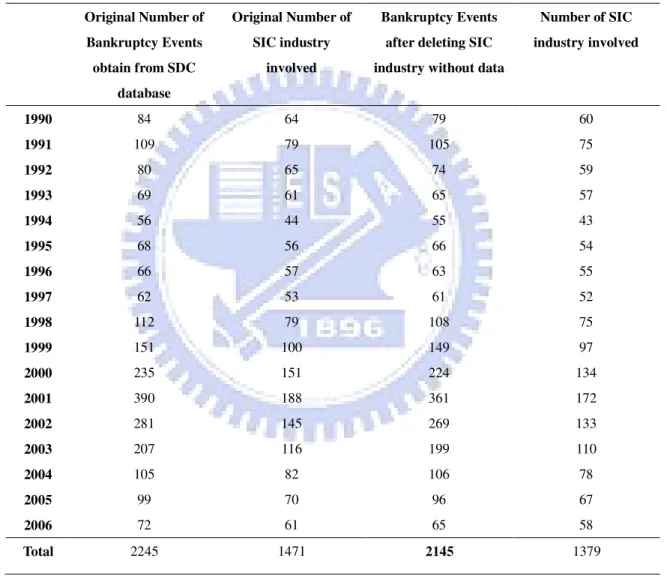
Table I Number of events and portfolios formed for each SIC code
The first and second columns are the original data from SDC database. The first column is the number of bankruptcy events recorded and the second column is the number of SIC codes with bankruptcy announcements each year. Originally, there are 2245 bankruptcy announcement events and 1471 SIC codes with bankruptcy announcements of firms within industry. After deleting SIC industry without other surviving firms in the industry, the sample consists of 2145 SIC code portfolios and 1379 different SIC codes involved for all of the bankruptcy announcements during 1990 to 2006. The table also shows the distribution of bankruptcy events each year and the SIC codes involved
Original Number of Bankruptcy Events obtain from SDC database Original Number of SIC industry involved Bankruptcy Events after deleting SIC industry without data
Number of SIC industry involved 1990 84 64 79 60 1991 109 79 105 75 1992 80 65 74 59 1993 69 61 65 57 1994 56 44 55 43 1995 68 56 66 54 1996 66 57 63 55 1997 62 53 61 52 1998 112 79 108 75 1999 151 100 149 97 2000 235 151 224 134 2001 390 188 361 172 2002 281 145 269 133 2003 207 116 199 110 2004 105 82 106 78 2005 99 70 96 67 2006 72 61 65 58 Total 2245 1471 2145 1379
27
Table II Number of Firms Matched of GIM-index and BCF-index Portfolios
Panel A reports the distribution of GIM governance index and bankruptcy surviving matched firms’ events numbers and the number of individual firms involved in each GIM index portfolios. The first row is the events number while the second row is the individual number of firms in each in each GIM-index portfolios. Panel B shows the distribution based on BCF-index categories. The first row is the number of events while the second row is the individual firms involved.
Panel A: Sample distribution based on GIM-index categories
Portfolios based on GIM index G<=5 G=6 G=7 G=8 G=9 G=10 G=11 G=12 G=13 G>=14 Total
Number of firm events 861 1004 1271 1670 1681 1505 1346 794 519 433 11084
Number of firms involved 212 183 212 250 211 197 159 88 58 50
Panel B: Sample distribution based on BCF-index categories
Portfolios based on BCF index B=0 B=1 B=2 B=3 B=4 B=5 B=6 Total
Number of firm events 956 2264 2985 2836 1620 364 59 11084
28
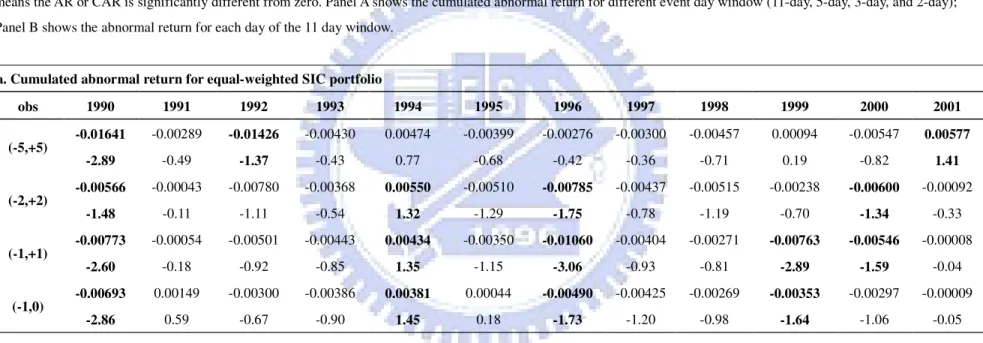
Table III Equal-weighted abnormal and cumulated abnormal return (1990-2001)
The abnormal return (AR) and cumulated abnormal return (CAR) is the market model residual. The sample includes all bankruptcy announcement industries with more than zero surviving firms between January 1990 and December 2006 for a four-digit SIC code is available from the COMPUSTAT. An industry portfolio is an
equal-weighted portfolio of firms with the same four-digit SIC code for which returns are available form the CRSP database. The first column of each observation is the abnormal return or cumulated abnormal return, and the second column is the two-sided T-test to indicate the average is significantly different from zero. Letters in boldface means the AR or CAR is significantly different from zero. Panel A shows the cumulated abnormal return for different event day window (11-day, 5-day, 3-day, and 2-day); Panel B shows the abnormal return for each day of the 11 day window.
a. Cumulated abnormal return for equal-weighted SIC portfolio
obs 1990 1991 1992 1993 1994 1995 1996 1997 1998 1999 2000 2001 (-5,+5) -0.01641 -0.00289 -0.01426 -0.00430 0.00474 -0.00399 -0.00276 -0.00300 -0.00457 0.00094 -0.00547 0.00577 -2.89 -0.49 -1.37 -0.43 0.77 -0.68 -0.42 -0.36 -0.71 0.19 -0.82 1.41 (-2,+2) -0.00566 -0.00043 -0.00780 -0.00368 0.00550 -0.00510 -0.00785 -0.00437 -0.00515 -0.00238 -0.00600 -0.00092 -1.48 -0.11 -1.11 -0.54 1.32 -1.29 -1.75 -0.78 -1.19 -0.70 -1.34 -0.33 (-1,+1) -0.00773 -0.00054 -0.00501 -0.00443 0.00434 -0.00350 -0.01060 -0.00404 -0.00271 -0.00763 -0.00546 -0.00008 -2.60 -0.18 -0.92 -0.85 1.35 -1.15 -3.06 -0.93 -0.81 -2.89 -1.59 -0.04 (-1,0) -0.00693 0.00149 -0.00300 -0.00386 0.00381 0.00044 -0.00490 -0.00425 -0.00269 -0.00353 -0.00297 -0.00009 -2.86 0.59 -0.67 -0.90 1.45 0.18 -1.73 -1.20 -0.98 -1.64 -1.06 -0.05
29
b. Abnormal return for equal weighted SIC portfolio
obs 1990 1991 1992 1993 1994 1995 1996 1997 1998 1999 2000 2001 -5 -0.00030 -0.00168 0.00029 0.00001 0.00054 0.00094 -0.00071 0.00595 0.00214 0.00092 0.00244 0.00185 -0.18 -0.94 0.09 0.00 0.29 0.54 -0.36 2.37 1.10 0.60 1.22 1.50 -4 -0.00141 -0.00339 -0.00178 -0.00049 -0.00014 -0.00104 0.00317 -0.00275 -0.00250 -0.00088 -0.00217 0.00004 -0.82 -1.91 -0.56 -0.16 -0.07 -0.59 1.59 -1.10 -1.29 -0.58 -1.04 0.04 -3 -0.00327 0.00070 -0.00092 0.00564 -0.00069 -0.00027 -0.00040 -0.00081 -0.00135 0.00324 -0.00015 -0.00043 -1.91 0.39 -0.29 1.86 -0.37 -0.16 -0.20 -0.32 -0.70 2.12 -0.07 -0.34 -2 0.00399 -0.00010 -0.00202 -0.00056 -0.00071 0.00249 0.00027 0.00132 -0.00246 -0.00221 -0.00082 -0.00149 2.33 -0.06 -0.64 -0.19 -0.38 1.41 0.13 0.53 -1.27 -1.45 -0.40 -1.20 -1 -0.00161 0.00096 0.00078 -0.00015 0.00248 0.00064 -0.00090 -0.00199 -0.00212 -0.00238 -0.00139 -0.00002 -0.94 0.54 0.25 -0.05 1.33 0.36 -0.45 -0.79 -1.09 -1.56 -0.70 -0.02 0 -0.00533 0.00053 -0.00378 -0.00370 0.00133 -0.00020 -0.00401 -0.00226 -0.00057 -0.00115 -0.00158 -0.00007 -3.11 0.30 -1.20 -1.22 0.72 -0.11 -2.01 -0.90 -0.30 -0.76 -0.80 -0.05
30
b. Abnormal return for equal weighted SIC portfolio (Con.)
obs 1990 1991 1992 1993 1994 1995 1996 1997 1998 1999 2000 2001 1 -0.00080 -0.00203 -0.00201 -0.00058 0.00053 -0.00394 -0.00570 0.00021 -0.00002 -0.00410 -0.00249 0.00001 -0.47 -1.15 -0.64 -0.19 0.29 -2.24 -2.84 0.08 -0.01 -2.69 -1.25 0.01 2 -0.00191 0.00022 -0.00077 0.00132 0.00187 -0.00409 0.00249 -0.00166 0.00002 0.00745 0.00027 0.00065 -1.11 0.12 -0.25 0.44 1.01 -2.32 1.24 -0.66 0.01 4.88 0.14 0.53 3 0.00130 -0.00027 -0.00175 -0.00463 -0.00475 0.00226 -0.00054 0.00082 0.00167 0.00174 0.00034 0.00113 0.76 -0.15 -0.56 -1.50 -2.55 1.28 -0.27 0.33 0.86 1.14 0.17 0.91 4 -0.00576 0.00053 -0.00220 0.00288 0.00103 -0.00055 0.00050 -0.00130 0.00003 -0.00035 0.00032 0.00037 -3.36 0.30 -0.70 0.95 0.56 -0.31 0.25 -0.52 0.01 -0.23 0.16 0.30 5 -0.00132 0.00164 -0.00010 -0.00404 0.00324 -0.00023 0.00307 -0.00053 0.00060 -0.00134 -0.00025 0.00372 -0.77 0.93 -0.03 -1.34 1.74 -0.13 1.53 -0.21 0.31 -0.88 -0.13 3.01
31
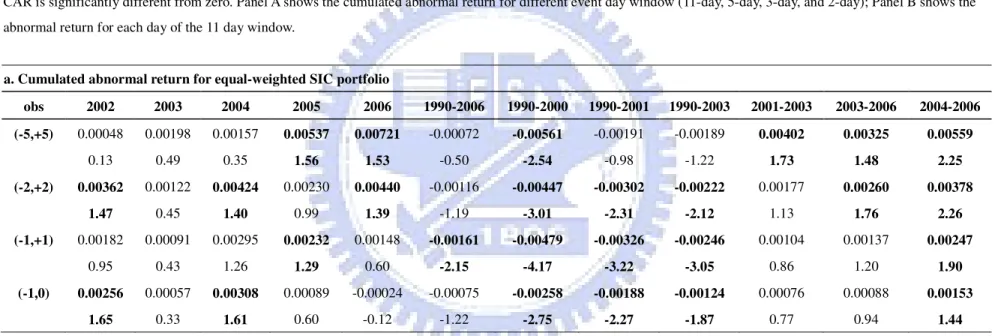
Table IV Equal-weighted abnormal and cumulated abnormal return (2002-2006)
The abnormal return (AR) and cumulated abnormal return (CAR) is the market model residual. The sample includes all bankruptcy announcement industries with more than zero surviving firms between January 1990 and December 2006 for a four-digit SIC code is available from the COMPUSTAT. An industry portfolio is an equal-weighted portfolio of firms with the same four-digit SIC code for which returns are available form the CRSP database. The first column of each observation is the abnormal return or cumulated abnormal return, and the second column is the two-sided T-test to indicate the average is significantly different from zero. Letters in boldface means the AR or CAR is significantly different from zero. Panel A shows the cumulated abnormal return for different event day window (11-day, 5-day, 3-day, and 2-day); Panel B shows the abnormal return for each day of the 11 day window.
a. Cumulated abnormal return for equal-weighted SIC portfolio
obs 2002 2003 2004 2005 2006 1990-2006 1990-2000 1990-2001 1990-2003 2001-2003 2003-2006 2004-2006 (-5,+5) 0.00048 0.00198 0.00157 0.00537 0.00721 -0.00072 -0.00561 -0.00191 -0.00189 0.00402 0.00325 0.00559 0.13 0.49 0.35 1.56 1.53 -0.50 -2.54 -0.98 -1.22 1.73 1.48 2.25 (-2,+2) 0.00362 0.00122 0.00424 0.00230 0.00440 -0.00116 -0.00447 -0.00302 -0.00222 0.00177 0.00260 0.00378 1.47 0.45 1.40 0.99 1.39 -1.19 -3.01 -2.31 -2.12 1.13 1.76 2.26 (-1,+1) 0.00182 0.00091 0.00295 0.00232 0.00148 -0.00161 -0.00479 -0.00326 -0.00246 0.00104 0.00137 0.00247 0.95 0.43 1.26 1.29 0.60 -2.15 -4.17 -3.22 -3.05 0.86 1.20 1.90 (-1,0) 0.00256 0.00057 0.00308 0.00089 -0.00024 -0.00075 -0.00258 -0.00188 -0.00124 0.00076 0.00088 0.00153 1.65 0.33 1.61 0.60 -0.12 -1.22 -2.75 -2.27 -1.87 0.77 0.94 1.44
32
b. Abnormal Return for equal-weighted SIC portfolio
obs 2002 2003 2004 2005 2006 1990-2006 1990-2000 1990-2001 1990-2003 2001-2003 2003-2006 2004-2006 -5 0.00019 -0.00057 -0.00241 0.00172 -0.00249 0.00067 0.00107 0.00123 0.00105 0.00073 -0.00076 -0.00072 0.17 -0.46 -1.78 1.65 -1.76 1.56 1.62 2.10 2.01 1.04 -1.15 -0.96 -4 -0.00026 0.00119 -0.00111 -0.00168 0.00168 -0.00061 -0.00158 -0.00095 -0.00090 0.00069 0.00046 -0.00039 -0.23 0.98 -0.82 -1.61 1.18 -1.39 -2.34 -1.61 -1.71 0.99 0.69 -0.52 -3 -0.00177 -0.00126 -0.00009 0.00041 0.00104 -0.00034 0.00009 0.00009 -0.00028 -0.00099 -0.00057 0.00032 -1.61 -1.03 -0.06 0.39 0.73 -0.79 0.14 0.15 -0.53 -1.42 -0.87 0.43 -2 0.00076 0.00062 0.00038 -0.00077 0.00212 -0.00040 -0.00048 -0.00057 -0.00064 -0.00008 0.00049 0.00040 0.69 0.50 0.28 -0.74 1.50 -0.91 -0.72 -0.98 -1.21 -0.12 0.75 0.53 -1 0.00184 0.00028 0.00032 -0.00058 -0.00056 -0.00009 -0.00065 -0.00056 -0.00014 0.00050 0.00009 -0.00027 1.67 0.23 0.23 -0.56 -0.40 -0.21 -0.97 -0.95 -0.27 0.72 0.14 -0.36 0 0.00073 0.00028 0.00277 0.00147 0.00032 -0.00066 -0.00193 -0.00132 -0.00109 0.00026 0.00079 0.00180 0.66 0.23 2.04 1.41 0.23 -1.52 -2.91 -2.25 -2.09 0.37 1.20 2.40
33
b. Abnormal Return for equal-weighted SIC portfolio (Con.)
obs 2002 2003 2004 2005 2006 1990-2006 1990-2000 1990-2001 1990-2003 2001-2003 2003-2006 2004-2006 1 -0.00075 0.00034 -0.00013 0.00143 0.00173 -0.00086 -0.00221 -0.00139 -0.00123 0.00028 0.00049 0.00093 -0.68 0.28 -0.10 1.37 1.22 -1.99 -3.34 -2.37 -2.34 0.40 0.74 1.25 2 0.00104 -0.00030 0.00091 0.00075 0.00080 0.00085 0.00079 0.00081 0.00088 0.00081 0.00073 0.00092 0.95 -0.24 0.67 0.72 0.56 1.96 1.20 1.39 1.68 1.16 1.11 1.22 3 -0.00052 0.00047 0.00194 0.00170 0.00213 0.00028 -0.00005 0.00018 0.00001 -0.00001 0.00122 0.00255 -0.47 0.39 1.43 1.63 1.50 0.65 -0.07 0.31 0.01 -0.01 1.85 3.41 4 0.00132 0.00176 -0.00052 0.00168 0.00027 0.00046 -0.00022 0.00003 0.00037 0.00117 0.00080 0.00042 1.20 1.44 -0.38 1.61 0.19 1.06 -0.33 0.05 0.70 1.68 1.22 0.57 5 -0.00210 -0.00084 -0.00047 -0.00075 0.00018 -0.00003 -0.00044 0.00054 0.00009 0.00067 -0.00050 -0.00038 -1.91 -0.69 -0.35 -0.72 0.13 -0.06 -0.67 0.92 0.17 0.95 -0.76 -0.51