國
立
交
通
大
學
經營管理研究所
碩 士 論 文
政府治理與國家研發效率:
隨機距離函數法之應用
Public Governance and National R&D Efficiency: An
Application of Stochastic Distance Function Approach
研 究 生:曾怡瑄
指導教授:胡均立 教授
政府治理與國家研發效率:
隨機距離函數法之應用
Public Governance and National R&D Efficiency: An
Application of Stochastic Distance Function Approach
研 究 生:曾怡瑄 Student:Yi-Hsuan Tseng
指導教授:胡均立 Advisor:Jin-Li Hu
國 立 交 通 大 學
經營管理研究所
碩 士 論 文
A ThesisSubmitted to Institute of Business and Management College of Management
National Chiao Tung University in Partial Fulfillment of the Requirements for the Degree of Master of Business Administration
June 2013
Taipei, Taiwan, Republic of China
i
政府治理與國家研發效率:
隨機距離函數法之應用
研究生: 曾怡瑄 指導教授: 胡均立教授
國立交通大學經營管理研究所碩士班
摘要 本篇文章採用隨機邊界法來衡量政府治理與國家研發之間的關係。資料數據涵蓋 59 個 國家,而資料年限為 1998 年、2000 年、2002 到 2008 年。在多投入與多產出的模型中, 我們使用了 R&D 人員與 R&D 費用存量做為投入項;產出項則為專利數、科學期刊文章與 技術授權金。研究結果發現六個政府治理指標對研發效率有正面的影響,尤其是政府效 率指標對研發效率的影響最大。進一步把六項政府治理指標區分成三個面向時,同樣顯 示公部門治理對研發效率有正面影響效果。 關鍵詞:研發效率、政府治理、隨機邊界法ii
Public Governance and National R&D Efficiency: An Application of
Stochastic Distance Function Approach
Student: Yi-Hsuan Tseng Advisor: Jin-Li Hu
Institute of Business and Management
National Chiao Tung University
ABSTRACT
This paper adopts the distance function approach for stochastic frontier analysis (SFA) to estimate the relationship between six governance indexes and research and development (R&D) efficiency across 59 nations during the years of 1998, 2000, and 2002–2008. The multiple inputs and outputs framework which includes R&D manpower, R&D expenditure stocks as inputs and patents, scientific journal articles, royalties and licensing fees (RLF) as outputs. We find that all six indexes have positive effects on R&D efficiency; moreover, the government effectiveness especially plays the most important role. Grouping the six indexes into three dimensions still shows the same result that the public governance significantly improves national R&D efficiency.
iii
誌 謝
時光飛逝,兩年的碩士生活即將告一段落,雖然在交大經管所僅只兩年的時間,卻 讓我在學識領域與人格修養上獲益良多。回想起最初參加迎新、所遊到送舊與謝師宴, 我由衷感謝每位與我共同創造回憶的人,更感謝幫助我與指導我完成論文的人。 感謝我的指導教授胡均立老師。老師總是不厭其煩地教導我們,尤其是在績效評估 的課程中,讓我們對效率的衡量有更進一步的認識。在研究的過程中遇到問題時,老師 也耐心的提供可行方案並把我們引到正確導的方向。同時也謝謝老師細心地審視內文並 針對細節處給予糾正。另外,感謝已在台經院工作的陳疆平學長在假日時段撥冗指導。 學長在統計觀念、文章的呈現方式與內容的充實程度,幫了很大的忙。在資料的搜尋遇 到瓶頸時,學長也會依豐富的經驗給予提點。其次,感謝已在中研院工作的張子溥學長 教導我軟體的操作,學長也回應了許多我在操作軟體時遇到的疑問。謝謝您們,讓我能 順利完成研究與論文的撰寫。 感謝我的同學們,在研究所的兩年中能陪伴我一起念書、做報告、相互鼓勵、相互 扶持,也陪伴我一起玩樂。有了你們,使我的研究所生活多彩多姿同時也充實快樂。這 麼優的夥伴們,很幸運能認識你們!謝謝所辦的王樂貞小姐,在我遇到學校行政相關問 題時親切地給予協助。 最後,感謝一路以來支持我的家人。感謝我的父母提供我無憂無慮的生活環境,在 我遇到困難時給予鼓勵及建議,在疲憊時有個溫暖的家能休息充電再出發。感謝妹妹從 我在準備考研究所時就幫我解答統計學相關的大小疑問,進了研究所後,妹妹也總是對 課業與生活上給予建議。因為有家人們陪伴才能成就今日的我,謝謝您們。 曾怡瑄 謹誌於 國立交通大學經營管理研究所 中華民國一百零二年六月iv
Content
Chinese abstract ... I English abstract ... II Acknowledgement………..……..III Content ... IV Lists of figures ... V Lists of tables ... V 1. Introduction ... 11.1 Research background and motivation ... 1
1.2 Research objectives ... 1
1.3 Research procedure... 2
2. Literature review ... 4
2.1 Empirical studies on national R&D efficiency ... 4
2.2 The role of governance in R&D efficiency ... 8
3. Methodology and data ... 11
3.1 The distance function approach for R&D efficiency ... 11
3.2 Description of inputs and outputs ... 14
3.3 Variable description of efficiency model ... 16
4. Empirical result ... 19
4.1 Estimation results of distance function ... 19
4.2 Estimation results of efficiency function ... 20
4.3 The result of national R&D efficiency………26
5. Conclusion and policy implications ... 32
v
List of tables
Table 1 Literature review of national R&D efficiency……….……….. 7
Table 2 Summary statistics of inputs and outputs………... 16
Table 3 Definitions and source of main variables in the efficiency model………... 18
Table 4 The dimension of selection of the authority……… 21
Table 5 The dimension of government action……….. 22
Table 6 The dimension of respect for institutional framework………..….. 23
Table 7 Three governance dimensions………..…… 25
Table 8 Result of the Kruskal-Wallis test………..… 26
Table 9 National R&D efficiency across groups and regions………..…. 26
Table 10 National R&D efficiency and ranking………..…..29
List of Figures
Figure 1 Research Flowchart ... 3Figure 2 Gaps in average efficiency score between OECD and Non-OECD members ... 27
Figure 3 Gaps in average efficiency score between Europe and America ... 27
Figure 4 Governance index of VA………..………...……30
Figure 5 Governance index of PS……….………..………..30
Figure 6 Governance index of GE……….………...…30
Figure 7 Governance index of RQ………...….30
Figure 8 Governance index of RL……….31
1
1. Introduction
1.1 Research background and motivation
Endogenous growth theory indicates that research and development (R&D) played an indispensable role in fostering the economic growth. Several studies provided evidence for the positive relationship between R&D activities and growth (e.g., Coe and Helpman, 1995; Meliciani, 2000; Zachariadis, 2004; Parisia et al., 2006; Wang, 2007). Griffith et al. (2004) used data from industries across 12 OECD countries during the period 1974-1990, finding country industries lagging behind the productivity frontier catch up particularly fast if they invested heavily in R&D. As R&D activities are the major driving force behind economic and technological progress (Wang and Huang, 2007), the efficiency of R&D and the improvement of R&D performance should not be ignored.
Wei (2000) suggested that bad institutions might slow down the diffusion of new ideas and technologies. Nikos (2006) examined how the quality of political institutions influenced national innovational activity. If we take governance as a kind of institutions, governance should play a key role to create a suitable environment for innovation. In fact, we may infer that good governance have positive effects on R&D efficiency. However, there is still no clear and direct evidence to support the relationships between governance and R&D efficiency. Currently, most researches about the relationship between them only emphasize the partial role of government when reviewing the R&D inefficiency. For example, Conte et al. (2009) analyzed the relative efficiency of the innovation among EU Members and pointed out that the government's structure and policy might contribute to raise efficiency level of R&D spending.
1.2 Research objectives
2
dimensions in each country. Based on the concept from Worldwide Governance Indicator (WGI), governance should have the ability to formulate and enforce sound policies which also contain regulations and the rules of raw. It ought to give the confidence to the local institution and the people among the interaction of social and economic affairs. It should stand the test about the rotation of political parties and the process which be monitored by the opposition and citizens. As we can see from above, the governance is multidimensional. Due to few studies aim at the relationship between governance and R&D efficiency till now, it is worthy to understand this issue more complete and comprehensive.
1.3 Research procedure
In this study, we employ the distance function approach of SFA to examine the relationship between public governance and R&D efficiency. This approach which proposed by Coelli and Perelman (2000) is not only possesses the advantages of data envelopment analysis (DEA) by considering multiple outputs and being free of behavioral assumptions, but also remedies its drawback of not considering the individual effect of each nation. We provide the following distinct types of empirical evidence. First, this study computes national R&D efficiency in compliance with the multiple input-output R&D production process at the national level. Second, this study uses six governance indicators from WGI to investigate the role of public governance. The six governance indicators are developed by Kaufmann et al. (2010), which compile the governance infrastructure from a broad sample of 215 economies over the period 1996-2011. Third, examining the relationship between governance and national R&D efficiency can provide insightful policy implications for nations in help to achieve better R&D performance, especially from the viewpoint of governance. These should in turn help improve the allocation of R&D resources and foster economic development.
The rest of this paper is organized as follows: Section 2 reviews literature regarding the contribution of R&D efficiency and the impact of a specific policy to R&D efficiency.
3
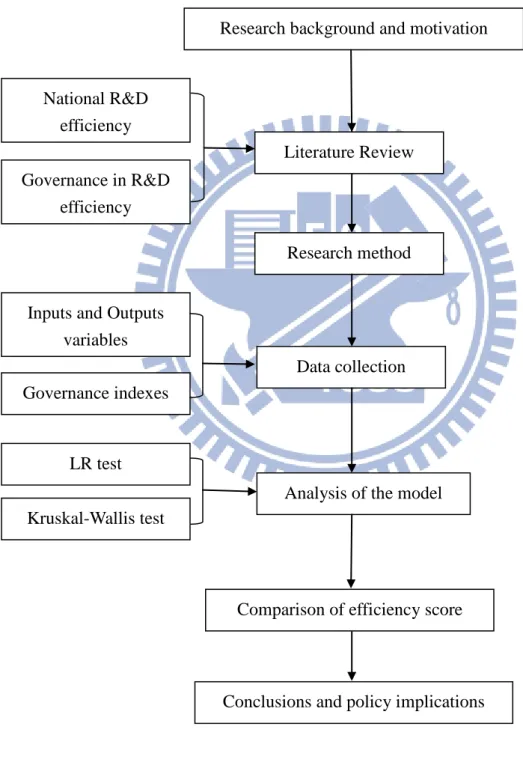
Section 3 deals with the empirical methodologies and introduces the dataset. Section 4 conducts model tests and displays the estimated R&D efficiency scores. It also includes the exploration of the impacts of governance indicators on national R&D efficiency. Section 5 concludes remarks and policy implications. Figure 1 is the research flowchart:
Figure 1 Research Flowchart Research method
Data collection
Research background and motivation
Literature Review National R&D
efficiency
Governance in R&D efficiency
Inputs and Outputs variables
Governance indexes
Analysis of the model
Comparison of efficiency score
Conclusions and policy implications LR test
4
2. Literature Review
2.1 Empirical studies on national R&D efficiency
In recent years, national R&D efficiency has been evaluated through the method of DEA and SFA. Following are studies which explore the R&D efficiency. Lee and Park (2005) measured R&D efficiency for 27 nations which included OECD countries and some non-member countries. The input variables were R&D expenditures and researchers; outputs were technology balance of receipts, articles and patents. For Asian country, the results showed that Singapore got top score in total efficiency, and Japan in patent-oriented efficiency. They also found that China, Korea, and Taiwan were relatively inefficient in all these three output efficiencies.
Wang and Huang (2007) used three-stage DEA to evaluate the relative efficiency of R&D activities across 30 countries. The inputs were R&D capital stocks and manpower while outputs were patents and academics. The results showed that less than one-half of the countries were fully efficient in R&D activities and more than two-thirds were at the stage of increasing returns to scale.
Sharma and Thomas (2008) used DEA to measure 22 countries which were grouped as developed and developing types. They chose gross domestic expenditure on R&D, the number of researchers, annual population estimates and gross domestic product by expenditure as inputs and patents granted to residents and publications as outputs. Japan, the Republic of Korea and China were found to be efficient at the stage of constant returns to scale. Japan, Republic of Korea, China, India, Slovenia and Hungary were in the stage of variable returns to scale.
Chen et al. (2011) compared national R&D efficiency across 24 countries and investigated how the innovation environment affected different output-oriented R&D
5
efficiency indices. The input variables were total R&D manpower and R&D expenditure stock while output variables were patents, scientific journal articles and royalty and licensing fees. Their results showed that R&D intensity, intellectual property rights protection, knowledge stock, and human capital accumulation all had significantly positive effects on efficiency indices.
National R&D efficiency could be measured by another method such as SFA. Here list three studies which use SFA to deal with the issue related to national R&D efficiency. Wang (2007) evaluated the relative efficiency of R&D activities across 30 countries. He constructed a production function, then used R&D capital stock, and manpower as inputs, and used weighting scheme which combine patents and academic publications into single one as output. The result showed that after taking the environmental effect into account, the means of efficiency scores increased from 0.65 to 0.85.
Fu and Yang (2009) used SFA to construct an international patenting frontier. They selected R&D inputs and human capital as key inputs and considered patents as a proxy for output. In terms of patenting efficiency, Japan and the USA had been the world leaders in the 1990s, then the UK was ranked the lowest among the G7 countries and showed little sign of catch-up in this respect either.
Hu et al. (2011) studied the relationship between R&D efficiency and the national innovation system, using a multiple input-output framework to compute R&D efficiency cross 24 nations. In their study, R&D expenditure stock and R&D manpower were inputs, while patents, scientific journal articles and royalties and licensing fees were outputs. They found intellectual property rights protection, technological cooperation among business sectors, knowledge transfer between business sectors, higher education institutions, agglomeration of R&D facilities, and involvement of the government sector in R&D activities could significantly improve national R&D efficiency.
6
When comparing the national R&D efficiency, it is more suitable to take multiple outputs into consideration for avoiding partial view of national R&D performance. Based on previous studies above mentioned, this study chooses R&D expenditure stock and R&D manpower as inputs, while patents, scientific journal articles and royalties and licensing fees (RLF) as outputs which all have been widely adopted.
Since the non-parametric approach of DEA and parametric approach of SFA are two principal methods to measure efficiency, both of them respectively have its own advantage. DEA approach can take multiple outputs into account and there is no need to specify a functional form for production function. On the other hand, SFA approach can capture the statistical noise and be used to conduct conventional test of hypotheses (Coelli et al., 2005). In order to retain the advantages of two approaches as much as possible, we adopt the distance function to conduct a multiple input-output framework within SFA.
7 Table 1
Literature review of national R&D efficiency Author Input indicators Output indicators Key Results
Method of data envelopment analysis (DEA)
Chen et al. (2011) R&D expenditure stock R&D manpower Patents Publications Royalty and licensing fees
R&D intensity, intellectual property rights protection, knowledge stock, and human capital accumulation all had significantly positive effects on efficiency indices.
Sharma and Thomas (2008) R&D expenditure Researchers Population GDP Patents Publications
Some of the developing nations can serve as benchmarks for their efficient use of R&D resources.
Wang and Huang (2007)
R&D capital stock R&D manpower
Patents Publications
There are less than one-half of the countries were fully efficient in R&D activities and more than two-thirds were at the stage of increasing returns to scale. Lee and
Park (2005) R&D expenditure R&D manpower Patents Publications Technology balance of receipts
Singapore got top score in total efficiency, and Japan in patent-oriented efficiency. China, Korea, and Taiwan were relatively inefficient in all three output efficiencies.
Method of stochastic frontier analysis (SFA)
Hu et al.
(2011) R&D capital stock R&D manpower
Patents Publications Royalty and licensing fees
Intellectual property rights protection, technological cooperation, knowledge transfer, higher education institutions, agglomeration of R&D facilities, and involvement of the government sector in R&D activities can improve national R&D efficiency. Fu and Yang (2009) R&D inputs Human capital
Patents In terms of patenting efficiency, Japan and the USA had been the world leaders in the 1990s, then the UK was ranked the lowest among the G7 countries
Wang
(2007) R&D capital stock R&D manpower Combine patents and publications into single one
After taking the environmental effect into account, the means of efficiency scores increased from 0.65 to 0.85.
8
2.2 The role of public governance in R&D activities
Méon and Weill (2005) studied the relationship between governance and macroeconomic technical efficiency which showed that better governance was associated with more efficient. Lio and Hu (2009) adopted Kaufmann et al. (2006) to investigate the relationship between six governance indicators and agricultural efficiency. Chang and Hu (2013) used Kaufmann et al. (2008) to investigate the relationships among six governance indicators and environmental efficiency, operational efficiency, and unified efficiency. Regarding as the relationship between public governance and national R&D activities, most of previous studies focus on the influence of single policy, and discuss this issue into four parts as follows.
First, the degree of democracy and the liberalization of investment environment– To promote the economic development, the more rights that people can take part in the public sector, the more freedoms they can express themselves. More rights and freedoms may help creativity and innovation. Ishtiaq and Carlos (2005) suggested that government should adjust corresponding policy according to the external conditions. When a country was far from the technological frontier, the government could promote economic development through relieving the centralization of economic and political control. On the other hand, highly political and economic freedom has often been seen while a country approaches to technical frontier.
In previous studies, Adkins et al. (2002) studied the impact of institutions on economics and showed that more economics freedom result in more aggregate efficiency. Recently, Altay and Çelebioğlu (2011) stated that there were positive relationships among per capita GDP, democracy and economic freedom in European countries. Zouhaier and Karim (2012) explored the 11 countries among Middle East and North Africa. They found a positive impact of democracy on investment. Although there is no direct evidence focus on the relationship between democracy and R&D activities, we suggest that the degree of democracy may have
9 positive influence on national R&D efficiency.
Second, the stability and the effectiveness of government – Because uncertainty to the future benefit is likely to limit investment in innovation and venturing for entrepreneurs (Baker et al., 2005), political instability may also limit national R&D activities. Nikos (2006) pointed out that political stability and accountability of governmental actions should be positively related to patent protection. When discussing the reason why R&D allocated inefficient, the effectiveness of government may play an important part. In fact, government effectiveness at least includes many details such as quality of public services and the credibility of the government's promise to such policies and so forth. Wang (2007) proposed that bureaucracy might cause some influences on R&D efficiency. He also mentioned that the discrepancies in the level of knowledge-based economies across countries. It implies that there is still room for improvement regarding the effectiveness of policies.
Third, the quality of regulation and the rule of law – Blayse and Manley (2004) identified six main factors which driving innovation for the business and policy maker, and one of them was a country's regulations or standards. Nikos (2006) pointed out the higher the efficiency of the judiciary system, the better the patent's protection. However, if government blocking innovation or adopting policies that were bad for growth, some countries will remain poor (Azam and Phillip, 2007). Government regulation through norms and standards is one of the motivations stimulating innovation (Milou and Niels, 2007). If the government has an ability to formulate and implement sound policies and regulations, it may improve R&D efficiency and thus accelerate the growth. Furthermore, sound policies and regulations are inducements when exploring the influences on R&D activities.
Fourth, the control of corruption – Mauro (1995) engaged in an empirical analysis of corruption by investigating the relationship between investment and corruption for 58 countries. He showed that corruption was negatively associated with investment. Some other studies also showed a negative relationship between corruption and foreign direct investment
10
(Asiedu, 2006; Voyer and Beamish, 2004; Habib and Zurawicki, 2002; Wei, 2000). Such a phenomenon will fail to induce knowledge spillover which pertains to the flow of R&D staff and technology. At the same viewpoint, Marcelo (2008) illustrated the relationship between corruption and product innovation in an industry. The conclusion showed that corrupt practices led to lower rate of innovation. Accordingly, better control of corruption is also associated with rising levels of innovation (Sergey and William, 2009). In this research, the control of corruption will be also taken into account when measuring the relationship between public governance and national R&D efficiency.
Considering the multidimensional of governance, this paper use governance indicators which developed by Kaufmann et al. (2010). The indicators not only reflect governance-related issues from six categories but also help us to clarify the comprehensive relationship between public governance and national R&D efficiency rather than focus on a single policy. Six indicators include voice and accountability, political stability and absence of violence, government effectiveness, regulatory quality, rule of law, as well as control of corruption. The specific definitions will be introduced in sub section 3.3.
11
3. Methodology and Data
This study applies the distance function approach of SFA to evaluate the national R&D efficiency by considering multiple outputs. In national R&D production process, R&D expenditure stock and R&D manpower are the inputs, thus patents, royalties and licensing fees (RLF), and scientific journal articles are the outputs. This approach are more flexible since it can estimates the production function of multiple outputs without needing to specify a behavioral objectives such as profit maximization or cost minimization (Coelli et al., 2005). More important of all, this approach can simultaneously estimate the parameters of the distance function to evaluate national R&D efficiency and the efficiency effects of public governance.
3.1 The distance function approach for R&D efficiency
We use output expanding approach to measure the distance, which is the maximal proportional expansion of output vector given the input vector. According to Shephard's (1970) specification, the output distance function can be defined as follows:
Q(X, Y) = min �φ: �Yφ� ∈ V(X)�, (1) finding the minimum φ such that �Yφ� belongs to V(X), where 0 ≤ φ ≤ 1. V(X) presents the output set of the production technologies that describe the set of output vectors that are feasible for each input vector X. That is:
V(X) = {Y: X can produce Y }, (2) This gives the minimum amount by which an output vector can be deflated and remains producible with a given vector. The output distance function Q(X, Y) is non-decreasing, positively linearly homogenous and convex in Y, and non-increasing in X (Kumbhakar and Lovell, 2000). Q(X, Y) ≤ 1 and Q(X, Y) = 1 represent how Y belongs to the production
12
possibility set of (Y ∈ V(X)) and Y is located on the frontier of the production possibility set of X respectively. The formulation of the output distance function defined in Equations (1) and (2) can be specified as:
Q(X, Y) = f (X, Y ,τ)‧ev (3) where τ is a vector of unknown coefficients to be estimated, term v is the random disturbance term, capturing the statistical noise, which is assumed to be iid N(0, 𝜎v2).
An appropriate functional form f (·) in Equation (3) should ideally be flexible, easy to calculate, and permit the imposition of homogeneity. A commonly used functional form of production is the translog form, which satisfies the above criteria and has been widely adopted in previous studies (Grosskopf et al., 1996; Coelli and Perelman, 2000). The Cobb–Douglas form is the alternative functional form that satisfies only the latter two criteria, because of the restrictive elasticity of substitution and scale property. This study used the likelihood ratio (LR) test to identify whether the Cobb–Douglas functional form or the translog specification was the most adequate. The translog distance function with H outputs and K inputs in the year t is specified as: lnQnt = α0+ � αhln ynth + 12 H h=1 � � αhs H s=1 H h=1 ln ynth ln ynts + � βk lnxntk K k=1 +12 � �βkp lnxntk ln xntp + � � γhk lnynth K k=1 ln H h=1 xntk K p=1 + νnt K k=1 n = 1,..., N and t = 1,..., T (4) where n denotes the n-th DMU in the sample. The restriction of linear homogeneity in outputs requires: � αh H h=1 = 1 , � αhs = 0 , h = 1, … , H ; and � γhk = 0 , k = 1, … , K. (5) H h=1 H h=1
Furthermore, the restriction of symmetry requires:
13
One essential problem in estimating Equation (4) is that the dependent variable ln Qnt is unobservable. Fortunately, we can solve this problem by imposing the linear homogeneity in outputs (Lovell et al., 1994; Färe and Primont, 1995):
ln �Qnt yntH� = α0+ � αhlny�nth + 1 2 � �αhslny�nth H−1 s=1 H−1 h=1 H−1 h=1 lny�nts + � βk K k=1 lnxntk +12 � �βkp K p=1 K k=1 lnxntk lnxntp + � � γhklny�nthlnxntk + K k=1 H−1 h=1 νnt n = 1,..., N and t = 1,...,T (7) where y�nth = ynth
yntH , h = 1, … , H − 1. Equation(7) can be rewritten as: −lnyntH = α0+ � αhlny�nth +12 � � αhslny�nthlny�nts
M−1 s=1 + � βklnxntk K k=1 M−1 h=1 H−1 h=1 +12 � �βkplnxntk lnxntp + � � γhklny�nthlnxntk + νnt− lnQnt K k=1 H−1 h=1 K p=1 K k=1 n = 1,..., N and t = 1,...,T. (8) We next replace the unobservable component −lnQnt by the non-negative random term
unt that is assumed to be independently distributed, truncated at zero of N(u, σu2), and
independently distributed of νnt. The predicted value of the output distance for the n-th DMU, Q̇nt = exp(−unt), is unobservable, because unt only appears as part of the composed error
term, εnt= νnt+ unt. The conditional expectation of unt, given εnt = νnt + unt , is used to obtain the predicted value of the output distance function. The output distance would hence be predicted as:
Q̇nt = E�exp(−unt) │εnt� (9)
which is consistent with the Farrell output-oriented measure of technical efficiency (Kumbhakar and Lovell, 2000). Equations (8) and (9) can be estimated using the maximum
14 likelihood method (Coelli and Perelman, 2000).
We further specify the efficiency model as follows:
−unt = τ0 + τi Governancent + ωnt (10)
where −unt = lnQnt, ‘Governance’ is the relevant variables of governance and the random disturbance ωnt is assumed to be independently distributed as truncated at zero of N ( −( τ0 + τi Governancent), 𝜎u2 ). Since the one-step model is more adequate, this study can simultaneously estimate the parameters of distance function and the efficiency model (Wang and Schmidt, 2002).
3.2 Description of inputs and outputs
This study utilizes unbalanced panel data around fifty-nine countries including thirty-three European, ten Asian, nine North and South American, five Africa and two Oceania during the period of 1998, 2000, 2002–2008.1 Two inputs were R&D expenditure stock, and R&D manpower including full-time researchers and technicians. Due to the unavailability of data on R&D expenditure stock, this study uses the perpetual inventory method to convert R&D expenditure flow into R&D expenditure stock.
The R&D expenditure stock is defined as follows:
Rt = Rt−1(1 − θ) + Et−1 (11)
where Rt and Rt−1 are the respective R&D expenditure stock in the current year and previous year, θ is the depreciation rate of stock, and Et−1 is the R&D expenditure flow in
1 Fifty-nine countries are Argentina, Australia, Austria, Belgium, Bosnia and Herzegovina, Brazil, Bulgaria,
Canada, Chile, China, Croatia, Cyprus, Czech Republic, Estonia, Ethiopia, Finland, France, Germany, Greece, Guatemala, Hungary, Iceland, India, Ireland, Italy, Japan , Kenya, Latvia, Lithuania, Luxembourg, Macedonia, FYR, Madagascar, Malaysia, Malta, Mexico, Moldova, Morocco, Netherlands, New Zealand, Norway, Pakistan, Paraguay, Philippines, Poland, Portugal, Romania, Russia, Singapore, Slovak Republic, Slovenia, South Africa, South Korea, Spain, Sweden, Thailand, Tunisia, Ukraine, United Kingdom, and United States.
15
the previous year. If the R&D series starts in year t = 1 and the pre-sample accumulation of stock is given by Equation (11) with R&D growing at a fixed rate of g and the R&D expenditure flow in this year is equal to (1+g) times the R&D expenditure flow in previous year, then the R&D expenditure stock at the beginning of the first year is defined by the following equation: R1 = E0+ (1 − θ)E−1+ (1 − θ)2E−2+ ⋯ = � E−w(1 − θ)w ∞ w=0 = E0� �1 − θ1 + g� w ∞ w=0 , since Ew−1= 1 + g E1 w =g + θ , (12)E1 The depreciation rate of R&D expenditure assumes 15 percent (Hall and Mairesse, 1995; Mairesse and Hall, 1996). Moreover, the growth rate is set to be an individual nation’s average annual rate of growth of Et (Guellec and van Pottelsberghe de la Potterie, 2004).
The three outputs included patents, royalties and licensing fees (RLF), and scientific and technical journal articles. We adopted the number of patent application by inventor's country of residence. RLF represents authorized use of intangible, nonproduced, nonfinancial assets and proprietary right and they are one of the commercial outputs for a nation's R&D activities. Scientific and technical journal articles include a variety of categories such as physics, biology, chemistry, mathematics, clinical medicine, biomedical research, engineering and technology, earth and space sciences. Table 2 displays the summary statistics of two inputs and three outputs.
16 Table 2
Summary statistics of inputs and outputs
Name Mean SD Max Min
Input variables
x1 Total R&D manpower
a (per thousand people)
180.56 338.89 1965.36 0.48
x2 R&D expenditure stocks
b (million US$ in year 2005)
87510.30 270485.39 1737927.36 6.42
Output variables
y1 Patents b 21467.17 65059.69 384201.00 1.00
y2 Scientific journal articles b 14311.18 32825.59 212883.00 5.90
y3 Royalties and licensing fees
b
(million US$ in year 2005)
2803.91 10234.46 83450.48 0.004
Source: a United Nations Educational, Scientific and Cultural Organization. b World Bank: World Development Indicators database.
3.3 Variable description of efficiency model
The determinants that we use are governance variables taken from the six governance indicators developed by Kaufmann et al. (2010). The governance index ranges from -2.5 to +2.5, which -2.5 means the poorest and +2.5 means the excellent performance. They drew together data covering over 200 countries since 1996, and classify them into six broad dimensions of governance described as follows.
‘Voice and Accountability’ (VA) captures perceptions of the extent to which a country's citizens are able to participate in selecting their government, as well as freedom of expression, freedom of association, and a free media. This indicator relate to the degree of democratization. The data sources also include the transparency of government policy making, public action in the economic field as well as economic policy.
‘Political Stability and Absence of Violence’ (PS) measures perceptions of the likelihood that the government will be destabilized or overthrown by unconstitutional or violent means,
17
including politically-motivated violence and terrorism. The main concept of this index is on a nation's social unrest and internal or external conflict.
‘Government Effectiveness’ (GE) captures perceptions of the quality of public services, the quality of the civil service and the degree of its independence from political pressures, and the credibility of the government's commitment to such policies. This index measure the ability that government could produce good policy and how satisfaction to the outcome of effort. ‘Regulatory Quality’ (RQ) captures perceptions of the ability of the government to formulate and implement sound policies and regulations that permit and promote private sector development. It includes measures of unfair market mechanism such as price control, trade barriers, well function of financial institution, and whether individuals are easy to start a business.
‘Rule of Law’ (RL) captures perceptions of the extent to which agents have confidence in and abide by the rules of society, and in particular the quality of contract enforcement, property rights, the police, and the courts, as well as the likelihood of crime and violence. For the economic and social interactions, this index measure how the government is well enough to unsure excellent in judicial system, police services, combating violence, and importantly, the extent that property rights are protected.
‘Control of Corruption’ (CO) captures perceptions of the extent to which public power is exercised for private gain, including both petty and grand forms of corruption, as well as capture of the state by elites and private interests. It measures different kind of binary such as trade, utilities and procurement.
In addition to the six indicators, we group the governance indicators into three dimensions. There are ‘Selection of the Authority’ (SAU) which measured by the mean of ‘Voice and Accountability’ (VA) and ‘Political Stability and Absence of Violence’ (PS), ‘Government Action’ (GAC) which measured by the mean of ‘Government Effectiveness’ (GE) and ‘Regulatory Quality’ (RQ), ‘Respect for Institutional Framework’ (RIN) which measured by
18
the mean of ‘Rule of Law’ (RL) and ‘Control of Corruption’ (CO). Table 3 shows the statistics and brief definitions of all described variables.
Table 3
Definitions and source of main variables in the efficiency model
Variable Definitions Mean SD
VA Index of ‘Voice and Accountability’ 0.77 0.76
PS Index of ‘Political Stability and Absence of Violence’ 0.51 0.72
GE Index of ‘Government Effectiveness’ 0.92 0.85
RQ Index of ‘Regulatory Quality’ 0.89 0.74
RL Index of ‘Rule of Law’ 0.76 0.90
CO Index of ‘Control of Corruption’ 0.80 1.01
SAU Selection of the authority, measured by the mean value of VA and PS
0.64 0.69
GAC Government action, measured by the mean value of GE and RQ
0.91 0.78
RIN Respect for institutional framework, measured by the mean value of RL and CO
0.78 0.94
19
4. Empirical Result
4.1 Estimation results of distance function
From Tables 4 to 7, this study displays the results of distance function and the efficiency model. Concerning for the fitness of distance function, we do the LR test to judge whether translog functional form is more suitable than Cobb-Douglas form. Due to all the test statics2 from Model 1 to 10 is quite larger than critical value 23.209 (χ210, 0.01), the null hypothesis that
the distance function is Cobb-Douglas form could be rejected. Note that almost all the square terms and interaction terms of inputs and outputs in the distance function are significant, also implying that translog functional form3 is adequate in this study.
All the σ2 and γ parameters in each model are significant, implying that the sum of the variance of the error component and the ratio of the variance of unt to error component are
substantial. It suggests that the random variables of vnt and unt should be considered in the
R&D efficiency evaluation. Besides, high coefficient of γ means the variance of technical inefficiency is the main source of total variance for technical inefficiency and random noises. Due to using the specific output dealing with multiple outputs in estimating, we are curious about whether different yntH shown in equation (7) will influence the efficiency scores or not. There are three outputs in the study, so yntH may be patents, scientific journal articles, and RLF. If the choice of yntH causes different results of efficiency scores, then biased estimation will occur. In view of this, testing whether different yntH will cause different results is necessary before discussing the estimated efficiency score. Utilizing Kruskal-Wallis test, we find that all test statistics during the sampling period are far smaller than critical value in
2 The test statics from model 1 to model 10 are 291.6660, 267.8861, 278.7963, 288.81059, 300.4463, 301.3283,
280.5699, 285.2410, 300.2511 and 277.8885 individually. All of them are much larger than the critical value 23.209 (χ210, 0.01).
20
Table 8. Consequently, there are no differences between yntH when estimating efficiency scores.
4.2 Estimation results of efficiency function
This study adopt one-step model to estimate the distance and efficiency function simultaneously. As shown from Tables 4 to 6, this study first examines the influence of six governance indexes on efficiency respectively. In order to understand governance more complete and comprehensive, three governance dimensions are run independently and then all together which be shown in Table 7.
As Models 1 and 2 show in Table 4, both of VA and PS are positively significant coefficients, implying that the dimension of selection of the authority have positive effect on national R&D efficiency. If countries are not only democratic, but also express few limitations on expression, association, and media, it will improve national R&D efficiency. Whether the public actions in the economic fields are transparent enough also positively influence R&D efficiency. The results consist with the concept that economic freedom promotes aggregate efficiency. And this result is described in Section 2. On the other hand, the more stability on political situation or the less conflicts on ethnicity, religion, and vexed issues, the higher R&D efficiency will be.
From the results of Models 3 and 4 are shown in Table 5, both GE and RQ show positive and significant coefficients, suggesting that the dimension of government action have positive influence on countries' R&D efficiency. The more effective on government, such as high quality of public service, policy formulation and implementation, the higher R&D efficiency will be performed. Responding to Section 2, bureaucracy may causes influences on R&D efficiency, and further, this study proves that it will causes negative effect on R&D efficiency. The other dimension of government action, the regulatory quality, will also improves national
21 Table 4
The result of one-step model for distance and efficiency function - the dimension of Selection of the Authority
Variables
Model (1) VA Model (2) PS
Coefficients S.E. Coefficients S.E.
Distance function constant -2.6169*** 0.4107 -2.4170*** 0.3831 ln 𝐲�1 0.0202 0.1303 0.1012 0.1258 ln 𝐲�2 0.8563*** 0.1432 0.7472*** 0.1361 ln 𝐲�1 ln 𝐲�1 0.1031*** 0.0277 0.0814*** 0.0280 ln 𝐲�1 ln 𝐲�2 -0.0793*** 0.0236 -0.0666*** 0.0236 ln 𝐲�2 ln 𝐲�2 0.1169*** 0.0288 0.1133*** 0.0286 ln 𝐱�1 -0.6143*** 0.1902 -0.5582*** 0.1753 ln 𝐱�2 -0.4880*** 0.1643 -0.5254*** 0.1541 ln 𝐱�1 ln 𝐱�1 0.1908*** 0.0486 0.1679*** 0.0482 ln 𝐱�1 ln 𝐱�2 -0.1330*** 0.0374 -0.1243*** 0.0360 ln 𝐱�2 ln 𝐱�2 0.1037*** 0.0333 0.0999*** 0.0321 ln 𝐲�1 ln 𝐱1 -0.1165*** 0.0419 -0.0524 0.0401 ln 𝐲�1 ln 𝐱2 0.0646** 0.0265 0.0313 0.0249 ln 𝐲�2 ln 𝐱1 0.1680*** 0.0417 0.1095*** 0.0397 ln 𝐲�2 ln 𝐱2 -0.0923*** 0.0277 -0.0586** 0.0256 Efficiency Function Constant -0.4542*** 0.1466 -0.1132 0.2523 Governance variable 0.4150*** 0.0792 0.4318*** 0.1234 σ2 0.2393*** 0.0607 0.3225*** 0.1050 Γ 0.9437*** 0.0292 0.9497*** 0.0268 Log-likelihood -93.7372 -100.5689
Notes: *significance at 10%; **significance at 5%; ***significance at 1%. The results of the distance
function were estimated by using RLF as yntH. Number of observations = 369.
R&D efficiency, implying that price regulation and trade barriers are against R&D efficiency. Conversely, if the regulatory quality is beneficial to people, such as easy to starting business, mature regulation on anti monopoly, it will leads to positive impact on national R&D efficiency.
22 Table 5
The result of one-step model for distance and efficiency function - the dimension of Government Action
Variables
Model (3) GE Model (4) RQ
Coefficients S.E. Coefficients S.E.
Distance function constant -2.9267*** 0.4077 -7.6100*** 0.4103 ln 𝐲�1 -0.2001 0.1345 -0.1261 0.1273 ln 𝐲�2 1.0456*** 0.1493 1.0198*** 0.1434 ln 𝐲�1 ln 𝐲�1 0.1065*** 0.0271 0.0996*** 0.0292 ln 𝐲�1 ln 𝐲�2 -0.0650*** 0.0238 -0.0602** 0.0255 ln 𝐲�2 ln 𝐲�2 0.0853*** 0.0295 0.0870*** 0.0300 ln 𝐱�1 -0.6100*** 0.1929 -0.7454*** 0.1831 ln 𝐱�2 -0.4747*** 0.1639 -0.3380** 0.1619 ln 𝐱�1 ln 𝐱�1 0.2329*** 0.0500 0.1883*** 0.0478 ln 𝐱�1 ln 𝐱�2 -0.1580*** 0.0378 -0.1181*** 0.0369 ln 𝐱�2 ln 𝐱�2 0.1191*** 0.0331 0.0830** 0.0329 ln 𝐲�1 ln 𝐱1 -0.1434*** 0.0390 -0.1308*** 0.0390 ln 𝐲�1 ln 𝐱2 0.0925*** 0.0252 0.0803*** 0.0247 ln 𝐲�2 ln 𝐱1 0.1901*** 0.0398 0.1812*** 0.0395 ln 𝐲�2 ln 𝐱2 -0.1126*** 0.0268 -0.1118*** 0.0261 Efficiency Function Constant -0.6722*** 0.1014 -0.7155*** 0.0900 Governance variable 0.5128*** 0.0800 0.4669*** 0.0701 σ2 0.2107*** 0.0393 0.1758*** 0.0357 γ 0.9479*** 0.0296 0.9327*** 0.0362 Log-likelihood -81.7119 -78.9796
Notes: *significance at 10%; **significance at 5%; ***significance at 1%. The results of the distance
function were estimated by using RLF as yntH. Number of observations = 369.
The last dimension is shown in Models 5 and 6. Both coefficients of RL and CO are also positively significant. The results infer that greater respect for institutional framework can improve R&D efficiency. Namely, the more confidence in social rules for every citizens, the better performance in national R&D efficiency will be. Besides, if the corruptions are appropriately
23 Table 6
The result of one-step model for distance and efficiency function - the dimension of Respect for Institutional Framework
Variables
Model (5) RL Model (6) CO
Coefficients S.E. Coefficients S.E.
Distance function constant -2.8209*** 0.3970 -2.5738*** 0.4030 ln 𝐲�1 -0.1242 0.1289 -0.1314 0.1377 ln 𝐲�2 0.9976*** 0.1439 0.9784*** 0.1521 ln 𝐲�1 ln 𝐲�1 0.1182*** 0.0262 0.1070*** 0.0275 ln 𝐲�1 ln 𝐲�2 -0.0793*** 0.0226 -0.0718*** 0.0240 ln 𝐲�2 ln 𝐲�2 0.1044*** 0.0284 0.0975*** 0.0299 ln 𝐱�1 -0.5980*** 0.1858 -0.4972*** 0.1928 ln 𝐱�2 -0.4988*** 0.1604 -0.6029*** 0.1629 ln 𝐱�1 ln 𝐱�1 0.2235*** 0.0473 0.2470*** 0.0493 ln 𝐱�1 ln 𝐱�2 -0.1556*** 0.0365 -0.1787*** 0.0375 ln 𝐱�2 ln 𝐱�2 0.1208*** 0.0325 0.1429*** 0.0329 ln 𝐲�1 ln 𝐱1 -0.1406*** 0.0381 -0.1323*** 0.0397 ln 𝐲�1 ln 𝐱2 0.0855*** 0.0246 0.0824*** 0.0260 ln 𝐲�2 ln 𝐱1 0.1910*** 0.0385 0.1827*** 0.0402 ln 𝐲�2 ln 𝐱2 -0.1117*** 0.0259 -0.1037*** 0.0272 Efficiency Function Constant -0.5694*** 0.0947 -0.4961*** 0.1166 Governance variable 0.4509*** 0.0679 0.4677*** 0.0829 σ2 0.2003*** 0.0376 0.2313*** 0.0467 γ 0.9492*** 0.0295 0.9508*** 0.0295 Log-likelihood -77.8541 -83.4505
Notes: *significance at 10%; **significance at 5%; ***significance at 1%. The results of the distance
function were estimated by using RLF as yntH. Number of observations = 369.
controlled, then it will improve national R&D efficiency. This result supports the concept that corruption is harmful to R&D activities.
24
After examining six governance indexes respectively, this study further uses the classification from Kaufmann et al. (2010) and groups them into three dimensions, SAU, GAC and RIN. In Table 7, the results show that all coefficients of three variables respectively display positive and significant.
As the result shows in the three variables continue to be put together. SAU, GAC and RIN still have positive coefficients but GAC is the only one significant. Reviewing the results from Tables 4 to 6, all governance indexes significantly influence national R&D efficiency. In Table 5, the magnitude of coefficient show that GE's coefficient which is 0.5128 is larger than the other five indexes. In Table 7, GAC's coefficient which is 0.5134 is also larger than the other two indexes. The magnitude infers that the government action especially GE plays an important role in promoting R&D efficiency.
25 Table 7
The result of one-step model for distance function and efficiency function - three governance dimensions
Model (7) Model (8) Model (9) Model (10) Variables Coefficient Coefficient Coefficient Coefficient
Distance function constant -2.6398*** -3.0805*** -2.7291*** -2.9846*** (0.4172) (0.4037) (0.3967) (0.4146) ln 𝐲�1 0.0102 -0.1849 -0.1446 -0.1801*** (0.1343) (0.1286) (0.1310) (0.1286) ln 𝐲�2 0.8580*** 1.0566*** 1.0044*** 1.0476*** (0.1469) (0.1445) (0.1461) (0.1445) ln 𝐲�1 ln 𝐲�1 0.0889*** 0.1034*** 0.1122*** 0.1051*** (0.0284) (0.0279) (0.0269) (0.0284) ln 𝐲�1 ln 𝐲�2 -0.0652*** -0.0611*** -0.0744*** -0.0641*** (0.0249) (0.0242) (0.0234) (0.0247) ln 𝐲�2 ln 𝐲�2 0.1044*** 0.0832*** 0.0988*** 0.0869*** (0.0299) (0.0292) (0.0290) (0.0295) ln 𝐱�1 -0.6562*** -0.6989*** -0.5579*** -0.6636*** (0.1927) (0.1855) (0.1879) (0.1943) ln 𝐱�2 -0.4658*** -0.3923** -0.5447*** -0.4367*** (0.1665) (0.1603) (0.1605) (0.1686) ln 𝐱�1 ln 𝐱�1 0.1495*** 0.2061*** 0.2347*** 0.2107*** (0.0554) (0.0490) (0.0487) (0.0551) ln 𝐱�1 ln 𝐱�2 -0.1135*** -0.1356*** -0.1671*** -0.1438*** (0.0401) (0.0371) (0.0370) (0.0407) ln 𝐱�2 ln 𝐱�2 0.0945*** 0.0998*** 0.1322*** 0.1097*** (0.0343) (0.0326) (0.0325) (0.0350) ln 𝐲�1 ln 𝐱1 -0.0919** -0.1417*** -0.1404*** -0.1426*** (0.0416) (0.0388) (0.0385) (0.0389) ln 𝐲�1 ln 𝐱2 0.0550** 0.0900*** 0.0870*** 0.0904*** (0.0265) (0.0247) (0.0249) (0.0247) ln 𝐲�2 ln 𝐱1 0.1487*** 0.1907*** 0.1908*** 0.1923*** (0.0416) (0.0398) (0.0392) (0.0398) ln 𝐲�2 ln 𝐱2 -0.0841*** -0.1161*** -0.1106*** -0.1156*** (0.0277) (0.0263) (0.0263) (0.0263) Efficiency function constant -0.4627*** -0.7262*** -0.5581*** -0.6864*** (0.1400) (0.0890) (0.0992) (0.1017) SAU 0.4875*** 0.0238 (0.0916) (0.1031) GAC 0.5134*** 0.3255** (0.0753) (0.1648) RIN 0.4731*** 0.1666 (0.0751) (0.1569) σ2 0.2264*** 0.1874*** 0.2093*** 0.1902*** (0.0559) (0.0348) (0.0392) (0.0356) γ 0.9319*** 0.9387*** 0.9476*** 0.9387*** (0.0362) (0.0338) (0.0313) (0.0359) Log-likelihood -92.6155 -77.9529 -79.1361 -77.1731
Notes: *significance at 10%; **significance at 5%; ***significance at 1%. The result of the distance
function were estimated by using RLF as yntH. Number of observations = 369. Standard error in parentheses.
26 Table 8
Result of the Kruskal-Wallis test
Year 1998 2000 2002 2003 2004 2005 2006 2007 2008 Test statistics 0.002 0.003 0.000 0.002 0.002 0.002 0.001 0.001 0.011 Null hypothesis Accept Accept Accept Accept Accept Accept Accept Accept Accept
Notes: The null hypothesis is that there is no difference between yntH when estimating efficiency scores. The critical value of the χ2 distribution with d.f. 2 is 5.991 at 5% level.
4.3 The result of national R&D efficiency
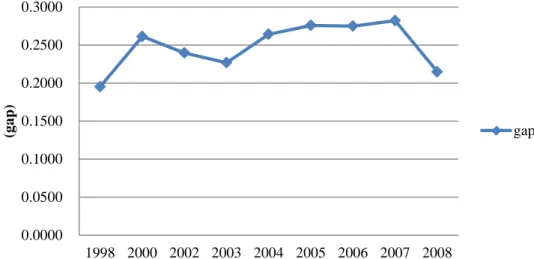
After exploring the governance indexes, this study further classifies efficiency scores into two groups and five regions which reported on table 9. On the top part of the table, the efficiency scores of OECD members are much larger than non-OECD members. For each groups, the average efficiency scores are 0.7456 and 0.4973 separately. In Figure 2, the difference between two groups in 1998 is slightly lower than 0.2. Except for first year, all differences between OECD and non-OECD members are between 0.2148 and 0.2758. The average difference during the period is 0.2483.
Table 9
National R&D efficiency across groups and regions
1998 2000 2002 2003 2004 2005 2006 2007 2008 Ave. Groups OECD 0.7541 0.7565 0.7526 0.7212 0.7424 0.7413 0.7486 0.7559 0.7375 0.7456 Non-OECD 0.5590 0.4953 0.5130 0.4943 0.4781 0.4654 0.4737 0.4738 0.5227 0.4973 Regions Africa -- 0.3905 0.2671 0.3136 0.2818 0.3683 0.1633 0.4390 -- 0.3177 America 0.7038 0.6793 0.6599 0.6025 0.5536 0.5884 0.5970 0.6148 0.6169 0.6240 Asia 0.6067 0.5891 0.5857 0.5363 0.5965 0.5381 0.6254 0.5234 0.6224 0.5804 Europe 0.6998 0.6968 0.6975 0.6685 0.6785 0.6730 0.6623 0.6770 0.6575 0.6790 Oceania 0.9145 0.8995 0.8239 0.9347 0.8285 0.9328 0.8149 0.9267 0.8109 0.8763
27
Figure 2 Gaps in average efficiency score between OECD and Non-OECD members
From a regional perspective, it can be observed that Oceania gets the highest efficiency score and Africa gets the lowest one whose averages are 0.8763 and 0.3177 respectively. Europe and America particularly have not too much different on average efficiency scores and Asia's average efficiency score is a bit lower than the two regions. The gap in average efficiency score between Europe and America is only 0.055. For the last five years, the gaps are decreasing from 0.1249 to 0.0407, and the figure of decreasing tendency is shown below.
Figure 3 Gaps in average efficiency score between Europe and America 0.0000 0.0500 0.1000 0.1500 0.2000 0.2500 0.3000 1998 2000 2002 2003 2004 2005 2006 2007 2008 (gap ) gap 0.00 0.02 0.04 0.06 0.08 0.10 0.12 0.14 2004 2005 2006 2007 2008 (gap ) (year) gap
28
From each countries point of view, the efficiency scores and total ranks are shown in table 10. Ranking by scores, Chile, Ireland, and New Zealand are the top three countries in all of 59 countries. All their efficiency scores are above 0.93. Contrary to those countries, Philippines, Ukraine and Morocco are the last three countries. All their efficiency scores are below 0.22. The average difference of the efficiency score between top and last three countries is up to 0.79.
29 Table 10
National R&D efficiency and ranking
Nations Mean Rank Nations Mean Rank
Argentina Australia Austria Belgium
Bosnia and Herze Brazil Bulgaria Canada Chile China Croatia Cyprus Czech Republic Estonia Ethiopia Finland France Germany Greece Guatemala Hungary Iceland India Ireland Italy Japan Kenya Latvia Lithuania Luxembourg 0.4946 0.8467 0.6945 0.7477 0.4740 0.3967 0.6484 0.7504 0.9559 0.4790 0.6648 0.8586 0.6518 0.7633 0.4513 0.6423 0.5598 0.6201 0.8653 0.2972 0.8370 0.6628 0.6282 0.9357 0.8746 0.6500 0.4390 0.3166 0.5061 0.3438 37 12 23 21 39 48 28 20 1 38 24 11 26 19 41 29 34 32 10 55 13 25 31 2 9 27 43 54 36 52 Macedonia, FYR Madagascar Malaysia Malta Mexico Moldova Morocco Netherlands New Zealand Norway Pakistan Paraguay Philippines Poland Portugal Romania Russia Singapore Slovak Republic Slovenia South Africa South Korea Spain Sweden Thailand Tunisia Ukraine United Kingdom United States 0.4419 0.2635 0.3822 0.9025 0.4182 0.4282 0.1633 0.8889 0.9314 0.7742 0.3367 0.4714 0.2173 0.7949 0.6312 0.4062 0.3494 0.8316 0.5438 0.7751 0.6174 0.8260 0.7406 0.8857 0.3976 0.3493 0.2026 0.8847 0.8935 42 56 49 4 45 44 59 6 3 18 53 40 57 16 30 46 50 14 35 17 33 15 22 7 47 51 58 8 5
30
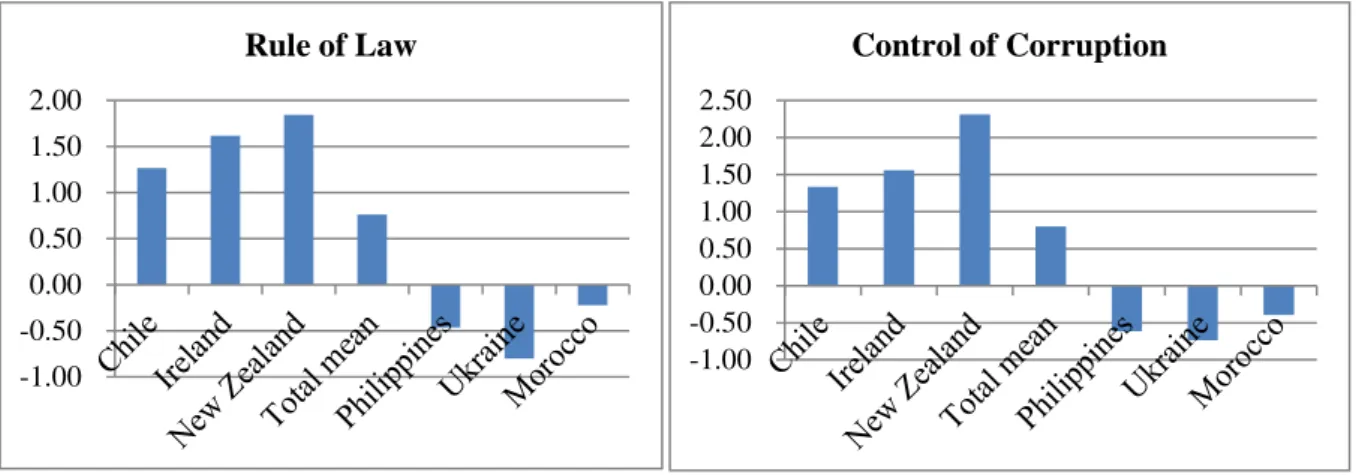
Figures 3 to 6 post the comparison between top and last three countries, and all nations' mean for six governance indexes. Exploring the top and last three countries' governance indexes, Chile, Ireland and New Zealand are much higher than total mean4 , but Philippines, Ukraine and Morocco are completely not the case. The results show no exceptions among the six indexes. On average, we observe that nations with better governance also get higher efficiency scores.
Figure 4 Governance index of VA Figure 5 Governance index of PS
Figure 6 Governance index of GE Figure 7 Governance index of RQ
4 Table 3 shows the descriptive statistics of total mean calculated from 59 countries.
-1.00 -0.50 0.00 0.50 1.00 1.50 2.00
Voice and Accountability
-2.00 -1.50 -1.00 -0.50 0.00 0.50 1.00 1.50
Political Stability and Absence of Violence -1.00 -0.50 0.00 0.50 1.00 1.50 2.00 Government Effectiveness -1.00 -0.50 0.00 0.50 1.00 1.50 2.00 Regulatory Quality
31
Figure 8 Governance index of RL Figure 9 Governance index of CO
From Models 1 to 6, we observe that six governance indexes increase national R&D efficiency. Taking governance indexes into account, we further find the countries which got high R&D efficiency scores also have high governance indexes. The results indicate the importance of public governance. And the results also manifest that it is essential to improve countries' public governance if they get lower R&D efficiency scores.
-1.00 -0.50 0.00 0.50 1.00 1.50 2.00 Rule of Law -1.00 -0.50 0.00 0.50 1.00 1.50 2.00 2.50 Control of Corruption
32
5. Conclusions and policy implications
Numerous studies had showed that R&D efficiency indeed improved the economic growth. In viewing of this, finding the factors which can promote R&D efficiency become a critical issue. Concerning the public governance, so far, most of prior studies focused on single policy. However, public governance contains many aspects. It may give the partial views if we just exam the single policy. Therefore, this study aims at government administration and uses six governance indicators developed by Kaufman et al. (2010), providing a comprehensive analysis between the public governance and national R&D efficiency.
This study adopts SFA approach and one-step model, estimating the parameters of distance function and efficiency function simultaneously. Through LR test, we show that translog specification is more suitable than Cobb-Douglas function form. Through Kruskal–Wallis test, we provide the evidence that there is no difference if we regard any of the three outputs as yntH.
The empirical results show that six governance indexes all have positive influences on R&D efficiency. In the dimension of ‘selection of the authority’, VA and PS increase the R&D efficiency. VA mainly measures the level of economic freedom and democracy. If economic policies which include fiscal, taxation, exchange rate are transparent enough, investor will increase the motive on R&D activities because of the friendly aggregate environment. Democracy and science are mutually reinforcing. Science can survive only if it is free economy. It will not only add creativity but the imagination of democracy (Shiv, 1998). For PS, if political situation is stable enough, the staffs who want to dedicate to R&D activities could face fewer future uncertainties which result from political turbulence. It is also the cause that staffs will take PS into consideration when doing the R&D activities.
‘Government action’ which contains GE and RQ will all increase the R&D efficiency. Besides, GE especially plays the most important role among the six indexes. This suggests
33
that putting emphasis on the quality of public services, the quality of civil services, and the credibility of government's commitment will increase much more R&D efficiency. In order to improve R&D efficiency, this result give a direction that we can pay more attention on GE. For RQ, according to the definition, to enhance regulatory quality is beneficial to the development of private sector. If private sector is prosperous, it will trigger R&D activities much easily.
The last dimension, ‘respect for institutional framework’. Including RL and CO, increases the R&D efficiency likewise. If countries have a sound judicial system, it will help the interaction of social and economic. And the interaction is under people's trust and obedience to the social rules. A sound judicial also covers the laws related to R&D. Under the protection of the laws, it can encourage more staffs to do R&D activities. For CO, as above mentioned, control of corruption positively related to foreign direct investment. Considering the effect of knowledge spillover, from our empirical results, if the corruption is better controlled, it can induce more R&D efficiency. The result is consistent with the statement that corrupt is not beneficial to innovation (Mareco, 2008).
Observing nations' efficiency scores by groups, OECD members are quite higher than Non-OECD members. Classifying countries into five regions, Oceania get the highest score and Africa gets the lowest one. Europe and America get almost the same scores whose average difference is only 0.055. Asia gets fourth place among five regions whose efficiency score is 0.5804.
Comparing efficiency scores by nations, Chile, Ireland, and New Zealand are the top three countries that the efficiency scores are above 0.93. However, Philippines, Ukraine and Morocco are the last three countries that the efficiency scores are below 0.22. We further observe that top three countries' governance indexes are appreciably higher than total mean; nevertheless, the last three countries' indexes are all lower than total mean. It infers that good governance will have positive effects on national R&D efficiency. And it conveys the same
34
concept to the results of models 1 to 6, highlighting the importance of public governance once again.
For an effective promotion of democracy, socio-economic development must be a central component (Julian and Franziska, 2009). In the socio-economic development, R&D activities are prerequisites in the era of competition and globalization. Through innovation, nations could unceasingly create new values which lead to economic growth. To increase the R&D efficiency, government should improve the public governance. Each index that mentioned in this study are the right direction to work for. Government should make a self-examination whether there is still room for improvement from every aspects. The government effectiveness is the most important factor in this study. For improving R&D efficiency, it is worth spending more attention on GE.
At the empirical level, we propose some aspects for future research. First, this study estimates the R&D efficiency and governance indexes from the view point of overall nations. It should be interesting to take deeply analysis by individual countries. As a result, policymakers could further understand the weaknesses through the comparison of each nation. Second, utilizing unbalanced panel data, this study collects 59 countries. In fact, some regions just include few nations. For example, Oceania includes two nations and Africa includes five nations. Complete analysis will be shown by adding more nations. Third, the inputs and outputs are dynamic process. It means the first year's inputs may not exactly reflect in the first year's outputs. If future studies could take objective time lag into consideration, the results will be closer to reality.
35
References
Adkins, C., Moomaw, R. and Savvides, A. (2002). “Institutions, freedom, and technical efficiency, ” Southern Economic Journal, 69, pp. 92–108.
Altay, H. and Çelebioğlu, F. (2011). “Spatial analysis of relations among democracy, economic freedom and economic growth: a research on the European countries,” Journal of Faculty of Economics and Administrative Sciences, 16, pp. 219–234.
Asiedu, E. (2006). “Foreign direct investment in Africa: The role of natural resources, market size, government policy, institutions and political instability,” World Economy, 29, pp. 63–77.
Azam, C. and Phillip, G. (2007). “Do governments suppress growth? institutions, rent-Seeking, and innovation blocking in a model of Schumpeterian growth,” Economics & Politics, 19, pp. 35–52.
Baker, T., Gedajlovic, E. and Lubatkin, M. (2005). “A framework for comparing entrepreneurship processes across nations,” International Business Studies, 36, pp. 492–504.
Blayse, A. M. and Manley, K. (2004). “Key influences on construction innovation,” Construction Innovation, 4, pp. 143–154.
Chang, M. C. and Hu, J. L. (2013). “Public governance and the operational and environmental efficiencies of EU countries,” Advances in Management and Applied Economics, 3(4), pp.105–117.
Chen, C. P., Hu, J. L. and Yang, C. H. (2011). “An international comparison of R&D efficiency of multiple innovative outputs: The role of the national innovation system,” Innovation: Management, Policy & Practice, 13, pp. 341–360.
Coe, D. T. and Helpman, E. (1995). “International R&D spillovers,” European Economic Review, 39, pp. 859–887.
36
Coelli, T. J. and Perelman, S. (2000). “Technical efficiency of European railways: a distance function approach,” Applied Economics, 32, pp. 1967–1976.
Coelli, T. J., Prasada Rao, D. S., O’Donnell, C. J. and Battese, G. E. (2005). An Introduction to Efficiency and Productivity Analysis, 2nd edition, Boston (MA): Kluwer Academic Publishers.
Conte, A., Schweizer, P., Dierx, A., and Ilzkovitz, F. (2009). “An analysis of the efficiency of public spending and national policies in the area of R&D,” European Economy, 54, pp. 1–63.
Färe, R. and Primont, D. (1995). Multi-Output Production and Duality: Theory and Applications , Boston, MA: Kluwer Academic.
Fu, X. and Yang, Q. G. (2009). “Exploring the cross-country gap in patenting: a stochastic frontier approach,” Research Policy, 38, pp. 1203–1213.
Griffith, R., Redding, S. and John, V. R. (2004). “Mapping the two faces of R&D: productivity growth in a panel of OECD industries,” Review of Economics and Statistics, 86, pp. 883–895.
Grosskopf, S., Hayes, K., Taylor, L. and Weber, W. (1996). “Budget constrained frontier measures of fiscal equality and efficiency in schooling,” Review of Economics and Statistics, 79, pp. 116–124.
Guellec, D. and van Pottelsberghe de la Potterie, B. (2004). “From R&D to productivity growth: do the institutional settings and the source of funds of R&D matter?,” Oxford Bulletin of Economics and Statistics, 66, pp. 353–378.
Hall, B. H. and Mairesse, J. (1995). “Exploring the relationship between R&D and productivity in French manufacturing firms,” Journal of Econometrics, 65, pp. 263–293. Habib, M. and Zurawicki, L. (2002). “Corruption and foreign direct investment,” Journal of
International Business Studies, 33, pp. 291–307.
37
J a p a n e s e p h a r m a c e u t i c a l i n d u s t r y, ” R e s e a rc h P o l i c y , 3 7 , p p . 1 8 2 9 – 1 8 3 6 . Hu, J. L., Yang C. H., and Chen, C. P. (2011). “R&D Efficiency and the National Innovation System: An International Comparison Using the Distance Function Approach,” Bulletin of Economic Research, DOI:10.1111/j.1467-8586.2011.00417.x.
Ishtiaq, P. M. and Carlos R. (2005). “Government's dilemma: The role of government in imitation and innovation,” Academy of Management Review, 30, pp. 338–360.
Julian, W. and Franziska, D. (2009). “Modernization and democracy: theories and evidence revisited,” Living Reviews in Democracy, 1, pp. 1–9.
Kaufmann, D., Kraay, A. and Mastruzzi, M. (2010). “The worldwide governance indicators: methodology and analytical issues,” World Bank Policy Research Working Paper, 5430. Kormendi, R. C. and Meguire, P. G. (1985). “Macroeconomic determinants of growth:
cross-country evidence,” Journal of Monetary Economics, 16, pp. 141–163.
Kumbhakar, S. C. and Lovell, C. A. K. (2000). Stochastic Frontier Analysis, New York: Cambridge University Press.
Lee, H. and Park, Y. (2005). “An international comparison of R&D efficiency: DEA approach,” Asian Journal of Technology Innovation, 13, pp. 207–221.
Lio, M. C. and Hu, J. L. (2009), “Governance and Agricultural Production Efficiency: aCross-Country Aggregate Frontier Analysis,” Journal of Agricultural Economics, 60, pp. 40–61.
Lovell, C. A. K., Richardson, S., Travers, P. and Wood, L. L. (1994). “Resources and functions: a new view of inequality in Australia,” in Eichhorn, W. (ed.), Models and Measurement of Welfare and Inequality, Berlin: Springer-Verlag, pp. 787–807. Mairesse, J. and Hall, B. H. (1996). “Estimating the productivity of research and development in French and US manufacturing firms: an exploration of simultaneity issues with GMM methods,” NBER Working Paper, No. 5501.