Liquid crystal surface alignments
by using films composed of magnetic nanoparticles
Ru-Pin Pan, Hsin-Ying Wu, Cho-Fan Hsieh
Department of Electrophysics, National Chiao Tung University
Hsinchu, Taiwan 30010, Republic of China
Contact: [email protected]
ABSTRACT
A method for liquid crystal surface alignment by using a one-step, ion beam sputtering on glass substrates is demonstrated. Pre-coating by polyimide is not necessary. We use a diode-type sputter to treat the glass substrates with Ar ion-beam. The homeotropic alignments for nematic liquid crystals are achieved. The alignments are characterized by using the polarizing optical microscope and the conoscope. To find out the alignment mechanism, the studies by using super conducting quantum interference device and scanning probe microscopy are carried out. The surveyed surface morphology reveals that the films are amorphous and composed of nanoparticles with dimensions around 30 nm. The magnetization anisotropy of the sputtered magnetic films is analyzed. The polar anchoring strengths of the coated films with different thicknesses are measured and compared with their saturation magnetization. We deduce that the homeotropic alignment is achieved due to the orientation of the diamagnetic nematogenic molecules in the magnetic field caused by the γ-Fe2O3 ferrimagnetic thin films. A simple model of alternatively distributed magnetic moments with
opposite direction is proposed. The profile of magnetic field strength near the surface is then calculated to compare with the measured alignment strength.
Keywords: liquid crystal, surface alignment, iron oxide, magnetic nanoparticles, ferrimagnetic thin film, ion beam
sputtering, magnetization, polar anchoring strength
1. INTRODUCTION
It is well known that the liquid crystal (LC) molecules can be reorientated by electric and magnetic field due to their anisotropic electrical permittivity and magnetic susceptibility [1]. The electro-optical effect of nematic liquid crystals (NLCs) has been widely used in liquid crystal displays (LCDs). On the other hand, surface alignments of liquid crystals are essential in fabrication of LCDs. It gives the boundary condition for the molecular orientation at the surface and determines how the molecules in a cell are aligned without any applied field. The most common alignment method used in LCD industries right now is the rubbing method, which employs a velvet rubbing process on polyimide (PI) coated on substrates. In spite of its success, this method has some drawbacks such as leaving debris and electrostatic charges on the rubbed surfaces [2]. Besides, it becomes increasingly difficult to maintain uniformity as the substrate size of LCD gets larger rapidly in industry. It is important to look for new alignment methods, specially the non-contact alignment methods. One of the alternative alignment methods, ion beam (IB) alignment, had been reported by an IBM group [3-6]. They have successfully realized this non-contact alignment technology by integrating low energy ion beam equipments and diamond-like carbon (DLC) thin films into LCD manufacturing processes. The mechanism of this alignment method was attributed to the anisotropical change of bindings between carbon atoms caused by ion beam bombardment [6]. Several studies devoted to ion-beam bombarded DLC and PI films have also been reported by other groups[7-11]. One of the that them pointed out that a homeotropic alignments can be obtained by using fluorinated DLC thin films as the alignment layer and the pretilt angle can also be controlled by choosing different ion-beam parameters or the concentration of fluorine doped in DLC films [11]. In addition, by choosing the ion beam energy, one can control to get a homogeneous or homeotropic alignment [8-10]. This ability of controlling the alignment modes makes the ion-beam alignment method potentially useful in LC-based applications, especially in LCDs industry.
Recently, we have reported that both homogeneous and homeotropic alignments can be induced by argon ion beam
bombardments with low and high energy, respectively, on the same kind of polyimide film [12]. Even the clean glass substrates bombarded with high energy ions can achieve the homeotropic alignments [13]. We have proposed that the magnetic field induced by the sputtered γ-Fe2O3 composites and the molecular-orbital interactions between the Fe atoms
and cyanobenzene of 5CB are responsible for the alignment mechanism. In this paper, we will give more discussions on the proposed mechanism.
2. EXPERIMENTS
2.1 Ferric films preparation and characterization
In this work, we have used a direct-current (dc) diode-type ion beam sputter [12] (model IB-2 from EIKO Engineering Co., Ltd.) for ion beam treatment. The sputter can be used either as a coating or etching device, depending on the polarity of the voltage. When the etching mode is selected, the bottom electrode, on which the sample substrates are set, acts as the cathode. The substrates are etched by ion beams from induced glow discharge near the top electrode. On the other hand, in the coating mode, the bottom electrode is chosen as the anode and the sample substrates are then uniformly coated with the target material mounted on the top. Stainless steel electrode is used for the top electrode. The energy of ions is varied by changing the dc voltage between electrodes. Before each ion-beam process, the chamber is pumped down to a base pressure of 30 mTorr and then argon gas is fed into the chamber to a target pressure of 55 mTorr.
The indium-tin-oxide (ITO) coated glasses are used as the substrates. After cleaning, the substrates are directly treated by ion beams sputtering without any PI coating. The ion energy, current density, and coating time for ion beam treatment are 1120 V, 255 µA/cm2, and 5 min, respectively. In this work, all parameters except for the coating time remain the same.
Under such a circumstance, the coating rate of 21.2 nm/min is determined by ellipsometry.
As described in the previous work [13], the sputtered films are also characterized by using x-ray photoemission spectroscopy (XPS) and ultraviolet-visible spectroscopy. For the XPS, a PHI dual-anode x-ray monochromatic source for the x-ray irradiation of Mg Kα (1253.6 eV) and Al Kα (1486.6 eV) and a PHI 10-360 precision energy analyzer are used. The incident angle of the x-ray is 36° from the sample normal and the photoelectrons are detected at the angle of 45° from the sample normal. The base pressure during acquirement is below 5.0×10⁻⁹ Torr. The anode voltage is set at 15 kV
(x-ray power 250 W).
2.2 magnetic properties and surface morphology
We have also measured the magnetization of the sputtered films to verify its magnetic properties. A super conducting quantum interference device (SQUID, MPMS-XL7, Quantum Design) equipped with a superconducting magnet with maximum strength of 70 kOe has been used for this measurement. The typical sensitivity of the magnetization measurement is better than 1×10⁻⁸ emu (H<2.5 kOe). Besides, the superficial distribution of the magnetization and
morphology on the film surface are investigated by the scanning probe microscopy (SPM) unit system (SPA-300HV, SII Nano Technology Inc.) operated in dynamic force mode (magnetic force microscope, MFM) and contact mode (atomic force microscope, AFM), respectively.
2.3 Sample characterization and polar anchoring strength measurement
To investigate the relation between the polar anchoring strength (PAS) and the thickness of ferric films, the experimental determination of polar anchoring strength is carried out by using the external field methods [14-15]. Two identically treated substrates are assembled with a Mylar spacer of specific thickness in between to form an empty cell. The thickness of spacer is chosen in the range from 6 µm to 50 µm to satisfy the requirements for the measuring methods. Various Merck NLCs such as 4′-n-pentyl-4-cyanobiphenyl (5CB) and MLC-6608 are then filled into the empty cells. The dielectric anisotropy of the former is positive while the later is negative. The pretilt angle and thickness of LC layer are simultaneously obtained by crystal rotation method [16]. For comparison, the MLC-6608 cells with homeotropic alignment induced by N, N-dimethyl-N-octadecyl-3-aminopropyltrimethoxysilyl chloride (DMOAP) coating are also prepared for PAS measurements. The surface alignments are characterized by using conoscope and polarizing optical microscope.
3. RESULTS AND DISCUSSIONS
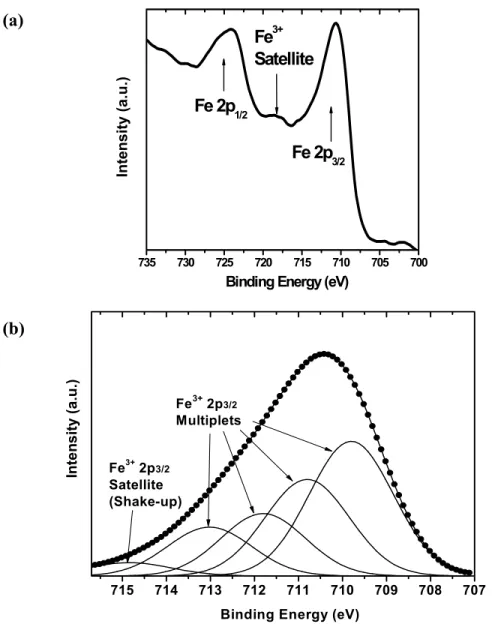
In a previous work, we have reported a novel and reliable method of liquid crystal alignment using transparent magnetic thin films have been proposed [13]. The composites of the thin films are characterized by XPS analyses. Figure 1 (a) shows the multiplex mode scanning of Fe 2p region on the sputtered composites and the narrow peak at 710.4 eV indicates that no Fe2+ iron oxidation state exists [17-18]. Furthermore, the measured spectrum is deconvoluted into
multiple Gaussian peaks. The Fe 2p3/2 envelope of the spectrum is well fitted using the peaks constrained to conform to
the multiplets calculated for the iron compound γ-Fe2O3 by Gupta and Sen [19]. As shown in Fig. 1(b), the four Fe3+ 2p3/2
multiplet peaks with binding energy at 709.8, 710.8, 711.8, and 713.0 eV are due to the inclusion of electrostatic interactions and spin-orbit coupling in theoretical calculation [20]. The presence of satellite peak structures have been ascribed to the shake-up processes [21]. Accordingly, the composites of the sputtered film are characterized as the maghemite, γ-Fe2O3.
735 730 725 720 715 710 705 700
Binding Energy (eV)
Inte nsity ( a.u. )
Fe 2p
3/2Fe 2p
1/2Fe
3+Satellite
715 714 713 712 711 710 709 708 707 Fe3+ 2p3/2 Multiplets In ten s it y (a. u .)Binding Energy (eV) Fe3+ 2p3/2
Satellite (Shake-up)
(a)
(b)
Fig. 1 The XPS spectra of the coated composites: (a) Fe 2p spectrum in multiplex mode; (b) The Shirley background-subtracted Fe 2p3/2 spectrum.
rcbrv j
4A(.bffF
'Cbrv,
I IIBryn
/1.LflrQ,ryB
I hi II? IIIfl TI I A
The measured magnetization versus temperature by SQUID shows a minimum that corresponds to the compensation temperature, a typical feature of ferrimagnetism. Accordingly, we deduced that the magnetic moment of γ-Fe2O3 material
would likely be responsible for the alignment mechanism of NLC.
Base on these points, we have investigated the relation between the surface anchoring strength and the magnetization of γ-Fe2O3 film. For the purpose of measuring PAS, the NLC cells with homeotropic alignment are prepared and shown in
Fig. 2. The alignment qualities of γ-Fe2O3 film are as good as those given by DMOAP films. Figure 2 (a) shows the
optical behavior and uniformities of the MLC-6608 sample with a picture of these cells under crossed polarizers; the inset is a conoscopic picture. In Fig 2(b), we show the picture of the same samples but tilted from the polarizer plane. The homeotropic alignment of NLC is confirmed with these pictures. The alignment effects of 5CB on the γ-Fe2O3 films
are also demonstrated with the tilt-view of the samples as shown in Fig. 2 (d). The photograph of the cells without polarizers is shown in Fig. 2 (c). It should be noticed that the ITO coated glass substrate with the γ-Fe2O3 film coating is
not totally transparent in the visible band. However, the measured transmittance of a γ-Fe2O3 film with thickness of 212
nm is higher than 90%.
The electro-optical (EO) responses of the MLC-6608 cells with γ-Fe2O3 and DMOAP coating are measured under
crossed polarizers and shown in Fig. 3. The phase retardation R is transformed from the transmittance T and normalized by the maximum phase retardation Rmax which is calculated with the measured thickness and pretilt angle of the NLC
cell. The measured T-V curves are stable and reproducible. Furthermore, the PAS can be derived from theoretical analyses on this EO response [15]. The extracted polar anchoring strength, Wp, as a function of coating time is plotted in
Fig. 4. For the MLC-6608 cells with the coating time of 10, 20, and 30 min, their PAS are 1.1×10⁻⁴, 7.9×10⁻⁵, and
4.8×10⁻⁵ J/m2, respectively. The γ-Fe
2O3 coated cells with thickness of 212 and 424 nm have the PAS stronger than
7.11×10⁻⁵ J/m2 measured for the cell with DMOAP coating. Furthermore, the comparison of PAS of 5CB on these two
alignment layers is also carried out. The PAS is obtained by using the magnetic field method [14]. The measured results are 2.0×10⁻⁴ and 3.4×10⁻⁵ J/m2 for 10 min γ-Fe
2O3 and DMOAP coating, respectively. According to these results, the
Fe2O3 DMOAP Fe2O3 DMOAP (a) (b) (c) (d) 10 min 20 min 10 min 20 min
Fig. 2 (a) Top-view and (b) tilt-view of the MLC-6608 cells with γ-Fe2O3 and DMOAP coating under
crossed-polarizers; (c) top-view (without polarizers) and (d) tilt-view of the 5CB cells coated with different thickness of γ-Fe2O3 films. Inset: the conoscopic pattern of the MLC-6608 cells with γ-Fe2O3 coating.
γ-Fe2O3 film with thickness less than 20 nm reveals an anchoring effect stronger than that by the DMOAP film.
Fig. 3 The normalized phase retardation of MLC-6608 cells at different applied voltage. Inset: the measured curves of transmittance versus applied voltage.
0 5 10 15 20 0.0 0.2 0.4 0.6 0.8 1.0 R/ R ma x Vrms (Volt) Fe2O3 DMOAP 0.0 2.5 5.0 7.5 10.0 12.5 15.0 17.5 20.0 0.0 0.2 0.4 0.6 0.8 1.0 Tr ansm it tance Vrms (Volt) 200 300 400 500 600 700 0.0 0.2 0.4 0.6 0.8 1.0 1.2 0.2 0.4 0.6 0.8 1.0 1.2 W p (1 0 -4 J/ m 2 ) Thickness (nm) M s ( em u /g )
To find out the possible mechanisms of the NLC alignment on the γ-Fe2O3 film, the magnetic properties such as the net
magnetization Mnet and saturation magnetization Ms of the γ-Fe2O3 films are determined by using SQUID. All the
measurements in this work are carried out at a temperature of 300 K. The net magnetization Mnet of the sample before
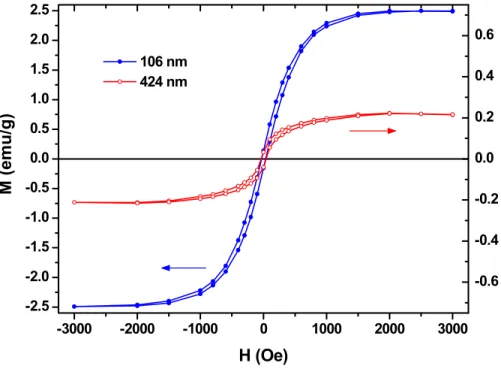
applying any magnetic field in M-H measurement has also been measured. As shown in Fig. 5, the hysteresis loops measured in the direction parallel to the film surfaces for two samples with thickness of 106 and 424 nm are demonstrated. The magnetizations at H 3 kOe, saturation magnetization, are determined as 2.52 and 0.23 emu/g for film thickness of 106 and 424 nm, respectively. The saturation magnetizations measured in the direction normal to the film surface have also been obtained as 0.94, 0.26, and 0.16 emu/g for film thickness of 212, 424, and 636 nm, respectively, as shown in Fig. 4. The result seem to indicate that the surface anchoring effect is related to the magnetization of the γ-Fe2O3 film. More studies on the anisotropy of magnetization are still in progress.
Besides, we have also investigated the surface morphologies of the sputtered γ-Fe2O3 films by AFM. Figure 6 (a) and (b)
shows the surveyed morphology of a γ-Fe2O3 film with thickness of 169.6 nm. Three positions have been randomly
chosen for the particle size analysis. Their surface profiles are shown in Fig. 6 (c). The mean size of the particles composed of γ-Fe2O3 material is 30±5 nm.
-3000 -2000 -1000 0 1000 2000 3000 -2.5 -2.0 -1.5 -1.0 -0.5 0.0 0.5 1.0 1.5 2.0 2.5 -0.6 -0.4 -0.2 0.0 0.2 0.4 0.6 106 nm
M (e
mu/g)
H (Oe)
424 nm[nm] 51566:
[nm] 149.0291
'ri!
a
[nm] 200.52470 100 200 300 400
-88 883 [dOg] -83 323
Accordingly, we propose a simple model to explain how the magnetic field is induced and affects the orientation of NLC near the surface. For simplicity, a surface structure composed of the square domains with equal size and magnetization as illustrated in Fig. 7 (a) is considered. The average directions of magnetic moments for neighboring domains are opposite to each other. The characteristic of this model is that the induced z-component magnetic field Hm decays rapidly as being
away from the surface. According to the measured saturation magnetization of 212 nm thick γ-Fe2O3 film and the particle
mean size as mentioned above, the size and magnetization of each square domain are 30 nm and 0.94 emu/g, respectively, in this model. The total magnetic moment m of 1.79×10⁻¹⁹ Am2 for each domain is then calculated. Figure 7 (b) and (c)
show the 2-dimension dependent magnetic field strength Hm(x, y) at different z positions. As we know, a torque given by
Fig. 6 Surface morphology of a γ-Fe2O3 film with thickness of 169.6 nm: (a) Three-dimensional image; (b) top-view image; (c)
surface profiles for particle size analyses.
(I) (II) (III) (c) (a) (b) (I) (II) (III)
the magnetic filed on the LC molecule can be written as Γ =χa(n•H)n×H [1]. Therefore, the field-induced orientation effect on LC molecule is undistinguishable for fields in up or down direction. This is the reason why the saturation magnetization is essential. The z-dependent field strength Hm(z) at different positions in the x-y plane is plotted in Fig. 7 (d). The four x-y positions selected for simulation are marked on the contour plot by dots with the same color as that for the corresponding curves. As we can see from Fig. 7 (d), the field is high near the surface and decays rapidly with distance, especially for points near domain boundaries.
According to this model, a estimation on the PAS is determined. For simplicity, we assume the orientations of the LC directors are uniform in a considered near-surface region with depth of several nanometers. The anchoring strength is then defined as a definite integral of χaHm2(z) from z=0 to 20 nm, where the χa is given by 1.047×10⁻⁷ cgs unit for 5CB. Taking the Hm(z) at point iv into account, we have obtained a value of 2.25×10⁻¹¹ J/m2 for PAS. If the the value of magnetization 16.54 emu/g calculated from bulk value and a density of 4.86 g/cm3 [22], a result of 1.90×10⁻⁷ J/m2 is still
much smaller than the measured value, 2.0×10⁻⁴ J/m2. The significant differences are probably due to the following
reasons. Firstly, the theories of deducing the PAS from the experimental results are built without the detail descriptions of surface structures from a microscopic point of view. Secondly, the lack of the information about the properties of the amorphous film formed with the magnetic nanoparticles makes the resultant underestimated.
We have surveyed the surface of sputtered γ-Fe2O3 film with thickness of 212 nm by SPM. As shown in Fig. 8 (a), the
AFM image reveals that the synthesized γ-Fe2O3 particle size is dispersive. This may be due to the variation of intensity
of plasma giving rise to different oxidation rates of Fe [23]. However, no domain pattern is found on the MFM image, as shown in Fig. 8 (b). This is probably because the spatial resolution of the MFM can not be better than 50 nm. Besides, the simulated field strengths decay rapidly in the depth of several nanometers. Even though the resolution is high enough, it is still difficult to extract the magnetic force distribution from the signals mixed with the Van der Waals force information.
Again, it should be noticed that this simple model is for qualitative analyses only because the real surface structure is much more complicated than what we have proposed. For example, the surface bonding due to the molecular-orbital interactions between the metal atoms and cyanobenzene of 5CB should also be involved. And the magnetic properties of the dc-sputtered γ-Fe2O3 nanoparticles in this work are not well understood either. Recently, the influences of particle
size on the magnetic properties have been carried out for γ-Fe2O3 nanoparticles by several groups [24-26]. Different
magnetic properties have been observed with the same materials having similar grain sizes but produced by different methods. Therefore, more studies on the relation between the nanostructures and the revealed magnetic properties are required in the future.
4. CONCLUSION
In conclusion, we unambiguously demonstrate that ITO coated glass substrates, after bombardment using the dc diode sputter with ion energy of 1120 V and current density of 255 µA/cm2, can achieve excellent homeotropic alignment of
the NLCs. The polar anchoring strength of γ-Fe2O3 films with thickness less than 424 nm are larger than that of DMOAP
film. The comparison between the surface polar anchoring strength and magnetization of the γ-Fe2O3 films with different
thicknesses seems to indicate their interrelation from the microscopic point view. Both the measured saturation and net magnetizations decrease with increasing thickness. Additionally, we also observe the magnetization anisotropy of the sputtered γ-Fe2O3 film and it becomes larger as the film thickness decreases. The measured mean size of the particles
composed of γ-Fe2O3 material is 30±5 nm. Accordingly, we propose a simple model to explain how the magnetic field is
2.,<l.Z 4.<l.Z
a.<'zl.,<l.z
(a) Hm (G) x(m) y(m) Z = 5 nmm
z (cm) Hm (G ) i ii iii iv iv iii ii i Hm (G) Z = 20 nm x(m) y(m) (b) (c) 30 nm x y z (d)Fig. 7 A simple model describing the spatial distribution of the induced magnetic field by the γ-Fe2O3 film: (a) imaginary surface
ACKNOWLEDGEMENTS
The authors would like to thank Wen-Bin Jian, I-Jan Chen and Chao-Chen Hou for help with the SQUID and SPM measurements. This work is supported in part by MOE-ATU Program and the National Science Council of R.O.C. under Grants No. NSC 95-2221-E-009-249, and PPAEU-II.
REFERENCES
1 P. G. deGennes and J. Prost, The Physics of Liquid Crystals 2nd ed., Chap. 3, pp. 117-139, Oxford University, New York, 1993.
2 S. Kobayashi and Y. Iimura, SPIE 123 (1994) 2175.
3 P. Chaudhari, James Lacey, Shui-Chih Alan Lien and James L. Speidell, “Atomic beam alignment of liquid
crystals,” Jpn. J. Appl. Phys., 37, L55, (1998).
4 P. Chaudhari, J. Lacey, J. Doyle, E. Galligan, S. C. Alan Lien, A. Callegari, G. Hougham, N. D. Lang, P.S. Andry, R.
John, K. H. Yang, M. Lu, C. Cai, J. Speidell, S. Purushothaman, J. Ritsko, M. Samant, J. Stöhr, Y. Nakagawa, Y. Katoh, Y. Saitoh, K. Sakai, H. Satoh, S. Odahara, H. Nakano, J. Nakagaki, and Y. Shiota, “Atomic-beam alignment of inorganic materials for liquid-crystal displays,” Nature, 411, 56, (2001).
5 J. P. Doyle, P. Chaudhari, J. L. Lacey, E. A. Galligan, S. C. Lien, A. C. Callegari, N. D. Lang, M. Lu, Y. Nakagawa,
H. Nakano, N. Okazaki, S. Odahara, Y. Katoh, Y. Saitoh, K. Sakai, H. Satoh, and Y. Shiota, “Ion beam alignment for liquid crystal display fabrication,” Nuclear Instruments and Methods in Physics Research B, 206, 467, (2003).
6 J. Stöhr, M. G. Samant, J. Lüning, A. C. Callegari, P. Chaudhari, J. P. Doyle, J. A. Lacey, S. A. Lien, S.
Purushothaman, and J. L. Speidell, “Liquid crystal alignment on carbonaceous surfaces with orientational order,” Science, 292, 2299, (2001).
7 J. Y. Hwang, Y. M. Jo, D. S. Seo, S. J. Rho, D. K. Lee, and H. K. Baik, “Liquid crystal alignment capabilities on a
new diamond-like carbon thin film layer,” Jpn. J. Appl. Phys., 41, L654, (2002).
8 S. H. Lee, K. H. Park, J. S. Gwag, T. H. Yoon, and J. C. Kim, “A multimode-type transflective liquid crystal
display using the hybrid-aligned nematic and parallel-rubbed vertically aligned modes,” Jpn. J. Appl. Phys., 42, 5127, (2003).
9 C. J. Park, J. Y. Hwang, H. K. Kang, D. S. Seo, H. J. Ahn, J. B. Kim, K. C. Kim, and H. K. Baik, “Liquid crystal
Fig. 8 Surveyed images for γ-Fe2O3 film with 212 nm thick by (a) AFM and (b) MFM.
(a) (b)
alignment effects and electro optical performances of twisted nematic-liquid crystal display using ion-beam alignment method on nitrogen-doped diamond like carbon thin film layer,” Jpn. J. Appl. Phys., 44 (3), 1352, (2005).
10 J. S. Gwag, K. H. Park, J. L. Lee, J. C. Kim, and T. H. Yoon, “Two-domain hybrid aligned nematic cell fabricated
by ion beam treatment of vertical alignment layer,” Jpn. J. Appl. Phys., 44 (4A), 1875, (2005).
11 H. J. Ahn, S. J. Rho, K. C. Kim, J. B. Kim, B. H. Hwang, C. J. Park, and H. K. Baik, “Ion-beam induced liquid
crystal alignment on diamond-like carbon and fluorinated diamond-like carbon thin films,” Jpn. J. Appl. Phys., 44
(6A), 4092, (2005).
12 H. Y. Wu, T. T. Tang, C. C. Wang, R. P. Pan, S. J. Chang, and J. C. Hwang, “Controllable alignment modes of
nematic liquid crystals on argon ion beam bombarded polyimide films,” Mol. Cryst. Liq. Cryst., 475, 45, (2007).
13 H. Y. Wu and R. P. Pan, “Liquid crystal surface alignments by using ion beam sputtered magnetic thin films,” Appl.
Phys. Lett., 91 (7), 074102, (2007).
14 K. H. Yang and Charles Rosenblatt, “Determination of the anisotropic potential at the nematic liquid
crystal-to-wall interface,” Appl. Phys. Lett., 43 (1), 62, (1983).
15 X. Nie, Y. H. Lin, Thomas X. Wu, H. Wang, Z. Ge, and S. T. Wu, “Polar anchoring energy measurement of
vertically aligned liquid-crystal cells,” J. Appl. Phys., 98 (1), 013516, (2005).
16 T. J. Scheffer and J. Nehring, “Accurate determination of liquid-crystal tilt bias angles,” J. Appl. Phys., 48 (5),
1783, (1977).
17 C. R. Brundle, T. J. Chuang, and K. Wandelt, “Core and valence level photoemission studies of iron oxide surfaces
and the oxidation of iron,” Surf. Sci., 68, 459, (1977).
18 Y. Gao and S. A. Chambers, “Heteroepitaxial growth of α-Fe
2O3, γ-Fe2O3 and Fe3O4 thin films by
oxygen-plasma-assisted molecular beam epitaxy,” J. Cryst. Growth, 174, 446, (1997).
19 R. P. Gupta and S. K. Sen, “Calculation of multiplet structure of core p-vacancy levels,” Phys. Rev. B, 10 (1), 71,
(1974).
20 A. P. Grosvenor, B. A. Kobe, M. C. Biesinger, and N. S. Mclntyre, “Investigation of multiplet splitting of Fe 2p
XPS spectra and bonding in iron compounds,” Surf. Interface Anal., 36 (12), 1564, (2004).
21 L. Yin, I. Adler, T. Tsang, L. J. Matienzo, and S. O. Grim, “Paramagnetism and shake-up satellites in X-ray
photoelectron spectra,” Chem. Phys. Lett., 24 (1), 81, (1974).
22 P. P. Vaishnava, U. Senaratne, E. C. Buc, R. Naik, V. M. Naik, G. M. Tsoi, and L. E. Wenger, “Magnetic properties
of_γ-Fe2O3 nanoparticles incorporated in a polystyrene resin matrix,” Phys. Rev. B, 76 (2), 024413, (2007).
23 I. Banerjee, Y. B. Khollam, C. Balasubramanian, R. Pasricha, P. P. Bakare, K. R. Patil, A. K. Das, and S. V.
Bhoraskar, “Preparation of γ-Fe2O3 nanoparticles using DC thermal arc-plasma route, their characterization and
magnetic properties,” Scripta Materialia, 54, 1235, (2006).
24 K. Simeonidis, S. Mourdikoudis, M. Moulla, I. Tsiaoussis, C. Martinez-Boubeta, M. Angelakeris, C.
Dendrinou-Samara, and O. Kalogirou, “Controlled synthesis and phase characterization of Fe-based nanoparticles obtained by thermal decomposition,” J. Magn. Magn. Mater., 316, e1, (2007).
25 H. Zhu, D. Yang, L. Zhu, H. Yang, D. Jin, and K. Yao, “A facile two-step hydrothermal route for the synthesis of
γ-Fe2O3 nanocrystals and their magnetic properties,” J. Mater. Sci., 42, 9205, (2007).
26 A. Millan, A. Urtizberea, N. J. O. Silva, F. Palacio, V. S. Amaral, E. Snoeck, and V. Serin, “Surface effects in