Oceanic Linguistics, Volume 44, no. 2 (December 2005) © by University of Hawai‘i Press. All rights reserved.
Saisiyat as a Pitch Accent Language:
Evidence from Acoustic Study of Words
Wen-yu Chiang and Fang-mei Chiang
graduate institute of linguistics, national taiwan university
This paper investigates the acoustic realization of lexical-level accent in Saisiyat, an endangered aboriginal language of Taiwan. Accent in Saisiyat usually falls on the ultimate syllable of content words. This phenomenon has been described in previous studies as either “stress” or “accent.” Our mea-surements and analysis of various prosodic parameters of syllable rhyme (F0 height at onset, offset, peak, and valley, as well as pitch range, duration, slope, peak alignment, and intensity peak) suggest that accent in Saisiyat should be classi²ed as pitch accent, because lexical accent is realized by means of speci²c F0 patterns, rather than duration and intensity. Thus, among three typological categories that have been proposed for languages (lexical tone, lexical stress, and lexical pitch accent), we propose that Saisiyat belongs to the category that has lexical pitch accent.
1. INTRODUCTION.1 This paper investigates the acoustic realization of lexical-level accent in Saisiyat, an endangered aboriginal language of Taiwan. Based on the results of this study, we propose that Saisiyat should be classi²ed as a pitch accent lan-guage. Accent in Saisiyat content words is ²xed on the ²nal syllable, a property that it shares with certain other Taiwanese Austronesian languages. Yeh (2000) formulates the Saisiyat stress rule as follows:2
V ! V [+stress] / _(C)#
This rule, however, does not apply to function words or place names.3
1. An earlier version of this paper was presented at First Workshop on Discourse and Cognition, National Taiwan University, May 29, 2004. This study was sponsored by National Science Council grant num-ber NSC92-2411-H-002-079 in Taiwan. We would like to thank the two informants, Paway a tahis and Oebay a oemaw, who enthusiastically provided native speaker judgments and other relevant informa-tion, and the other two research assistants in the NSC Saisiyat Intonation Project, I Chang-Liao and Hung-chun Tung, for their helpful comments and discussion. Special thanks go to Tanya Visceglia and two anonymous reviewers for their insightful comments. Any remaining errors are our own. 2. Previous studies of Taiwanese Austronesian languages have usually referred to acoustically
prominent syllables as “stressed” (e.g., Yeh 2000). The distinction between “stress” and “accent” will be clari²ed in the following sections.
3. We observed that the prosody of function words in Saisiyat was much less regular than that of content words. Many function words are either monosyllabic or disyllabic and bear neither stress nor accent, unless they are emphasized for pragmatic reasons. As for place names, too few tokens occurred in our data to discern any patterns.
Zorc (1993) proposes a classi²cation system for Austronesian languages based on their criteria for accent assignment.4 According to this system, accent may be assigned on the basis of: (a) phonemic length and shortness; (b) phonemic accent (quantity or stress) as secondarily introduced, generally due to consonant loss, analogical leveling, or bor-rowing; (c) length contrasts in the ultima, resulting from compensation for the loss of a consonant; (d) phonemic length, as the result of coalescence (or crasis) of vowels, which does not correspond with stress (pitch accent); (e) phonemic length or shortness, retained sporadically as remnants of a preexisting system; (f) consonant length following a short vowel; (g) oxytone, with accent (with or without secondary vowel lengthening) falling regularly on the ultima; (h) paroxytone, with accent falling regularly on the penult; (i) proparoxytone, with accent falling regularly on a prepenultimate syllable; (j) PAn *e in³uences accent in a different way from the other vowels; (k) accent is used in³ection-ally, that is morphemic accent. Zorc categorized Tungho-Saisiyat5 as belonging to cate-gory (d) and Saisiyat to catecate-gory (g). This categorization of Saisiyat accent is congruent with previous observations that accent falls regularly on the ultimate syllable, and that vowel length does not affect pitch accent assignment.6
No previous phonological description of accent/stress in Saisiyat has measured the acoustic properties of prominent syllables. The present study aims to provide a detailed acoustic analysis of Saisiyat accent by measuring the following parameters of syllable rhyme: F0 height at onset, offset, peak, and valley, as well as pitch range, duration, slope, peak alignment, and intensity peak. Analyzing these parameters will allow us to distin-guish accented from unaccented syllables, as well as among the accents realized on dif-ferent syllabic structures. The results of this study provide support for the classi²cation of Saisiyat as a pitch accent language, because lexical accents are made prominent by means of speci²c F0 patterns rather than by means of duration and intensity.
The remainder of this paper is organized as follows: section 2 reviews de²nitions of pitch accent, describes the acoustic parameters to be investigated, and reviews the literature on the in³uence of accent and coda types on the realization of prominent syllables. Section 3 describes the methodology used in this study, and section 4 reviews its results. Section 5 discusses the acoustic realization of Saisiyat pitch accents, and the ways in which the cur-rent data provide support for classi²cation of Saisiyat as a pitch accent language.
4. For a comprehensive list of the languages included in each category, see Zorc (1993). 5. Saisiyat is divided into northern and southern dialects. Northern Saisiyat, generally called the
Taai dialect, is spoken in Hsinchu County. Southern Saisiyat, generally spoken in Miaoli County, is called the Tungho dialect (Yeh 2000).
6. Wolff (1993) concluded that stress in Proto-Austronesian falls on the penult of the root if it is long (or accented) and on the ²nal syllable of the root if the penult is short (or unaccented). In other words, there are two kinds of roots: those with a stressed penult and those with a stressed ²nal syllable. If there is suf²xation, the accent remains on the penult of the suf²xed form if the penult of the root is accented, and on the ²nal syllable of the suf²xed form if the ²nal syllable of the root is accented. Wolff’s conclusions were based on detailed work with Philippine and For-mosan Austronesian languages. He concluded that (1) stress patterns tend to remain unchanged in nouns and unaf²xed forms that are not stative adjectives, and (2), while the stress patterns of actor focus verbs tend to re³ect the underlying stress pattern of their verbal roots in Philippine aboriginal languages, no such tendency was found in the Austronesian languages of Taiwan.
406 oceanic linguistics, vol. 44, no. 2
2. DEFINITIONS OF THE PARAMETERS UNDER INVESTIGATION, ACCENT TYPES AND CODA TYPES
2.1 DEFINITIONS OF PITCH ACCENT. The term “pitch accent” was ²rst proposed by Bolinger (1958), who de²ned it as an actual prominence in an utterance and a major cue to the perception of stress. His de²nition seemed to be based on Indo-Euro-pean language data in the sense that it links “pitch accent” to stress. Beckman (1986) argued that melodic accent (pitch accent) and dynamic accent (stress accent) are actually two distinct accent types. According to her classi²cation system, in pitch accent lan-guages such as Japanese, pitch change is the only acoustic cue to accent. In stress accent languages such as English, however, stressed syllables are differentiated using not only pitch height, but also duration, intensity, and vowel quality.7 Fox (2000) de²ned “accent” as a phonological unit that is manifested using stress features in stress-accent languages and nonstress features in pitch accent languages. The former is dynamic and is realized as a composite of pitch, duration, and intensity. The latter is melodic and is realized by means of pitch features only. Cruttenden (1997) views pitch accent as being equivalent to “accent,” which he de²nes as prominence that is created by use of pitch. Pitch accent lan-guages such as Japanese and Swedish license no more than one accent per word; these accents are realized using only pitch, and their properties are not affected by intonation.
Remijsen (2003) divides lexical-level prosodic properties into three types: lexical tones, lexical stress, and lexical pitch accent. The function of lexical tone is to distinguish words from one another, and it does so by means of differences in fundamental fre-quency (F0) pattern. Lexical pitch accent and lexical stress are both categorized as variet-ies of lexical accent. They differ in the sense that lexical pitch accent consists of a single, speci²c F0 pattern, whereas lexical stress is realized using F0, duration, and intensity. 2.2 DEFINITIONS OF PARAMETERS. The parameters to be measured are:
F0 height (Hz): at onset, offset, peak, and valley Pitch range (Hz): F0peak – F0valley
Duration (ms): toffset – tonset
F0 slope: (F0peak – F0valley)/(tpeak – tvalley)
F0 peak alignment (%): (tpeak - tonset)/( toffset – tonset) * 100 Intensity peak (dB)
F0 height will be measured at four locations in the rhyme of each syllable: onset, offset, peak, and valley. Pitch range will be measured as the difference in F0 values between the peak and valley (F0peak – F0valley). Duration will be measured as the time difference between the rhyme onset and offset points (toffset – tonset). F0 slope will be measured as the rate of movement from the F0 peak to the valley, which is calculated as F0 peak-valley difference divided by duration. If an F0 slope value is positive, the pitch contour can be described as rising; if that value is negative, the pitch contour is falling. F0 peak alignment will be measured as the temporal position in which the pitch peak is located within a syl-lable rhyme. This will be calculated using the formula, (tpeak – tonset) / (toffset– tonset) * 100,
7. Similar claims were also proposed by some recent studies (e.g., Campbell 1993), which pro-vided evidence that duration or intensity may serve as a reliable indicator of stress even in the absence of pitch features.
which divides syllable duration by the duration from onset to peak. Finally, intensity peak will be measured as the highest dB value within a rhyme.
2.3 ACCENT TYPES. Previous research on the acoustic properties of accent has generally concluded that F0 is the most salient, and often the only cue in the realization of accent (Muyskens 1931, Parmenter and Blanc 1933, Beckman 1986). Some studies have claimed that duration is another important parameter in determining pitch accent location (Schramm 1937 and Jassem 1959). Intensity is generally considered to be the least important cue (Fry 1958 and Bolinger 1958).8
Research on the acoustic realization of accent has often investigated F0 alignment. Bruce (1977) found that the temporal anchoring of pitch movements to the segmental string could distinguish accented from unaccented syllables in Swedish. The two accent types in Swedish, Accent 1 (acute) and Accent 2 (grave) are distinguished by F0 peak alignment. In citation form, Accent 1 has a single peak, while Accent 2 has two. Bruce, however, claimed that the distinction between these two accents actually lies in their alignment of pitch peak with respect to the stressed vowel. The pitch peak in Accent 1 precedes the onset of the stressed vowel; if there is no unstressed syllable preceding the stressed vowel, an Accent 1 peak will not be realized in the F0 contour. The sharply fall-ing contour of an Accent 2 peak, in contrast, coincides with the stressed vowel; thus, they always surface in the F0 contour. F0 valley alignment has also been investigated. Prieto, van Santen, and Hirschberg (1995) found that in Mexican Spanish, F0 valley is very sistently aligned in a position occurring before the onset of accented syllables. Their con-clusion was similar to Bruce (1977), namely that: “reaching a certain pitch level at a particular point in time is the important thing, not the movement (rise or fall) itself” (Bruce 1977:132). The phenomenon of F0 peak delay— the postponement in various prosodic conditions of an F0 peak from an accented syllable into the unaccented syllable directly following it—has also been observed (Silverman and Pierrehumbert 1990). 2.4 CODA TYPES. The F0 realization of tone, accent, or intonation is intrinsically in³uenced by segmental content. Prevocalic consonants create the most substantial F0 per-turbation in the nuclear vowel. For example, if a prevocalic consonant is voiced, F0 of the fol-lowing vowel will be lowered; if it is voiceless, F0 of the folfol-lowing vowel will be raised. This kind of consonantal in³uence on pitch has been widely attested in Southeast Asian tone lan-guages, including Austronesian languages (Blood 1964, cited in Haudricourt 1972). The voicing of postvocalic consonants has the same effect on nuclear vowels, but on a smaller scale (Mohr 1968). However, the postvocalic laryngeals ¿ and h have been claimed to bring about the opposite effects. The glottal stop ¿ tends to contribute to F0 rise in preceding vowels (e.g., Haudricourt 1954), while the glottal fricative h tends to contribute to an F0 fall (e.g., Matisoff 1973). With the exception of those two consonants, postvocalic nonglottal conso-nants and intrinsic vowel height have rarely been claimed to in³uence realization of F0 in ris-ing and fallris-ing tones (Hombert 1978; Hombert, Ohala, and Ewan 1979, cited in Fox 2000). Subsequently, House (1989) found that voiced rhymes either following voiceless consonants or containing intrinsically short vowels may undergo steeper, more compressed pitch move-ments than long vowels followed by sonorant consonants, especially nasals.
8. Many scholars claim that duration is more important in marking prominence than intensity, while others claim that intensity is more salient than duration (Liberman 1960, van der Mark 2002).
408 oceanic linguistics, vol. 44, no. 2
3. METHOD
3.1 PARTICIPANTS. Two male native speakers of approximately sixty years of age participated in this experiment. One was a speaker of the southern Saisiyat (later referred to as Speaker 1) and the other was a speaker of northern Saisiyat (later referred to as Speaker 2).9 Both are well educated and have spoken Saisiyat for decades. They also use Mandarin on a daily basis to communicate with Mandarin-speaking people. 3.2 EXPERIMENTAL MATERIALS
3.2.1 The Saisiyat phonemic inventory and lexicon. We preface this section with a brief introduction of the phonology and word-level prosody of Saisiyat. Phono-logically speaking, Saisiyat10 has a phonemic inventory of six vowels (i, oe, ae, o, a, and schwa) and seventeen consonants (p, b, t, k, ’, m, n, ng, s, z, S, h, l, L, r, w, j).11 Word-level prosody in Saisiyat is the combined product of its syllabic structure and accent assignment. Its most frequently occurring syllable structures are CV and CVC.
As for the distribution of mono- and polysyllabic words in Saisiyat, our investigation found 2-syllable words to be predominant, comprising 45.42 percent of the lexicon. 3-syllable words comprise 28.32 percent, and 4-3-syllable words comprise 16.24 percent. These three types account for 90 percent of the lexical items in Saisiyat.12 As for syllable coda consonants, ²nal accented syllables tend to include a coda consonant more often than unaccented syllables do. Our survey of the Saisiyat lexicon found that about 85.3 percent of accented syllables end with coda consonants, compared with the 21.8 percent that occur in unaccented syllables.
3.2.2 Materials. Experimental materials for this study consisted of a wordlist that was controlled for two variables: number of syllables per lexical item (2, 3, 4, and 5 syllables) and coda type (no coda, nasal coda, and stop coda). To control for possible effects of adja-cent syllable type, the syllable preceding each acadja-cented syllable was a CV syllable, while the target accented syllable was either CV or CVC. /a/ or /i/ was chosen as the vowel for the accented syllables, because these two vowels occur most frequently in Saisiyat, and they allow for relatively stable and consistent pitch and formant value extraction. We also chose /a/ or /i / to be the vowel in unaccented syllables as much as possible.
9. Because Saisiyat is an endangered language, informants who are both pro²cient enough to par-ticipate in the experiment and ³uent enough in Mandarin Chinese to comprehend the instruc-tions are dif²cult to ²nd. Speaker 1 is Paway a tahis and Speaker 2 is Oebay a oemaw. The ordering of these two speakers is based on the time sequence in which we recorded our data. 10. Saisiyat is morphologically similar to other Austronesian languages of Taiwan in that it uses a
wide inventory of af²xes to mark focus, as well a wide variety of case markers to specify semantic roles. However, it differs from other Formosan languages in that it has an SVO word order, whereas most others exhibit a VOS word order.
11. For orthographic convenience, IPA transcription of the mid rounded front vowel and the low front vowel in Saisiyat have been written as oe and ae; the voiced bilabial fricative has been writ-ten as b and the velar nasal as ng. In addition, S represents a voiceless alveopalatal fricative and ’ represents the glottal stop. Note that the lateral ³ap L was reported to be extinct in some dialects, retained by only a few speakers (Yeh 2000). For this reason, L is not included in this study. 12. The survey was based on the 579 Saisiyat words appearing in Yeh (2000) and calculated by Lin
Zhe-min, a linguistics graduate student at National Taiwan University. The remaining 10 percent of lexical items in this survey included 1-syllable (3.45%), 5-syllable (5.36%), 6-syllable (1.04%), and 7-syllable (0.17%).
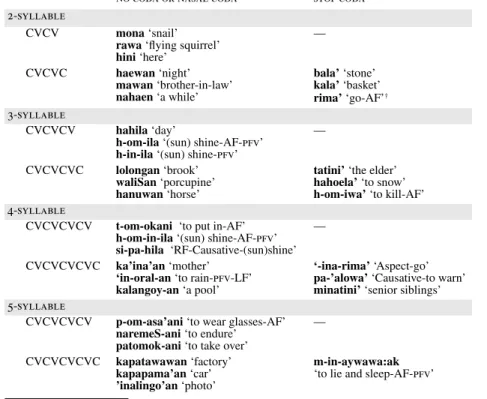
Coda types included: no coda, the nasal /n/, and a glottal stop /’/. The latter two were chosen to represent sonorants and obstruents, respectively. Sonorants were cho-sen as preferred onset consonants for two reasons: pitch can be more easily extracted from sonorant segments, and sonorants tend not to cause as much pitch perturbation of the nuclear vowel as obstruents do. The wordlist is shown in table 1.
The total number of experimental items should have been thirty-six (4 syllable types × 3 coda types × 3 items). However, no 5-syllable words containing a glottal stop coda could be found, so the only item in that condition is the word m-in-aywawa:ak, which has a /k/ coda. We are not entirely certain of whether the absence of 5-syllable stop-coda items is the result of a gap in the lexicon or our own failure to locate such items. Consequently, there are thirty-four, rather than thirty-six items in the wordlist. 3.3 RECORDING. Recording was conducted in the phonetics laboratory of National Taiwan University Linguistics Institute, using the Kay Elemetrics Computer-ized Speech Lab (CSL) 4400 at a 22050-Hz sampling rate. The items in the wordlist were randomized, and the speakers were directed to read each word ²ve times at a nat-ural speed with about 0.5-second intervals between repetitions. Each recording session lasted about one hour. All recordings were made using a condenser microphone posi-tioned approximately 10 cm away from the speaker’s mouth.
TABLE 1. WORDLIST OF 34 LEXICAL ITEMS
no coda or nasal coda stop coda
2-syllable
CVCV mona ‘snail’ rawa ‘³ying squirrel’ hini ‘here’
—
CVCVC haewan ‘night’
mawan ‘brother-in-law’ nahaen ‘a while’
bala’ ‘stone’ kala’ ‘basket’ rima’ ‘go-AF’†
† AF, RF, and LF represent agent-focus, referential-focus, and locative-focus, respectively. pfv is the abbreviation for perfective.
3-syllable
CVCVCV hahila ‘day’
h-om-ila ‘(sun) shine-AF-pfv’ h-in-ila ‘(sun) shine-pfv’
—
CVCVCVC lolongan ‘brook’
waliSan ‘porcupine’ hanuwan ‘horse’
tatini’ ‘the elder’ hahoela’ ‘to snow’ h-om-iwa’ ‘to kill-AF’
4-syllable
CVCVCVCV t-om-okani ‘to put in-AF’
h-om-in-ila ‘(sun) shine-AF-pfv’ si-pa-hila ‘RF-Causative-(sun)shine’
—
CVCVCVCVC ka’ina’an ‘mother’
‘in-oral-an ‘to rain-pfv-LF’ kalangoy-an ‘a pool’
‘-ina-rima’ ‘Aspect-go’ pa-’alowa’ ‘Causative-to warn’ minatini’ ‘senior siblings’
5-syllable
CVCVCVCV p-om-asa’ani ‘to wear glasses-AF’
naremeS-ani ‘to endure’ patomok-ani ‘to take over’
—
CVCVCVCVC kapatawawan ‘factory’
kapapama’an ‘car’ ’inalingo’an ‘photo’
m-in-aywawa:ak
410 oceanic linguistics, vol. 44, no. 2
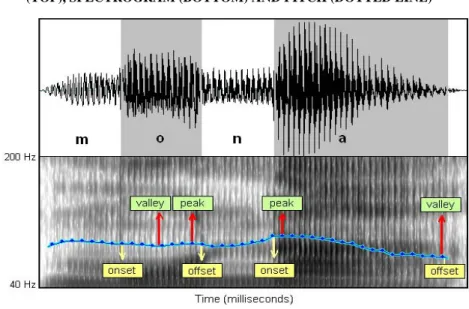
3.4 MEASUREMENT. The data were analyzed using the software Praat and digi-tized at a 22050-Hz sampling rate. Onset consonants were excluded from measurement to minimize the effects of microprosodic variation. Coda consonants, in contrast, were included in the measurement of accented syllables, because pitch differences caused by coda type were operationalized in this experiment. Each syllable was measured with respect to the parameters mentioned in section 2: F0 height, pitch range, slope, and peak alignment, plus duration and intensity peak. Figure 1 provides an example of the estima-tion process. The onsets m and n were excluded and the rhymes o and a were preserved using visual examination of the waveform and formant history.13 Four points were identi²ed within each rhyme: onset, offset, peak, and valley, as indicated in ²gure 1 by arrows. F0 (in Hz) and time (in ms) values were determined for these four points, as well as the value of the intensity peak (in dB) within the rhyme. Often, two points occurred very close to one another in time. For example, offset and valley occurred almost simulta-neously in the accented syllable -na, as shown in ²gure 1.
4. RESULTS. For each of the above-mentioned parameters, preaccented syllables (abbreviated as pre-Acc) were compared with accented (abbreviated as Acc) syllables across 2-, 3-, 4-, and 5-syllable word conditions, and accented syllables were compared across three different coda types: open, nasal, and stop. A data overview will be given in 4.1, followed by a detailed discussion of each separate parameter.
13. The formant history and intensity curve are not shown in ²gure 1 for a clearer picture of pitch realization (the dotted line).
FIGURE 1. THE ITEM mona ‘SNAIL’ REPRESENTED AS A WAVEFORM
(TOP), SPECTROGRAM (BOTTOM) AND PITCH (DOTTED LINE)†
4.1 OVERALL F0 CONTOUR
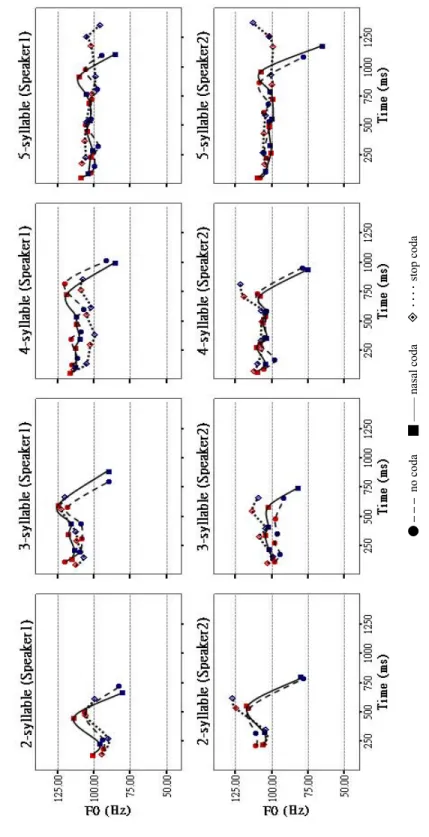
4.1.1 Accented vs. preaccented syllables. Figure 2 illustrates the overall pitch contour produced in each of the three coda-type conditions by the two speakers. The three curves in each plot represent no-coda, nasal-coda, and stop-coda condi-tions, respectively. It can be seen in ²gure 2 that a falling contour is the prevalent pattern for accented syllables. However, three exceptions were observed in the productions of Speaker 2. For stop-coda items occurring in the two-syllable, four-syllable, and ²ve-syllable conditions, Speaker 2 produced accents with a rising pitch contour. Preaccented syllables, in contrast, exhibit no clear patterns in pitch movement direction.
Table 2a provides mean F0 values for the four pitch measurement points (onset, offset, peak, and valley) for each condition.14 Table 2a illustrates two ²ndings: ²rst, onset and offset F0 values are similar to peak and valley values, respectively (with the exception of pre-Acc2 and pre-Acc4 in the 5-syllable condition). Thus, pitch contour is gradually falling throughout the rhyme in both accented and unaccented syllables. Second, the highest F0 peak and the lowest valley always occur within the accented syllable of a word.
Table 2b shows anova results comparing four pitch values in both preaccented and accented syllables for 2–5 syllable items. In each condition, F0 is the depen-dent variable, and the four measurement points (onset, offset, peak, and valley) are the independent variables. Signi²cance here and in all subsequent tests was selected to be .01.
Tables 2a and 2b demonstrate that for preaccented syllables, F0 values of the four points (onset, offset, peak, and valley) were generally not signi²cantly different. Pre-Acc1 of 4-syllable words was the sole exception (F(3,64)=4.881, p < .01). As for accented syllables, a Bonferroni post hoc test showed that F0 values were signi²cantly higher at the onset and peak points than at the offset or valley points regardless of syl-labicity. The results con²rm ²gure 2’s observation that most pitch contours in accented syllables exhibit falling contours.
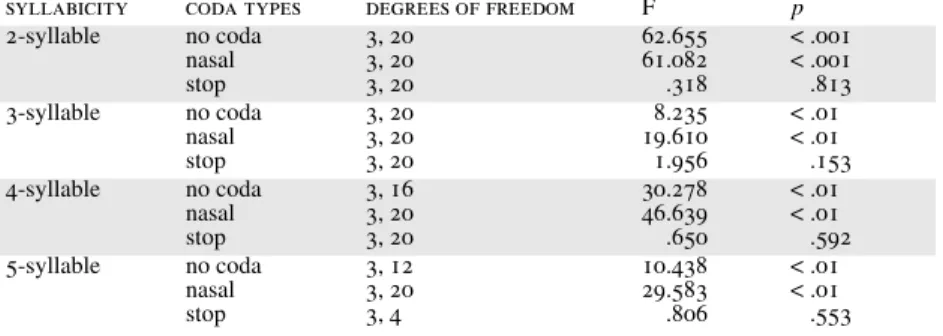
4.1.2 Accented syllables in different coda types. Figure 2 and table 2a dem-onstrate that the highest F0 peaks and the lowest valleys were usually realized within accented syllables. However, the lowest F0 valley seldom occurred within accented syllables with a stop coda. Table 2c shows anova results of the four measurement points within accented syllables compared across coda type. As in table 2b, the dependent variable is F0 value and the independent variables are the four measure-ment points. Table 2c shows that accented syllables with no coda or a nasal coda had signi²cantly higher F0 values at the onset or peak points than at the offset or valley points (determined by a Bonferroni post hoc test). F0 values in accented syllables with a stop coda, in contrast, were not signi²cantly different among the four points (onset, offset, peak, and valley).
FIGUR E 2. AN O V ER VIEW OF THE PI TCH COU T OURS OF SPEAK E R 1 AN D S P EAK E R 2 ● – – – no cod a ■ –– –– na sa l co da ! ‥‥ s top cod a † No te th at th e curv es i n e ac h plo t repre sent in ter pol ate d, ra the r th an ac tua l pit ch co nto urs. Th e ²gur es
were plotted using an S
P
SS sc
atte
r
TABLE 2A. MEAN F0 VALUES AND STANDARD DEVIATIONS OF FOUR MEASURED POINTS IN PREACCENTED AND ACCENTED SYLLABLES
IN VARIOUS SYLLABICITY CONDITIONS syllabicity accent † F0: Mean (SD)
onset offset peak valley
2-syllable pre-Acc1 101.73 (7.82) 99.92 (8.50) 102.96 (7.55) 98.23 (7.89) Acc 113.83 (8.21) 91.16 (18.45) 115.03 (10.14) 90.06 (17.59) 3-syllable pre-Acc1 107.71 (9.48) 103.92 (7.62) 108.60 (9.19) 102.95 (7.82) pre-Acc 2 107.91 (6.79) 106.49 (7.66) 108.84 (7.11) 105.41 (6.91) Acc 113.05 (10.57) 97.02 (15.63) 114.23 (10.52) 93.14 (13.39) 4-syllable pre-Acc 1 112.32 (5.72) 107.16 (5.94) 112.39 (5.69) 106.77 (5.91) pre-Acc 2 109.34 (6.54) 105.42 (6.27) 109.96 (5.87) 104.64 (6.20) pre-Acc 3 107.64 (6.28) 105.89 (6.34) 107.89 (6.34) 104.96 (5.71) Acc 114.23 (6.55) 94.06 (17.32) 115.59 (6.97) 92.50 (15.95) 5-syllable pre-Acc 1 106.76 (6.54) 103.14 (6.63) 107.06 (6.50) 102.71 (7.07) pre-Acc 2 101.78 (3.51) 101.00 (3.73) 102.49 (3.50) 99.55 (3.00) pre-Acc 3 102.98 (4.61) 101.10 (4.22) 103.47 (4.32) 100.70 (4.30) pre-Acc 4 101.49 (3.92) 101.52 (4.97) 103.25 (4.09) 99.53 (4.25) Acc 106.94 (3.70) 85.00 (15.00) 107.95 (3.54) 83.51 (13.16)
† Acc = accented syllable, pre-Acc1 = the ²rst unaccented syllable, pre-Acc2 = the second unaccented syllable, etc.
TABLE 2B. ANOVA: COMPARISON OF F0 OF FOUR MEASURED POINTS IN VARIOUS SYLLABICITY AND ACCENT-TYPE CONDITIONS
syllabicity accent degrees of freedom F p
2-syllable pre-Acc1 Acc 3, 683, 68 16.6411.225 < .01.307 3-syllable pre-Acc1 pre-Acc2 Acc 3, 68 3, 68 3, 68 1.896 .817 13.101 .139 .489 < .01 4-syllable pre-Acc1 pre-Acc2 pre-Acc3 Acc 3, 64 3, 64 3, 64 3, 64 4.881 3.201 .935 16.492 < .01 .029 .429 < .01 5-syllable pre-Acc1 pre-Acc2 pre-Acc3 pre-Acc4 Acc 3, 44 3, 44 3, 44 3, 44 3, 44 1.430 1.609 1.177 1.479 20.338 .247 .201 .329 .233 < .01 TABLE 2C. ANOVA: COMPARISON OF F0 OF FOUR MEASURED POINTS
OF ACCENTED SYLLABLES IN VARIOUS SYLLABICITY AND CODA-TYPE CONDITIONS
syllabicity coda types degrees of freedom F p
2-syllable no coda nasal stop 3, 20 3, 20 3, 20 62.655 61.082 .318 < .001 < .001 .813 3-syllable no coda nasal stop 3, 20 3, 20 3, 20 8.235 19.610 1.956 < .01 < .01 .153 4-syllable no coda nasal stop 3, 16 3, 20 3, 20 30.278 46.639 .650 < .01 < .01 .592 5-syllable no coda nasal stop 3, 12 3, 20 3, 4 10.438 29.583 .806 < .01 < .01 .553
414 oceanic linguistics, vol. 44, no. 2
4.2 PITCH RANGE
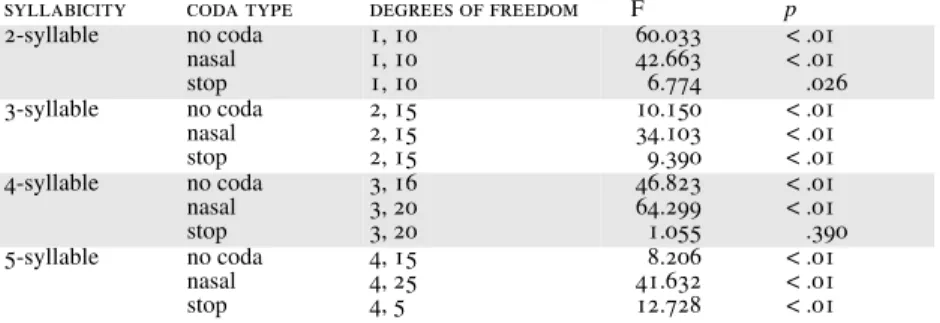
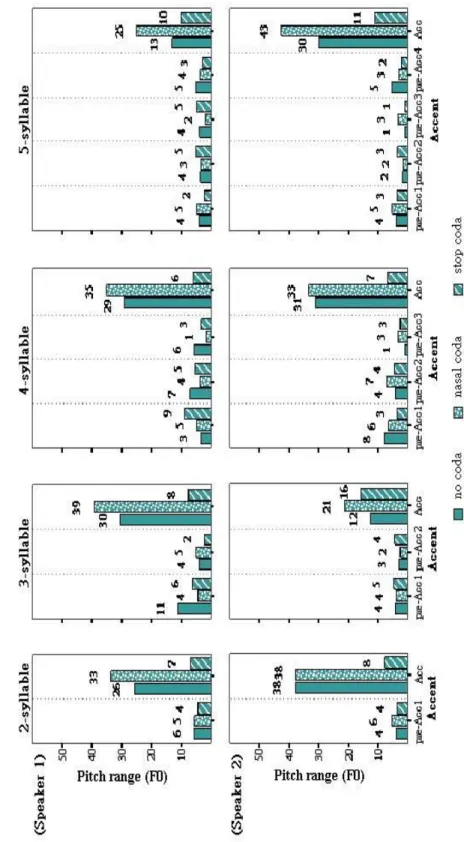
4.2.1 Comparison of accented and preaccented syllables. Figure 3 displays pitch range (in Hz) for each speaker across syllabicity and coda type. It shows that most accented syllables exhibit larger pitch ranges than preaccented syllables, with the exception of Speaker 1’s 4-syllable words in the stop-coda condition. Generally, pitch ranges are more compressed in stop-coda accented syllables (6 to 16 Hz) than they are in nasal-coda (21 to 43 Hz) or no-coda (12 to 38 Hz) accented syllables.
In table 3a, pitch range values were compared between accented and preaccented rhymes. Pitch range (in Hz) is the dependent variable, and Accent (Acc vs. pre-Acc) is the independent variable. According to the anova results in table 3a, pitch range val-ues were signi²cantly different between accented and preaccented syllables except in the stop-coda 2-syllable and 4-syllable conditions. A Bonferroni post hoc test showed that pitch range in accented syllables was wider than in preaccented syllables, and that pitch range differences contributed signi²cantly to the overall difference between accented and preaccented syllables.
4.2.2 Accented syllables across coda types. Table 3b compares pitch range within the accented syllables across different coda types. Pitch range is demonstrated to be the largest in the nasal-coda condition and the smallest in the stop-coda condition. In addition, pitch range decreased as the number of syllables increased (from 31.86 Hz to 17.35 Hz) for words in the no-coda condition. However, pitch range in words with a nasal or a stop coda did not exhibit as much within-group variation as those in the no-coda condition did.
TABLE 3A. ANOVA: COMPARISON OF PITCH RANGES BETWEEN PREACCENTED AND ACCENTED SYLLABLES IN VARIOUS
SYLLABICITY AND CODA-TYPE CONDITIONS
syllabicity coda type degrees of freedom F p
2-syllable no coda nasal stop 1, 10 1, 10 1, 10 60.033 42.663 6.774 < .01 < .01 .026 3-syllable no coda nasal stop 2, 15 2, 15 2, 15 10.150 34.103 9.390 < .01 < .01 < .01 4-syllable no coda nasal stop 3, 16 3, 20 3, 20 46.823 64.299 1.055 < .01 < .01 .390 5-syllable no coda nasal stop 4, 15 4, 25 4, 5 8.206 41.632 12.728 < .01 < .01 < .01 TABLE 3B. MEANS AND STANDARD DEVIATIONS OF PITCH RANGES
OF ACCENTED SYLLABLES IN VARIOUS SYLLABICITY AND CODA-TYPE CONDITIONS
syllabicity pitch range (in hz.) by coda types
no coda nasal stop
2-syllable 31.86 (8.18) 35.62 (11.14) 7.42 (3.03)
3-syllable 21.40 (11.75) 30.31 (10.40) 11.54 (5.36)
4-syllable 29.88 (4.62 34.21 (7.10) 6.34 (2.58)
FIGU R E 3. PITCH R ANGES F O R SPEAK E RS 1 AND IN V ARIOUS SYLLABIC ITY A ND CODA-TYPE CONDITI
FIGUR E 4. DURATI O NS OF PR EA CCENTED A ND AC CENTED S Y LLABLES DISPLAY E D BY SPEAKER S , SYLLABIC ITY , AND C O DA TYPE CONDITIONS
4.3 DURATION
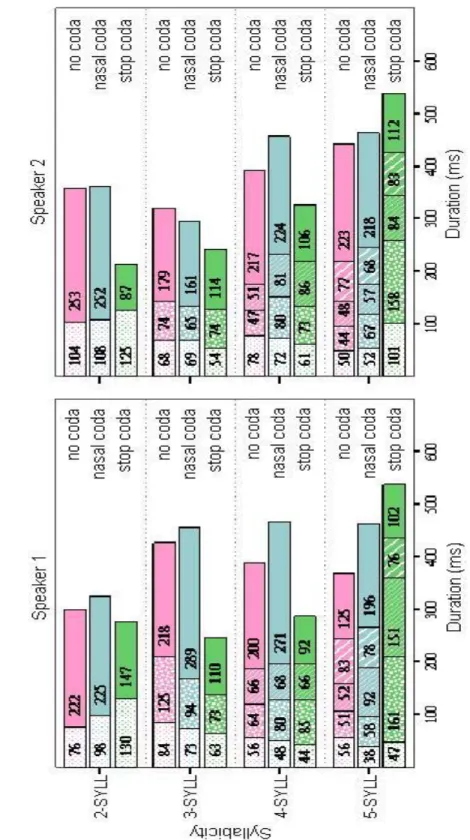
4.3.1 Comparison of accented and preaccented syllables. Durations of pre-accented and pre-accented syllable rhymes are shown in ²gure 4. In most instances, the accented rhymes were much longer than the preaccented ones. In the stop-coda condi-tion, however, the accented rhyme was not necessarily longer but rather approximate in length to the preaccented syllables. In the 5-syllable condition, the second preaccented syllable was actually longer than the accented syllable, which could be the result of its intrinsically longer diphthong vowel /ay/ (minaywawa:ak).
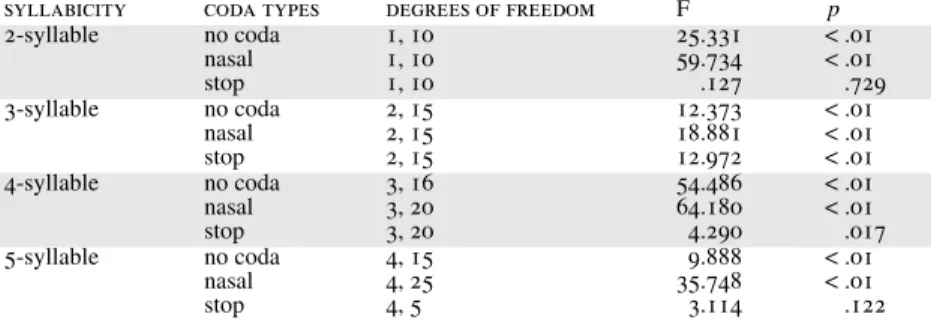
The results presented in table 4a represent a statistical analysis of the data in ²gure 4. This analysis compared the durations of preaccented and accented rhymes; the dependent variable is duration (in ms), and the independent variable is accent (Acc vs. pre-Acc).These results demonstrate that rhyme durations were signi²cantly different between accented and preac-cented syllables in both no-coda and nasal-coda conditions. As shown in table 4a, the dura-tions of accented and preaccented rhymes in the stop-coda condition did not significantly differ from one another. A Bonferroni post hoc test also showed that accented rhymes were longer than preaccented rhymes in both no-coda and nasal-coda conditions, and that preac-cented rhymes did not signi²cantly differ in length across coda and syllabicity conditions. 4.3.2 Accented syllables compared across coda types. Table 4b presents the results of an anova comparing the durations of accented syllables (the dependent vari-able) across three coda types (the independent varivari-able). Results demonstrate signi²cant differences among the three coda types. A Bonferroni post-hoc test showed that accented rhymes in the no-coda and nasal-coda conditions were longer than accented rhymes in the stop-coda condition.
TABLE 4A. ANOVA: COMPARISON OF DURATIONS BETWEEN PREACCENTED AND ACCENTED SYLLABLES IN VARIOUS SYLLABICITY AND CODA-TYPE CONDITIONS
syllabicity coda types degrees of freedom F p
2-syllable no coda nasal stop 1, 10 1, 10 1, 10 25.331 59.734 .127 < .01 < .01 .729 3-syllable no coda nasal stop 2, 15 2, 15 2, 15 12.373 18.881 12.972 < .01 < .01 < .01 4-syllable no coda nasal stop 3, 16 3, 20 3, 20 54.486 64.180 4.290 < .01 < .01 .017 5-syllable no coda nasal stop 4, 15 4, 25 4, 5 9.888 35.748 3.114 < .01 < .01 .122 TABLE 4B. ANOVA: COMPARISON OF THE DURATIONS OF
ACCENTED SYLLABLES AMONG THREE CODA TYPES IN VARIOUS SYLLABICITY CONDITIONS
syllabicity degrees of freedom F p
2-syllable 2, 15 13.485 < .01
3-syllable 2, 15 5.510 < .05
4-syllable 2, 14 31.347 < .01
418 oceanic linguistics, vol. 44, no. 2
4.4 SLOPE
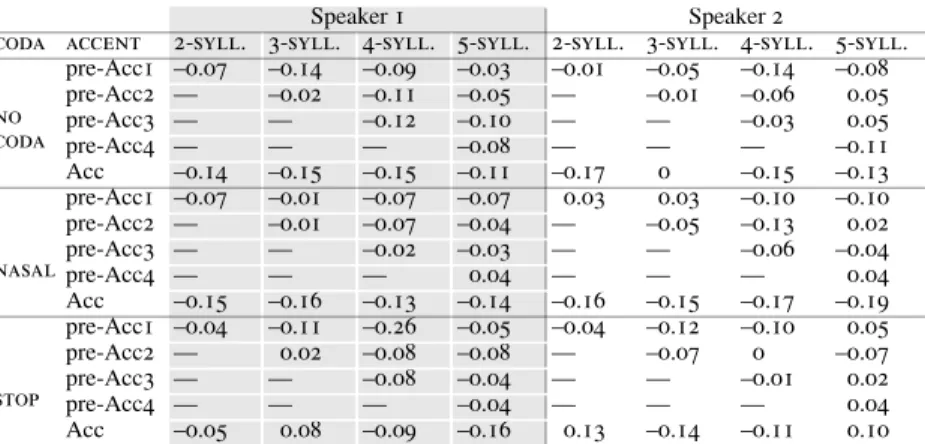
4.4.1 Comparison of accented and preaccented syllables. Slope measurement examined the rate of movement from the F0 peak to the F0 valley. Table 5a illustrates the individual differences found between the two speakers. Most of the F0 slopes produced by Speaker 1 have negative values, which represent falling contours. Only three exceptions occur, in which the values of slopes (0.02 to 0.08) exhibit slightly rising contours. More-over, items in the no-coda and nasal-coda conditions have steeper falling contours (–0.16 to –0.11) on accented syllables than those in the stop-coda condition do (0.08 to –0.16). Speaker 2, in contrast, exhibits no clear tendency to produce steeper falling contours on no-coda and nasal-coda accented syllables than he does on stop-coda syllables.
anova results for the comparison of the slopes of accented and preaccented rhymes are given in table 5b. As in 5a, slope is the dependent variable and accent (Acc v. pre-Acc) is the independent variable. Surprisingly, differences between the slopes of accented and preaccented rhymes were not signi²cant. In the nasal-coda condition, however, accented rhymes exhibited signi²cantly steeper slopes than preaccented rhymes, for all items except those in the 4-syllable group.
4.4.2 Comparison of accented syllables across coda types. Tables 5a and 5b show that in the nasal-coda condition, slopes of accented rhymes are steeper than those of preaccented rhymes. This section examines the effect of coda type on the F0 slope of accented rhymes. anova results comparing the slopes of accented rhymes (the dependent variable) across three coda types (the independent variable) are given in Table 5c. Slopes of accented rhymes were not signi²cantly different across coda types, except in the 2-syllable condition. Thus, it appears that coda type does not affect the slope of accented rhymes.
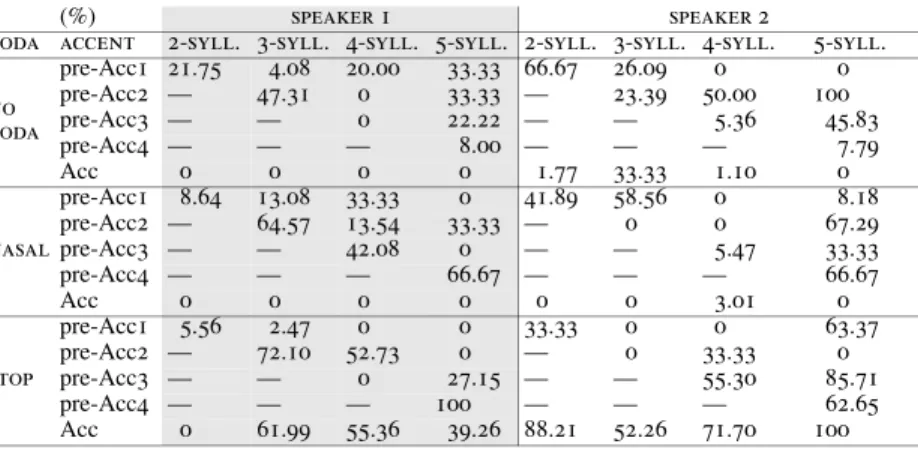
4.5 F0 PEAK ALIGNMENT. Our investigation of F0 peak alignment measured the temporal position in which the pitch peak is located within any given lexical item. Table 6 shows the locations of F0 peak alignment in accented and preaccented syllables.
TABLE 5A. SLOPES OF PREACCENTED AND ACCENTED SYLLABLES IN VARIOUS CODA-TYPE AND SYLLABICITY CONDITIONS
Speaker 1 Speaker 2
coda accent 2-syll. 3-syll. 4-syll. 5-syll. 2-syll. 3-syll. 4-syll. 5-syll.
no coda pre-Acc1 –0.07 –0.14 –0.09 –0.03 –0.01 –0.05 –0.14 –0.08 pre-Acc2 — –0.02 –0.11 –0.05 — –0.01 –0.06 0.05 pre-Acc3 — — –0.12 –0.10 — — –0.03 0.05 pre-Acc4 — — — –0.08 — — — –0.11 Acc –0.14 –0.15 –0.15 –0.11 –0.17 0 –0.15 –0.13 nasal pre-Acc1 –0.07 –0.01 –0.07 –0.07 0.03 0.03 –0.10 –0.10 pre-Acc2 — –0.01 –0.07 –0.04 — –0.05 –0.13 0.02 pre-Acc3 — — –0.02 –0.03 — — –0.06 –0.04 pre-Acc4 — — — 0.04 — — — 0.04 Acc –0.15 –0.16 –0.13 –0.14 –0.16 –0.15 –0.17 –0.19 stop pre-Acc1 –0.04 –0.11 –0.26 –0.05 –0.04 –0.12 –0.10 0.05 pre-Acc2 — 0.02 –0.08 –0.08 — –0.07 0 –0.07 pre-Acc3 — — –0.08 –0.04 — — –0.01 0.02 pre-Acc4 — — — –0.04 — — — 0.04 Acc –0.05 0.08 –0.09 –0.16 0.13 –0.14 –0.11 0.10
Two observations about pitch peak alignment can be drawn from these data. First, no discernable pattern of pitch peak alignment appeared to occur in preaccented rhymes. Accented rhymes, in contrast, exhibited the following patterns: in no-coda and nasal-coda conditions, the F0 peak regularly occurred in the ²rst one-third of the accented syllable rhyme. In the stop-coda condition, however, the F0 peak usually occurred in the later half of the rhyme, which we classify as “peak delay.” In addition, individual differences were observed between speakers. Speaker 2 produced a larger degree of peak delay than Speaker 1 did. Moreover, Speaker 1 exhibited no peak delay at all in the 2-syllable accented condition.
TABLE 5B. ANOVA: COMPARISON OF SLOPES BETWEEN PREACCENTED AND ACCENTED SYLLABLES IN VARIOUS
SYLLABICITY AND CODA-TYPE CONDITIONS
syllabicity coda types degrees of freedom F p
2-syllable no coda nasal stop 1, 10 1, 10 1, 10 7.174 10.270 2.437 .023 < .01 .150 3-syllable no coda nasal stop 2, 15 2, 15 2, 15 1.672 8.170 .809 .221 < .01 .464 4-syllable no coda nasal stop 3, 16 3, 20 3, 20 1.002 2.565 1.154 .418 .083 .352 5-syllable no coda nasal stop 4, 15 4, 25 4, 5 .861 11.038 .447 .510 < .01 .772 TABLE 5C. ANOVA: COMPARISON OF THE SLOPES OF ACCENTED
SYLLABLES AMONG THREE CODA TYPES IN VARIOUS SYLLABICITY CONDITIONS
syllabicity degrees of freedom F p
2-syllable 2, 15 12.037 < .01
3-syllable 2, 15 1.019 .385
4-syllable 2, 14 .593 .566
5-syllable 2, 9 2.886 .108
TABLE 6. PITCH PEAK ALIGNMENT OF PREACCENTED AND ACCENTED SYLLABLES IN VARIOUS CODA-TYPE AND SYLLABICITY CONDITIONS
(%) speaker 1 speaker 2
coda accent 2-syll. 3-syll. 4-syll. 5-syll. 2-syll. 3-syll. 4-syll. 5-syll.
no coda pre-Acc1 21.75 4.08 20.00 33.33 66.67 26.09 0 0 pre-Acc2 — 47.31 0 33.33 — 23.39 50.00 100 pre-Acc3 — — 0 22.22 — — 5.36 45.83 pre-Acc4 — — — 8.00 — — — 7.79 Acc 0 0 0 0 1.77 33.33 1.10 0 nasal pre-Acc1 8.64 13.08 33.33 0 41.89 58.56 0 8.18 pre-Acc2 — 64.57 13.54 33.33 — 0 0 67.29 pre-Acc3 — — 42.08 0 — — 5.47 33.33 pre-Acc4 — — — 66.67 — — — 66.67 Acc 0 0 0 0 0 0 3.01 0 stop pre-Acc1 5.56 2.47 0 0 33.33 0 0 63.37 pre-Acc2 — 72.10 52.73 0 — 0 33.33 0 pre-Acc3 — — 0 27.15 — — 55.30 85.71 pre-Acc4 — — — 100 — — — 62.65 Acc 0 61.99 55.36 39.26 88.21 52.26 71.70 100
420 oceanic linguistics, vol. 44, no. 2
4.6 INTENSITY PEAK
4.6.1 Comparison of accented and preaccented syllables. Intensity peak was measured as the highest dB value occurring in each syllable rhyme. Intensity peaks of preaccented and accented rhymes across syllabicity and coda-type conditions are given in table 7a. Accented syllables exhibit the highest intensity peak in the 2-, 3-and 4-syllable conditions, with the exception of Speaker 2’s 2- 3-and 4-syllable nasal-coda condition productions. For both speakers, the intensity peak in the accented sylla-bles of ²ve-syllable items does not exceed that of preaccented syllasylla-bles.
Results of an anova comparing intensity peak across accented and preaccented syllables appear in table 7b. Intensity peak (dB) is the dependent variable, and Accent (Acc vs. pre-Acc) is the independent variable. As seen in table 7b, no signi²cant differ-ence was found in intensity peak height between preaccented and accented syllables, irrespective of syllabicity and coda type.
TABLE 7A. INTENSITY PEAKS OF PREACCENTED AND ACCENTED SYLLABLES IN VARIOUS CODA-TYPE AND SYLLABICITY CONDITIONS
dB: Mean (SD) speaker 1 speaker 2
coda accent 2-syll. 3-syll. 4-syll. 5-syll. 2-syll. 3-syll. 4-syll. 5-syll.
no coda
pre-Acc1 72 (2.4) 55 (2.4) 57 (3.2) 55 (2.9) 59 (4.5) 53 (2.5) 56 (2.9) 57* †
† Asterisks indicate inability to calculate standard deviation because only one item could be found in the lexicon (5-syllable, stop-coda), or because of missing data in the test condition paradigm (Speaker 2, 5-syllable, no coda).
pre-Acc2 — 56 (2.0) 59 (1.1) 52 (1.8) — 52 (2.2) 57 (0.2) 59* pre-Acc3 — — 56 (7.1) 55 (2.5) — — 59 (1.3) 56* pre-Acc4 — — — 53 (0.6) — — — 57* Acc 75 (3.6) 59 (1.8) 59 (1.7) 54 (1.5) 61 (3.1) 57 (1.4) 59 (2.4) 55* nasal pre-Acc1 68 (2.4) 59 (2.0) 57 (2.0) 56 (2.7) 60 (2.8) 56 (1.4) 60 (0.5) 57 (2.8) pre-Acc2 — 60 (1.9) 56 (0.9) 56 (1.2) — 53 (3.1) 57 (1.0) 58 (1.0) pre-Acc3 — — 57 (1.4) — — 58 (2.3) 57 (2.9) pre-Acc4 — — — 56 (1.6) — — — 56 (3.0) Acc 74 (2.7) 63 (1.7) 59 (1.9) 55 (0.2) 60 (0.7) 56 (3.3) 58 (1.5) 57 (0.8) stop pre-Acc1 71 (1.7) 57 (3.5) 55 (2.4) 57* 60 (1.8) 56 (3.7) 59 (2.6) 57* pre-Acc2 — 57 (1.3) 54 (0.9) 56* — 57 (2.0) 58 (1.9) 57* pre-Acc3 — — 56 (2.7) 57* — — 56 (1.9) 58* pre-Acc4 — — — 54* — — — 60* Acc 74 (2.5) 62 (1.8) 58 (3.3) 54* 62 (0.8) 60 (2.2) 59 (0.7) 59*
TABLE 7B. ANOVA: COMPARISON OF INTENSITY PEAKS BETWEEN PREACCENTED AND ACCENTED SYLLABLES IN VARIOUS SYLLABICITY AND CODA-TYPE CONDITIONS
syllabicity coda types degrees of freedom F p
2-syllable no coda nasal stop 1, 10 1, 10 1, 10 .201 .759 .437 .663 .404 .524 3-syllable no coda nasal stop 2, 15 2, 15 2, 15 5.125 .791 5.805 .02 .471 .014 4-syllable no coda nasal stop 3, 16 3, 20 3, 20 .686 1.794 1.553 .573 .181 .232 5-syllable no coda nasal stop 4, 15 4, 25 4, 5 .340 .387 .066 .846 .816 .989
4.6.2 Comparison of accented syllables across coda types. Next, we compare intensity peaks in accented rhymes (the dependent variable) across different coda types (the independent variable), the results of which appear in table 7c. There is no signi²cant difference among the intensity peaks of accented syllables across the three coda types. Thus, the factor of coda type did not appear to cause variation in the inten-sity peak height of accented syllables.
4.7 INTERIM SUMMARY. The checklist in table 8 summarizes the results pre-sented above. A check mark indicates that variation in a particular parameter contrib-utes to the contrast between preaccented and accented syllables, while the absence of a check mark means that no signi²cant difference in that parameter value was observed between preaccented and accented syllables.
Our results suggest that pitch range is the most important parameter used to contrast accented and preaccented syllables. That is to say, accented syllables differ most substan-tially from preaccented syllables in terms of pitch range. In both no-coda and nasal-coda conditions, duration and F0 height are also important in distinguishing accented syllables, which were found to have a signi²cantly longer duration and greater F0 variation among the four points than the preaccented syllables did. Furthermore, F0 peak alignment, F0 slope, and intensity seem to have less of an effect.
As for coda type, the stop-coda items differed from the other two coda types in many respects: they exhibit peak delay on accented syllables, and they have less pronounced F0 variation, shorter duration, and shallower F0 slopes. No-coda and nasal-coda items differ from one another only with respect to F0 slope; accented syllables usually have signi²cantly steeper slopes in the nasal-coda condition than they do in the no-coda condition.
TABLE 7C. ANOVA: COMPARISON OF THE INTENSITY PEAKS OF ACCENTED SYLLABLES AMONG THREE CODA TYPES
IN VARIOUS SYLLABICITY CONDITIONS
syllabicity degrees of freedom F p
2-syllable 2, 15 .028 .973
3-syllable 2, 15 1.510 .253
4-syllable 2, 14 .118 .889
5-syllable 2, 9 2.299 .156
TABLE 8. INTERIM SUMMARY
parame-ters
2-syllable 3-syllable 4-syllable 5-syllable
no coda na-sal stop no coda na-sal stop no coda na-sal stop no coda na-sal stop F0 height √ √ √ √ √ √ √ √ pitch range √ √ √ √ √ √ √ √ √ √ duration √ √ √ √ √ √ √ √ √ slope √ √ √ F0 peak alignment peak
delay peak delay peak delay peak delay
intensity peak
422 oceanic linguistics, vol. 44, no. 2
5. DISCUSSION AND CONCLUSION. The results presented in this paper dem-onstrate that in Saisiyat, accented and preaccented syllables are primarily contrasted using two parameters: F0 height and pitch range. Changes in these two parameters create prominence on accented syllables. Accented rhymes always exhibit the highest F0 peaks and lowest F0 valleys; signi²cant F0 peak/valley differences and onset/offset differences have been shown between accented and preaccented syllables.
The pitch range of an accented syllable is also signi²cantly larger than that of a pre-accented syllable. Pitch range, peak/valley, and onset/offset parameters are similar in that they are all related to pitch height; however, the use of one parameter does not guarantee the presence of another. For example, in the stop-coda condition, even though there is no signi²cant difference between F0 peak and valley between accented and preaccented syllables, the pitch range of accented syllables is still much larger than those of preaccented syllables. Overall, pitch range seems to be the most important parameter used to distinguish accented from preaccented syllables.15
Intensity does not appear to play an important role in realizing syllable prominence. As for duration, even though most accented rhymes have longer durations than pre-accented ones do, these may be the result of ²nal lengthening, because in Saisiyat, accent falls on the ²nal syllable. To remove the ²nal lengthening confound, languages whose accent falls on the penultimate syllable should be investigated to test whether duration is used to realize prominence. However, Chiang’s (1997) research on Seediq,16 a language in which accent falls on the penultimate syllable, showed that accented syllables are not longer in duration than unaccented ²nal syllables. This phenomenon might indirectly suggest that final lengthening contributes to longer durations of the final-syllable accented rhymes in Saisiyat, and that duration might not be as reliable a cue of accent as pitch, from a cross-linguistic perspective.
F0 slope is another parameter that does not appear to contribute to distinguishing accented from preaccented syllables. This con²rms the predictions made by Carroll and associates (Carroll and Chang 1970; Harshman 1970, 1972; Carroll and Wish 1974a, 1974b) in their model of Multidimensional Scaling Analysis of tone perception. This model proposed that the world’s languages are perceived in terms of very similar dimen-sions, but differ enormously with respect to the relative importance of those dimensions.
15. One might argue that the final syllable can exhibit some properties that are independently associ-ated with accent or stress, the potential confounds being terminal pitch falls (final lowering) and final lengthening in neutral declarative intonation contours. (We would like to thank a very help-ful anonymous reviewer for pointing this out.) With respect to final lowering, it might cause the pitch range to enlarge at the final syllable, which happens to be the accented syllable. To disentan-gle the use of pitch to convey final lowering from the use of pitch to indicate accent, it might be necessary to see whether the peak in accented syllable is statistically higher than that in unac-cented syllable. The anova test in our study shows that the peak in the acunac-cented syllable is signif-icantly higher than that in the unaccented syllable in 2-syllable and 4-syllalbe conditions at the p < .01 level (F[1, 34] = 4.048 and F[3, 64] = 4.795, respectively). Furthermore, the peak in the accented syllable is significantly higher than that in the unaccented syllable in the 5-syllable con-dition at the p < .05 level (F[4, 55] = 3.591). With respect to the 3-syllable concon-dition, there is no significant difference between the accented and unaccented syllables (F[2, 51] = 2.223), although the mean of the former is higher than the latter (mean=114.23 [SD = 10.52] Hz for accented sylla-bles, 108.60 [SD = 9.19] Hz for pre-Acc1 syllasylla-bles, and 108.84 [SD = 7.11] Hz for pre-Acc2 syl-lables). Overall, the accented syllable exhibits a higher peak than the unaccented one does. 16. Seediq is another Austronesian language of Taiwan.
The ²ve dimensions are: (1) average pitch, (2) direction, (3) length, (4) extreme endpoint, and (5) slope. Among these, they claim that slope is the least important as a perceptual cue in both tonal and nontonal languages (English, Yoruba, and Thai). In summary, extreme F0 values and pitch range appear to be the most important features used to dis-tinguish accented syllables in Saisiyat.
These results provide evidence that Saisiyat should be classi²ed as a pitch accent lan-guage with respect to its realization of lexical-level accent, because realization of accent within words is accomplished using F0 parameters only. Duration is used only inconsis-tently for accent realization, and intensity does not appear to be used at all. These results are consistent with previous studies suggesting that pitch is the primary parameter used to realize accent (Muyskens 1931, Parmenter and Blanc 1933, Beckman 1986, Cruttenden 1997, Fox 2000, Remijsen 2003), and that intensity and duration play much less impor-tant roles (Schramm 1937, Jassem 1959, Bolinger 1958, Fry 1958). Among the three typological categories proposed by Remijsen (2003), namely lexical tone, lexical stress, and lexical pitch accent, we claim that the accents in Saisiyat are consistent with the cate-gory “lexical pitch accent,” because their realization consists of a single, speci²c F0-pat-tern, with no apparent contribution from other acoustic parameters.
It should be noted that variations in F0 peak alignment do occur across coda types. Stop-coda accented rhymes exhibit two distinguishing characteristics: F0 peak delay and truncation of their falling contours. In stop-coda syllables, F0 peaks occur in the latter half of the accented rhyme, whereas F0 peaks occur within the ²rst third of the syllable in the no-coda syllable and nasal-coda conditions. Section 4.4 has presented evidence that stop-coda accented rhymes generally exhibit a shorter falling contour than those occurring in no-coda and nasal-coda accented syllables. We attribute this to the fact that their F0 peak occurs later in the syllable, and that their overall duration is much shorter than those of no-coda and nasal-coda syllables. The falling contour is truncated because the duration of a stop-coda syllable’s rhyme is insuf²cient for pitch to fall as far as it does in no-coda or nasal-coda accented rhymes. Note that the term “peak delay” is used here in a sense that differs somewhat from previous studies (Silverman and Pierrehumbert 1990, Xu 2001) in which it is de²ned as postponement of an F0 peak from an accented syllable into the unaccented syllable directly following it in various prosodic conditions. The peak delay that we describe is a temporal difference in F0 alignment within the accented syllable that is caused by segmental differences in coda type. We use it to more precisely differentiate the pitch contours occurring in stop-coda syllables from those occurring in nasal-coda and no-coda syllables. The peak delay in Saisiyat stop-coda syllables, however, is not used to contrast accent type, as it does in Swedish (Bruce 1977). Our study has found no evidence to suggest that Saisiyat has more than one pitch accent type.
The acoustic data presented here demonstrate that pitch accents in Saisiyat are real-ized in F0 height and range, but not F0 slope or peak alignment. Speci²cally, lexical pitch accents in Saisiyat are made prominent through expansion of pitch contrasts. Due to the paucity of acoustic studies on Austronesian languages, little is known about their prosodic typology. This is the ²rst study to contribute acoustic data for the prosodic analysis of Saisiyat, and it provides evidence for the typological classi²cation of
424 oceanic linguistics, vol. 44, no. 2 Saisiyat as a pitch accent language. Future research is needed to investigate whether other Austronesian languages of Taiwan exhibit similar prosodic patterns.
APPENDICES
APPENDIX 1. MEAN F0 VALUES AND STANDARD DEVIATIONS OF FOUR MEASURED POINTS IN PREACCENTED AND ACCENTED SYLLABLES
IN THE 2-SYLLABLE CONDITION ACROSS THREE CODA TYPES
2-syllable F0: Mean (SD)
coda accent onset offset peak valley
no coda
pre-Acc1 102.16 (9.95) 102.34 (10.26) 103.76 (9.02) 99.03 (9.99)
Acc 111.19 (6.53) 80.58 (4.72) 111.20 (6.54) 79.34 (4.12)
nasal pre-Acc 1Acc 103.17115.11 (7.88) 100.24(7.74) 79.87 (7.91) 104.77(4.97) 115.11 (7.44)(7.74) 99.2979.49 (7.37)(4.46) stop pre-Acc 1Acc 115.18 (10.69) 113.04 (15.76) 118.77 (14.58) 111.35 (14.11)99.88 (6.33) 97.17 (7.83) 100.36 (6.66) 96.37 (7.17)
APPENDIX 2. MEAN F0 VALUES AND STANDARD DEVIATIONS OF FOUR MEASURED POINTS IN PREACCENTED AND ACCENTED SYLLABLES
IN THE 3-SYLLABLE CONDITION ACROSS THREE CODA TYPES
3-syllable F0: Mean (SD)
coda accent onset offset peak valley
no coda pre-Acc 1 108.63 (12.91) 101.75 (8.87) 108.90 (12.68) 101.46 (8.92) pre-Acc 2 102.99 (6.49) 102.21 (7.16) 104.26 (6.68) 100.82 (6.26) Acc 107.84 (11.42) 90.77 (9.08) 108.88 (10.57) 87.48 (6.38) nasal pre-Acc1 106.77 (8.86) 107.20 (6.72) 109.20 (8.16) 105.15 (7.84) pre-Acc2 110.71 (9.06) 108.85 (9.06) 111.51 (8.67) 107.87 (7.90) Acc 113.32 (12.43) 85.63 (5.47) 113.32 (12.43) 83.00 (2.38) stop pre-Acc1 107.71 (7.62) 102.82 (7.33) 107.71 (7.62) 102.23 (7.59) pre-Acc2 110.02 (2.80) 108.41 (5.77) 110.77 (3.74) 107.53 (4.79) Acc 118.00 (5.73) 114.65 (11.97) 120.48 (5.26) 108.94 (10.10)
APPENDIX 3. MEAN F0 VALUES AND STANDARD DEVIATIONS OF FOUR MEASURED POINTS IN PREACCENTED AND ACCENTED SYLLABLES
IN THE 4-SYLLABLE CONDITION ACROSS THREE CODA TYPES
4-syllable F0: Mean (SD)
coda accent onset offset peak valley
no coda pre-Acc1 111.07 (5.79) 105.88 (7.82) 111.08 (5.79) 105.83 (7.900 pre-Acc2 112.26 (4.70) 106.81 (6.36) 112.45 (4.58) 106.59 (6.22) pre-Acc3 108.46 (10.37) 105.34 (7.53) 108.52 (10.38) 104.73 (8.36) Acc 115.84 (5.93) 86.36 (7.86) 115.84 (5.92) 85.96 (7.87) nasal pre-Acc1 112.88 (5.68) 108.31 (5.59) 113.08 (5.56) 107.65 (5.99) pre-Acc2 111.51 (5.69) 106.45 (5.69) 111.63 (7.63) 106.25 (5.54) pre-Acc3 108.87 (5.16) 107.82 (5.94) 109.21 (5.31) 106.91 (5.64) Acc 113.23 (7.87) 80.24 (6.23) 113.42 (7.82) 79.21 (5.64) stop pre-Acc1 112.81 (6.58) 107.09 (5.42) 112.81 (6.58) 106.67 (4.93) pre-Acc2 104.76 (4.58) 103.23 (7.22) 106.21 (2.95) 101.40 (6.45) pre-Acc3 105.73 (2.62) 104.42 (3.71) 106.06 (2.75) 103.21 (2.91) Acc 113.90 (6.60) 114.30 (9.58) 117.56 (7.49) 111.22 (7.61)
REFERENCES
Beckman, Mary E. 1986. Stress and non-stress accent. Netherlands Phonetic Archives 7. Dordrecht: Foris.
Blood, David L. 1964. Applying the criteria of patterning in Cham phonology. Van-hóa Nguyêt-san 13:515–20.
Bolinger, Dwight L. 1958. A theory of pitch accent in English. Word 14:109–49. Bruce, Gösta. 1977. Swedish word accents in sentence perspective. Lund: Gleerup. Campbell, Nick. 1993. Automatic detection of prosodic boundaries in speech. Speech
Communication 13:343–54.
Carroll, J. Douglas, and Jie-Jie Chang. 1970. Analysis of individual differences in mul-tidimensional scaling via an n-way generalization of “Eckart-Young” decomposi-tion. Psychometrika, 35(3): 283–319.
Carroll, J. Douglas, and Myron Wish. 1974a. Multidimensional perceptual models and measurement methods. In Handbook of perception: Psychophysical judgment and
measurement, vol. 2, ed. by E. C. Carterette and M. P. Friedman, 391–447. New York: Academic Press.
———. 1974b. Models and methods for three-way multidimensional scaling. In
Con-temporary developments in mathematical psychology, vol. 2, ed. by D. H. Krantz, R. O. Atkinson, R. D. Luce, and P. Suppes, 57–105. New York: W. H. Freeman. Chiang, Wen-yu. 1997. An acoustic study of Atayal and Seediq accents. Ms. Cruttenden, Alan. 1997. Intonation. (2d ed.) New York: Cambridge University Press. Fox, Anthony. 2000. Prosodic features and prosodic structure: The phonology of
supra-segmentals. New York: Oxford University Press.
Fry, Dennis B. 1958. Experiments in the perception of stress. Language and Speech 1:126–52.
Gandour, Jackson T. 1978. The perception of tone. In Tone: A linguistic survey, ed. by V. A. Fromkin, 41–76. New York: Academic Press.
APPENDIX 4. MEAN F0 VALUES AND STANDARD DEVIATIONS FOR TARGETS IN PREACCENTED AND ACCENTED SYLLABLES IN THE 5-SYLLABLE CONDITION ACROSS THREE CODA TYPES
5-syllable F0: Mean (SD)
coda accent onset offset peak valley
no coda pre-Acc1 103.26 (8.75) 100.33 (6.89) 103.30 (8.67) 99.25 (7.85) pre-Acc2 100.75 (2.66) 99.14 (4.14) 101.35 (2.88) 98.22 (3.45) pre-Acc3 104.38 (6.21) 101.85 (6.27) 104.72 (6.07) 101.55 (6.09) pre-Acc4 102.47 (3.59) 98.78 (5.02) 103.19 (4.42) 98.27 (5.21) Acc 106.28 (2.84) 90.28 (8.04) 106.28 (2.84) 88.93 (7.86) nasal pre-Acc1 109.18 (5.52) 104.13 (7.62) 109.18 (5.52) 104.13 (7.62) pre-Acc2 101.11 (3.83) 101.03 (3.50) 102.13 (4.02) 99.69 (3.03) pre-Acc3 102.85 (4.39) 101.07 (3.75) 103.07 (4.00) 100.61 (4.11) pre-Acc4 101.17 (4.90) 102.84 (5.39) 103.34 (4.89) 100.05 (4.53) Acc 108.64 (3.83) 75.10 (11.87) 108.64 (3.83) 74.87 (11.67) stop pre-Acc1 106.49 (2.21) 105.78 (0.06) 108.23 (0.25) 105.37 (0.64) pre-Acc2 105.88 (0.64) 104.63 (0.47) 105.88 (0.64) 101.79 (0.40) pre-Acc3 100.55 (1.15) 99.70 (1.11) 102.15 (2.11) 99.24 (0.47) pre-Acc4 100.52 (2.04) 103.04 (2.46) 103.10 (2.38) 100.52 (2.04) Acc 103.16 (2.30) 104.15 (11.93) 109.21 (4.77) 98.62 (4.11)
426 oceanic linguistics, vol. 44, no. 2
Harshman, Richard A. 1970. Foundations of the PARAFAC procedure: Models and condition for an “explanatory” multidimensional factor analysis. UCLA Working
Papers in Phonetics 16.
———. 1972. Determination and proof of minimum uniqueness conditions for PARAFAC 1. UCLA Working Papers in Phonetics 22:111–17.
Haudricourt, André Georges. 1954. Les origines asiatiques des langues
malayo-polyne-siennes. JSO 10:180–83.
———. 1972. Research in historical phonetics. La Pensee 163:34–38.
Hombert, Jean-Marie. 1978. Consonantal types, vowel quality, and tone. In Tone: A
lin-guistic survey, ed. by V. A. Fromkin, 71–111. New York: Academic Press. Hombert, Jean-Marie, John J. Ohala, and William G. Ewan. 1979. Phonetic
explana-tions for the development of tones. Language 55:37–58.
House, J. Daniel. 1989. Syllable structure constraints on F0 timing. Poster presenta-tion, Second Conference of Laboratory Phonology, Edinburgh.
Jassem, Wiktor. 1959. The phonology of Polish stress. Word 15:252–69.
Ladd, D. Robert. 1996. Intonational phonology. Cambridge: Cambridge University Press.
Liberman, Philip. 1960. Some acoustic correlates of words stress in American English.
Journal of the Acoustical Society of America 35: 344–53.
Matisoff, James A. 1973. Tonogenesis in Southeast Asia. In Consonant types and tone. Southern California Occastional Papers in Linguistics, ed. by L. M. Hyman, 71–96. Mohr, Boudewijn. 1968. Intrinsic fundamental frequency variation, II. Monthly Internal
Memorandum, Phonology Laboratory. Univ. of California, Berkeley, June 23–30. Muyskens, John H. 1931. An analysis of accent in English from kymograph records.
Vox 17(2): 55–65.
Parmenter, Clarence E., and A. V. Blanc. 1933. An experimental study of accent in English and French. Publications of the Modern Language Association of America
(PMLA) 48:598–607.
Prieto, Pilar, Jan van Santen, and Julia Hirschberg. 1995. Tonal alignment patterns in Spanish. Journal of Phonetics 23: 429–51.
Remijsen, Bert. 2003. New perspectives in word-prosodic typology. http://www.iias.nl/ iiasn/32/RR_new_perspectives_in_word_prosodic_typology.pdf
Schramm, Wilbur L. 1937. The acoustical nature of accent in American speech.
Ameri-can Speech 12:49–56.
Silverman, Kim E. A., and Janet B. Pierrehumbert. 1990. The timing of prenuclear high accents in English. In Papers in Laboratory Phonology I. Between the
gram-mar and physics of speech, ed. by John Kingston and Mary E. Beckman, 72–106. Cambridge: Cambridge University Press.
van der Mark, Sheena. 2002. The acoustic correlates of Blackfoot prominence.
Cal-gary Working Papers in Linguistics 24: 169–216.
Wolff, John U. 1993. Proto-Austronesian stress. In Tonality in Austronesian languages, ed. by Jerold A. Edmondson and Kenneth J. Gregerson, 1–15. Honolulu: Univer-sity of Hawai‘i Press.
Xu, Yi. 2001. F0 peak delay in Mandarin. Phonetica 58:26–52. Yeh, Mei-li. 2000. Saisiyat reference grammar. Taipei: Yuan-Liu.
Zorc, R. David. 1993. Overview of Austronesian and Philippine accent patterns. In
Tonality in Austronesian languages, ed. by Jerold A. Edmondson and Kenneth J. Gregerson, 17–24. Honolulu: University of Hawai‘i Press.