10.1192/bjp.178.1.29
Access the most recent version at DOI:
2001, 178:29-35.
BJP
CHWEN-CHENG CHEN, TZUNG-LIEH YEH, YI-HUI LEE and HSIN-YI LO
MIAN-YOON CHONG, HIN-YEUNG TSANG, CHENG-SHEN CHEN, TZE-CHUN TANG,
Prevalence, life events and socio-demographic correlates
Community study of depression in old age in Taiwan :
References
http://bjp.rcpsych.org/content/178/1/29#BIBL
This article cites 0 articles, 0 of which you can access for free at:
permissions
Reprints/
[email protected]
write to
To obtain reprints or permission to reproduce material from this paper, please
to this article at
You can respond
http://bjp.rcpsych.org/cgi/eletter-submit/178/1/29
from
Downloaded
The Royal College of Psychiatrists
Published by
on October 4, 2012
http://bjp.rcpsych.org/
go to:
The British Journal of Psychiatry
To subscribe to
Background
Background Published studies of
Published studies of
prevalence of depressionin old age in
prevalence of depressionin old age in
Taiwan have yielded equivocalresults.
Taiwan have yielded equivocalresults.
Aims
Aims To study the prevalence of
To study the prevalence of
depressive disorders among
depressive disorders among
community-dwelling elderly; further, to assess
dwelling elderly; further, to assess
socio-demographic correlates andlife eventsin
demographic correlates andlife eventsin
relationto depression.
relationto depression.
Method
Method A randomised sample of1500
A randomised sample of1500
subjects aged 65 and over was selected
subjects aged 65 and over was selected
fromthree communities.Research
fromthree communities.Research
psychiatrists conducted all assessments
psychiatrists conducted all assessments
using the Geriatric Mental State Schedule.
using the Geriatric Mental State Schedule.
The diagnosis ofdepressionwasmadewith
The diagnosisofdepressionwasmadewith
the GMS^AGECAT (Automated Geriatric
the GMS^AGECAT (Automated Geriatric
Examination for Computerised Assisted
Examination for Computerised Assisted
Taxonomy); data onlife events were
Taxonomy); data onlife events were
collected withtheTaiwanese version ofthe
collected withtheTaiwanese version ofthe
Life Events and Difficulties Schedule.
Life Events and Difficulties Schedule.
Results
Results One-month prevalence of
One-month prevalence of
psychiatric disorders was 37.7%, with
psychiatric disorders was 37.7%, with
15.3% depressive neurosis and 5.9% major
15.3% depressive neurosis and 5.9% major
depression. A high riskof depressive
depression. A high riskof depressive
disorderswas found among widowswith a
disorderswas found among widowswith a
low educationallevellivinginthe urban
low educationallevellivinginthe urban
community, and among those with
community, and among those with
physicalillnesses.
physicalillnesses.
Conclusions
Conclusions Contrary to most
Contrary to most
previous reports, we found thatthe
previous reports, we found thatthe
prevalence of depressive disorders among
prevalence of depressive disorders among
the elderlyinthe communityinTaiwanis
the elderlyinthe communityinTaiwanis
high and comparable to rates reportedin
high and comparable to rates reportedin
some studies of UKsamples.
some studies of UKsamples.
Declaration of interest
Declaration of interest The
The
National Health Research Institute of
National Health Research Institute of
Taiwan funded this project.
Taiwan funded this project.
Previous work on depression in old age in Previous work on depression in old age in Taiwan and other Eastern countries Taiwan and other Eastern countries emphas-ised lower rates of depressive illness than in ised lower rates of depressive illness than in Western and North American regions Western and North American regions (Table 1).The low risk of depression in (Table 1).The low risk of depression in Taiwan, for example, has been explained Taiwan, for example, has been explained by the positive effect of good family by the positive effect of good family support systems, with a tradition of giving support systems, with a tradition of giving respect to the elderly.However, recent respect to the elderly.However, recent epidemiological studies of community epidemiological studies of community sub-jects in Taiwan have shown that elderly jects in Taiwan have shown that elderly people had a higher risk of minor people had a higher risk of minor psychi-atric morbidity (Cheng, 1987; Chong, atric morbidity (Cheng, 1987; Chong, 1992).Moreover, available statistics have 1992).Moreover, available statistics have shown that elderly people presented a shown that elderly people presented a consistently increased risk of suicide consistently increased risk of suicide (Chong & Cheng, 1995), and many of (Chong & Cheng, 1995), and many of those who died by suicide were found those who died by suicide were found retro-spectively to have suffered from depressive spectively to have suffered from depressive disorders (Cheng, 1995).In view of the disorders (Cheng, 1995).In view of the above discrepancy, this study attempted to above discrepancy, this study attempted to examine the `true prevalence' of depression examine the `true prevalence' of depression in old age in the community in Taiwan, in old age in the community in Taiwan, using a rigorous epidemiological design. using a rigorous epidemiological design.
METHOD
METHOD
The study ± the Taiwan Old Age Depression The study ± the Taiwan Old Age Depression Study (TOADS) ± comprised a pilot study Study (TOADS) ± comprised a pilot study and the main survey.The pilot study was and the main survey.The pilot study was carried out in order to test and modify the carried out in order to test and modify the case-finding instruments, and to generate a case-finding instruments, and to generate a preliminary prevalence rate for an estimation preliminary prevalence rate for an estimation of the sample size needed for the main study. of the sample size needed for the main study.
Case definition and research
Case definition and research
instruments
instruments
Instruments used in this project include the Instruments used in this project include the Geriatric Mental State Schedule (GMS) and Geriatric Mental State Schedule (GMS) and the Life Events and Difficulties Schedule the Life Events and Difficulties Schedule (LEDS).
(LEDS).
The GMS is a standardised, The GMS is a standardised, semi-structured
structured interview designed to assessinterview designed to assess psychopathology for patients over 65 years psychopathology for patients over 65 years of age.It enables patients to be classified by of age.It enables patients to be classified by symptom profile, and can demonstrate symptom profile, and can demonstrate changes in that profile over time (Copeland changes in that profile over time (Copeland
et al
et al, 1976).A community version of the, 1976).A community version of the GMS was derived from the parent schedule GMS was derived from the parent schedule by omitting many of the items designed to by omitting many of the items designed to tap psychotic disorders less likely to be tap psychotic disorders less likely to be encountered in the community; this version encountered in the community; this version of the GMS has been used in European of the GMS has been used in European community studies (Copeland
community studies (Copeland et alet al, 1999)., 1999). The GMS was translated into Mandarin The GMS was translated into Mandarin (GMS±M), and modified with colloquial (GMS±M), and modified with colloquial terms relevant to the Taiwanese terms relevant to the Taiwanese commu-nities.Psychiatrists participating in the nities.Psychiatrists participating in the study had received training at the Institute study had received training at the Institute of Psychiatry, London.Interrater reliability of Psychiatry, London.Interrater reliability assessments of the GMS were carried out assessments of the GMS were carried out with their London colleagues and also with their London colleagues and also among the eight research psychiatrists in among the eight research psychiatrists in Taiwan before the study began.
Taiwan before the study began.
Depressive disorders and other types of Depressive disorders and other types of psychiatric morbidity were diagnosed by psychiatric morbidity were diagnosed by means of a computer-assisted system, the means of a computer-assisted system, the Automated Geriatric Examination for Automated Geriatric Examination for Computer Assisted Taxonomy (AGECAT). Computer Assisted Taxonomy (AGECAT). Its development has been described Its development has been described else-where (Dewey & Copeland, 1986; where (Dewey & Copeland, 1986; Cope-land
land et alet al, 1986, 1999).In brief, it uses, 1986, 1999).In brief, it uses scores on the symptoms components scores on the symptoms components obtained from the GMS interview described obtained from the GMS interview described above to derive diagnostic clusters.Each above to derive diagnostic clusters.Each subject is awarded a score (0±4 or 0±5) subject is awarded a score (0±4 or 0±5) for each diagnostic cluster.The levels on for each diagnostic cluster.The levels on each cluster are then compared to each each cluster are then compared to each other according to a hierarchy of diagnoses: other according to a hierarchy of diagnoses: organic brain syndrome, schizophrenia, organic brain syndrome, schizophrenia, mania, depression (major and neurotic), mania, depression (major and neurotic), and obsessional, hypochondriacal, phobic and obsessional, hypochondriacal, phobic and anxiety neuroses.The system arrives and anxiety neuroses.The system arrives at a main diagnosis and subsidiary at a main diagnosis and subsidiary diag-nosis.A subject who has no symptom nosis.A subject who has no symptom com-ponents is referred to as `well', while ponents is referred to as `well', while subjects with diagnostic confidence levels subjects with diagnostic confidence levels 1 and 2 are referred to as `sub-cases', and 1 and 2 are referred to as `sub-cases', and those with diagnostic confidence levels 3, those with diagnostic confidence levels 3, 4 or 5 are `cases'.The diagnostic agreement 4 or 5 are `cases'.The diagnostic agreement between the research psychiatrists and between the research psychiatrists and AGECAT was good, with generalised AGECAT was good, with generalised kk scores of 0.87 for depressive disorders and scores of 0.87 for depressive disorders and 0.73 for organic brain syndrome.
0.73 for organic brain syndrome.
The LEDS was used to collect detailed The LEDS was used to collect detailed information about the occurrence and information about the occurrence and context of adverse life events during the context of adverse life events during the year prior to the interview.This is a year prior to the interview.This is a semi-structured interview developed by Brown structured interview developed by Brown & Harris (1978), of Bedford College, & Harris (1978), of Bedford College, London University, for describing discrete London University, for describing discrete events and ongoing long-term difficulties events and ongoing long-term difficulties experienced by an individual.The experienced by an individual.The Taiwanese version (LEDS±T) was modified Taiwanese version (LEDS±T) was modified from the original version, and each from the original version, and each category of event or difficulty was category of event or difficulty was exten-sively defined.The exact date of an event sively defined.The exact date of an event
Community study of depression in old age inTaiwan
Community study of depression in old age inTaiwan
Prevalence, life events and socio-demographic correlates
Prevalence, life events and socio-demographic correlates
MIAN-YOON CHONG, CHWEN-CHENG CHEN, HIN-YEUNG TSANG, MIAN-YOON CHONG, CHWEN-CHENG CHEN, HIN-YEUNG TSANG, TZUNG-LIEH YEH, CHENG-SHENG CHEN, YI-HUI LEE, TZE-CHUN TANG TZUNG-LIEH YEH, CHENG-SHENG CHEN, YI-HUI LEE, TZE-CHUN TANG and HSIN-YI LO
CHONG E T AL CHONG E T A L
or difficulty was sought out and recorded or difficulty was sought out and recorded during the interview.The degree of threat during the interview.The degree of threat contained in each life event was rated on contained in each life event was rated on a four-point scale: 1 indicating `a marked a four-point scale: 1 indicating `a marked threat'; 2, `a moderate threat'; and 4, `little threat'; 2, `a moderate threat'; and 4, `little or no threat'.If an event rated moderate or no threat'.If an event rated moderate affected the subject, it was classified as affected the subject, it was classified as `an important moderately threatening `an important moderately threatening event'.The interrater reliability of threat event'.The interrater reliability of threat rating was satisfactory (
rating was satisfactory (kk0.75). The0.75). The average annual rate of life events reported average annual rate of life events reported per subject was 0.8. The mean range of per subject was 0.8. The mean range of uncertainty about the date of events was uncertainty about the date of events was 2.1 weeks (s.d.
2.1 weeks (s.d.3.8); 25.5% felt certain3.8); 25.5% felt certain about the exact date on which an event about the exact date on which an event had occurred; 29.3% felt certain within 1 had occurred; 29.3% felt certain within 1 week; 17.5% felt certain within 1±2 weeks; week; 17.5% felt certain within 1±2 weeks; and 25.3% felt certain within 3±4 weeks. and 25.3% felt certain within 3±4 weeks.
Subjects
Subjects
Estimation of sample size Estimation of sample size
In the pilot study, 120 randomised subjects In the pilot study, 120 randomised subjects aged 65 and above were selected from a aged 65 and above were selected from a community.A senior psychiatrist trained community.A senior psychiatrist trained in using the GMS assessed all subjects. in using the GMS assessed all subjects. Thirteen subjects (10.9%; 95% CI 5.3± Thirteen subjects (10.9%; 95% CI 5.3± 16.5) were diagnosed as having depressive 16.5) were diagnosed as having depressive disorders using the GMS±AGECAT system. disorders using the GMS±AGECAT system. With this estimate as a reference, an With this estimate as a reference, an adequate sample size required for the main adequate sample size required for the main study was then calculated as 1485 (to study was then calculated as 1485 (to achieve a power of 0.95, with
achieve a power of 0.95, with PP550.05).0.05).
Study population and sampling Study population and sampling
Three communities ± respectively from a Three communities ± respectively from a rural (
rural (Nan-hwaNan-hwa), a semi-urban (), a semi-urban (AlianAlian)) and an urban location (metropolitan and an urban location (metropolitan
Kaohsiung
Kaohsiung)) inin southsouth Taiwan ± wereTaiwan ± were selected for the study.In order to avoid a selected for the study.In order to avoid a selection bias towards underestimation of selection bias towards underestimation of the `true' residency of old people in these the `true' residency of old people in these communities, the census was first consulted communities, the census was first consulted at the respective registration offices.It was at the respective registration offices.It was then scrutinised for different age groups then scrutinised for different age groups and re-checked for their residence by local and re-checked for their residence by local officials before the study was carried out. officials before the study was carried out. A random selection procedure was used A random selection procedure was used to select subjects with a probability to select subjects with a probability pro-portional to the size of the aged population portional to the size of the aged population studied.A multi-stage random selection was studied.A multi-stage random selection was adopted in the urban community, first in adopted in the urban community, first in selecting districts, then the
selecting districts, then the LiLi andand LingLing (district subdivisions in Taiwan).In the (district subdivisions in Taiwan).In the semi-urban and rural communities, semi-urban and rural communities, randomised selection proportional to size randomised selection proportional to size was adopted because of the relatively was adopted because of the relatively smaller number of elderly in the population. smaller number of elderly in the population. For logistical reasons, a total number of For logistical reasons, a total number of 1500 subjects (500 from each community) 1500 subjects (500 from each community) were recruited for the main study. were recruited for the main study.
Data analysis
Data analysis
The prevalence of all psychiatric and The prevalence of all psychiatric and depressive morbidity was calculated using depressive morbidity was calculated using the GMS±AGECAT, with a 95% CI. the GMS±AGECAT, with a 95% CI. Univariate analyses of various Univariate analyses of various socio-demographic variables and life events were demographic variables and life events were performed in relation to the depressive performed in relation to the depressive disorders, first with descriptive statistics, disorders, first with descriptive statistics, including odds ratio (with 95% including odds ratio (with 95% CI).Identi-fied significant variables were then further fied significant variables were then further analysed with multivariate analyses using analysed with multivariate analyses using logistic regression (applying the likelihood logistic regression (applying the likelihood ratio estimation).
ratio estimation).
RESULTS
RESULTS
The study was carried out between The study was carried out between mid-1996 and the end of 1998.It took a longer 1996 and the end of 1998.It took a longer time than a typical community survey time than a typical community survey because of the need for careful preparation, because of the need for careful preparation, the training of research psychiatrists, and the training of research psychiatrists, and the wide area of distribution of the subjects the wide area of distribution of the subjects studied.
studied.
Altogether, 1350 (90.0%) subjects Altogether, 1350 (90.0%) subjects suc-cessfully completed the interview (the cessfully completed the interview (the respondents); 123 (8.2%) subjects refused respondents); 123 (8.2%) subjects refused (non-respondents); and 27 (1.8%) died (non-respondents); and 27 (1.8%) died before the interview.Most of those who before the interview.Most of those who died suffered from chronic physical illness died suffered from chronic physical illness related to ageing.The respondent rates related to ageing.The respondent rates were especially high in the rural (95.6%) were especially high in the rural (95.6%) and semi-urban (95.4%) communities, and semi-urban (95.4%) communities, and somewhat lower (at 81.1%) in the and somewhat lower (at 81.1%) in the urban community. urban community.
Socio-demographic characteristics
Socio-demographic characteristics
of respondents
of respondents
Respondents consisted of 673 (49.9%) Respondents consisted of 673 (49.9%) males and 677 (50.1%) females (Table 2). males and 677 (50.1%) females (Table 2). Most of them (88.9%) were ethnic Most of them (88.9%) were ethnic Taiwa-nese, while 11.1% were Chinese. Males nese, while 11.1% were Chinese. Males outnumbered females in the urban and outnumbered females in the urban and suburban communities.The structure of suburban communities.The structure of the aged population in Taiwan is different the aged population in Taiwan is different from that in most Western countries. from that in most Western countries. According to 1997 population statistics According to 1997 population statistics for Taiwan, there were more aged males for Taiwan, there were more aged males (8.5%) than females (7.6%). This was due (8.5%) than females (7.6%). This was due to the mass migration of Chinese soldiers to the mass migration of Chinese soldiers from mainland China to Taiwan during from mainland China to Taiwan during the civil war in the late 1940s through the the civil war in the late 1940s through the 1950s (when the Nationalist government 1950s (when the Nationalist government retreated to Taiwan after the Communists retreated to Taiwan after the Communists took over China).Many of these Chinese took over China).Many of these Chinese resided in the urban regions and were resided in the urban regions and were concentrated in government quarters for concentrated in government quarters for the armed forces, forming an ethnic± the armed forces, forming an ethnic± geographical distribution distinctive to geographical distribution distinctive to Taiwan.They represented about 30% of Taiwan.They represented about 30% of the sample studied in the selected urban the sample studied in the selected urban community.community.
Two-thirds of the subjects (66.1%) Two-thirds of the subjects (66.1%) were aged 65±74, while 27.3% were were aged 65±74, while 27.3% were between 75 and 84 years old, and only between 75 and 84 years old, and only 6.6% were of the `oldest-old' group aged 6.6% were of the `oldest-old' group aged 85 and above.Their mean age was 73.2 85 and above.Their mean age was 73.2 years (s.d.
years (s.d.6.2). There were no mean age6.2). There were no mean age differences among the three communities. differences among the three communities. Since this was a geriatric sample, one-third Since this was a geriatric sample, one-third were widows/widowers.About 90% of the were widows/widowers.About 90% of the subjects had three or more children, and the subjects had three or more children, and the majority (88.5%) were living with their majority (88.5%) were living with their fa-mily.Their educational level was generally mily.Their educational level was generally
Table 1
Table 1 Comparison between different community studies of depression in the elderlyComparison between different community studies of depression in the elderly Authors
Authors SiteSite CriteriaCriteria Prevalence (%)Prevalence (%) GMS studies GMS studies Copeland Copeland et alet al (1976)(1976) Kay Kay et alet al (1985)(1985) Copeland Copeland et alet al (1987)(1987) Lobo Lobo et alet al (1995)(1995) Kua Kua et alet al (1996)(1996) Kirby Kirby et alet al (1997)(1997) Bhatnagar & Frank (1997) Bhatnagar & Frank (1997) Newman Newman et alet al (1998)(1998) Liverpool Liverpool Hobart Hobart New York New York Zaragoza Zaragoza Singapore Singapore Dublin Dublin Bradford, UK Bradford, UK Edmonton Edmonton GMS GMS GMS GMS GMS^AGECAT GMS^AGECAT GMS^AGECAT GMS^AGECAT GMS^AGECAT GMS^AGECAT GMS^AGECAT GMS^AGECAT GMS^AGECAT GMS^AGECAT GMS^AGECAT GMS^AGECAT 11.3 11.3 16.1 16.1 16.2 16.2 4.8 4.8 6.0 6.0 10.3 10.3 20.0 20.0 11.2 11.2 Taiwan studies Taiwan studies Yeh Yeh et alet al (1994)(1994) Liu Liu et alet al (1997)(1997) Taiwan Taiwan Kinmon, Taiwan Kinmon, Taiwan
DIS: major depression, dysthymia DIS: major depression, dysthymia
DSM^III^R DSM^III^R GDS GDS 0.5 0.5 0.8 0.8 12.9 12.9 26.0 26.0
GMS,Geriatric Mental State Schedule; AGECAT, Automated Geriatric Examination for Computer Assisted Taxonomy; GMS,Geriatric Mental State Schedule; AGECAT, Automated Geriatric Examination for Computer Assisted Taxonomy; DIS, Diagnostic Interview Schedule; GDS,Geriatric Depression Scale.
low (average 3.3 years). Half of them had low (average 3.3 years). Half of them had not received any formal education, with not received any formal education, with the greater proportion in the rural and the greater proportion in the rural and semi-urban communities.Most of those semi-urban communities.Most of those with religious beliefs practised a mixture with religious beliefs practised a mixture of Buddhist and Taoist rituals.
of Buddhist and Taoist rituals.
Psychiatric and physical morbidity
Psychiatric and physical morbidity
Using the GMS±AGECAT system, the Using the GMS±AGECAT system, the 1-month prevalence rate of any psychiatric month prevalence rate of any psychiatric morbidity in this sample was found to be morbidity in this sample was found to be 37.7% (95% CI 35.1±40.3%). The 37.7% (95% CI 35.1±40.3%). The preva-lence rates of various psychiatric disorders lence rates of various psychiatric disorders were estimated as follows: depressive were estimated as follows: depressive neurosis, 15.3% (95% CI 13.4±17.3%); neurosis, 15.3% (95% CI 13.4±17.3%); organic mental disorders, 14.3% (95% CI organic mental disorders, 14.3% (95% CI 12.4±16.2%); major depression, 5.9% 12.4±16.2%); major depression, 5.9% (95% CI 4.7±7.3%); schizophrenia, 0.7% (95% CI 4.7±7.3%); schizophrenia, 0.7% (95% CI 0.4±1.4%); anxiety neurosis, (95% CI 0.4±1.4%); anxiety neurosis, 0.7% (95% CI 0.4±1.4%); 0.7% (95% CI 0.4±1.4%); hypochondria-sis, 0.5% (95% CI 0.2±1.1%); obsessive± sis, 0.5% (95% CI 0.2±1.1%); obsessive± compulsive disorder, 0.1% (95% CI 0.06± compulsive disorder, 0.1% (95% CI 0.06± 0.4%); and phobic neurosis, 0.1% (95% 0.4%); and phobic neurosis, 0.1% (95% CI 0.06±0.4%).
CI 0.06±0.4%).
The 1-month prevalence rate of The 1-month prevalence rate of de-pressive disorders (major and neurotic) pressive disorders (major and neurotic) was estimated at 21.3% (95% CI 19.1± was estimated at 21.3% (95% CI 19.1± 23.4%).
23.4%).
Among the respondents 85% had some Among the respondents 85% had some kind of physical illness.The risk of kind of physical illness.The risk of develop-ing depressive disorders among those with ing depressive disorders among those with physical illness was 3.7 times (95% CI physical illness was 3.7 times (95% CI 2.2±6.2) higher than in those without any 2.2±6.2) higher than in those without any physical problems.The physical illnesses physical problems.The physical illnesses varied, with one or more chronic illnesses varied, with one or more chronic illnesses such as cataract (29.7%), arthritis (24.4%), such as cataract (29.7%), arthritis (24.4%), hypertension (24.4%), gastro-intestinal hypertension (24.4%), gastro-intestinal dysfunction (15.6%) and coronary heart dysfunction (15.6%) and coronary heart disease (12.5%). About 1% of the disease (12.5%). About 1% of the re-spondents were severely disabled and spondents were severely disabled and were completely dependent on care by were completely dependent on care by others.
others.
Life events and depression
Life events and depression
From the year prior to the interview 995 From the year prior to the interview 995 events had been collected.Among these, events had been collected.Among these, health events (53.9%) appeared to be the health events (53.9%) appeared to be the most common and the most widely most common and the most widely experi-enced, followed by the death of someone enced, followed by the death of someone with close ties (13.5%), events connected with close ties (13.5%), events connected with relationships with children and family with relationships with children and family members (9.2%), with matters related to members (9.2%), with matters related to money or possessions (6.2%), reproduction money or possessions (6.2%), reproduction (5.6%), housing (4.7%), employment (5.6%), housing (4.7%), employment (1.6%), and legal problems (1.3%). (1.6%), and legal problems (1.3%).
Eleven out of 287 subjects with Eleven out of 287 subjects with depres-sion ± compared to 10 of 839 without any sion ± compared to 10 of 839 without any psychiatric diagnosis (non-cases) ± had psychiatric diagnosis (non-cases) ± had ex-perienced at least one markedly threatening perienced at least one markedly threatening
life event in the year prior to the interview; life event in the year prior to the interview; the odds ratio (OR) was 3.30 (95% CI the odds ratio (OR) was 3.30 (95% CI 1.38±7.86). Life events of an important 1.38±7.86). Life events of an important moderate or mildly threatening nature were moderate or mildly threatening nature were also significantly associated with also significantly associated with depres-sion; their ORs were 2.94 (95% CI 1.88± sion; their ORs were 2.94 (95% CI 1.88± 4.60) and 1.93 (95% CI 1.40±2.66), 4.60) and 1.93 (95% CI 1.40±2.66), respec-tively.Experience of general moderate tively.Experience of general moderate threatening life events (OR
threatening life events (OR1.47; 95% CI1.47; 95% CI 0.59±3.69) and events holding little 0.59±3.69) and events holding little threatthreat (OR
(OR1.23; 95% CI 0.91±1.67) were not1.23; 95% CI 0.91±1.67) were not significantly associated with depression. significantly associated with depression. When the mild events were further When the mild events were further examin-ed, a high proportion of health events were ed, a high proportion of health events were found to be in this category.This found to be in this category.This associ-ation was insignificant after the exclusion ation was insignificant after the exclusion
of all mild health events in the analysis of all mild health events in the analysis (OR
(OR1.53; 95% CI 0.94±2.52).1.53; 95% CI 0.94±2.52).
Socio-demographic factors,
Socio-demographic factors,
physical illness and depression
physical illness and depression
Tables 3 and 4 show the relationship Tables 3 and 4 show the relationship between individual socio-demographic between individual socio-demographic factors, physical illness, life events and factors, physical illness, life events and depressive disorders (major and neurotic). depressive disorders (major and neurotic). In univariate analysis (Table 3), there was In univariate analysis (Table 3), there was a significant difference in area distribution a significant difference in area distribution in depressive disorders, with the trend from in depressive disorders, with the trend from lower rates in rural and semi-urban lower rates in rural and semi-urban com-munities to a much higher rate in the urban munities to a much higher rate in the urban metropolis.A preponderance of depressive metropolis.A preponderance of depressive
Table 2
Table 2 Socio-demographic characteristics ofrespondentsSocio-demographic characteristics ofrespondents Urban Urban nn (%)(%) Rural Rural nn (%)(%) Semi-urban Semi-urban nn (%)(%) Total Total nn (%)(%) Gender Gender Male Male Female Female 212 (53.7) 212 (53.7) 183 (46.3) 183 (46.3) 267 (56.0) 267 (56.0) 210 (44.0) 210 (44.0) 194 (40.6) 194 (40.6) 284 (59.4) 284 (59.4) 673 (49.9) 673 (49.9) 677 (50.1) 677 (50.1) Age Age 65^74 65^74 75^84 75^84 5 58585 253 (64.1) 253 (64.1) 121 (30.6) 121 (30.6) 21 (5.3) 21 (5.3) 336 (70.4) 336 (70.4) 109 (22.9) 109 (22.9) 32 (6.7) 32 (6.7) 303 (63.4) 303 (63.4) 139 (29.1) 139 (29.1) 36 (7.5) 36 (7.5) 892 (66.1) 892 (66.1) 369 (27.3) 369 (27.3) 89 (6.6) 89 (6.6) Ethnicity Ethnicity Taiwanese Taiwanese Chinese Chinese 275 (69.8) 275 (69.8) 119 (30.2) 119 (30.2) 461 (97.5) 461 (97.5) 12 (2.5) 12 (2.5) 459 (96.2) 459 (96.2) 18 (3.8) 18 (3.8) 1195 (88.9) 1195 (88.9) 149 (11.1) 149 (11.1) Marital status Marital status Never married Never married Married Married Widowed Widowed Divorced Divorced 9 (2.3) 9 (2.3) 235 (59.5) 235 (59.5) 132 (33.4) 132 (33.4) 19 (4.8) 19 (4.8) 3 (0.6) 3 (0.6) 332 (70.2) 332 (70.2) 136 (28.8) 136 (28.8) 2 (0.4) 2 (0.4) 13 (2.7) 13 (2.7) 281 (58.9) 281 (58.9) 175 (36.7) 175 (36.7) 8 (1.7) 8 (1.7) 25 (1.9) 25 (1.9) 848 (63.0) 848 (63.0) 443 (32.9) 443 (32.9) 29 (2.2) 29 (2.2) Religion Religion Yes Yes No No 323 (82.4) 323 (82.4) 69 (17.6) 69 (17.6) 450 (95.3) 450 (95.3) 22 (4.7) 22 (4.7) 428 (89.7) 428 (89.7) 49 (10.3) 49 (10.3) 1201 (89.6) 1201 (89.6) 140 (10.4) 140 (10.4) Education (years) Education (years) 00 1^6 1^6 5 577 147 (37.6) 147 (37.6) 142 (36.3) 142 (36.3) 102 (26.1) 102 (26.1) 234 (49.5) 234 (49.5) 186 (39.3) 186 (39.3) 53 (11.2) 53 (11.2) 307 (64.4) 307 (64.4) 142 (29.8) 142 (29.8) 28 (5.9) 28 (5.9) 688 (51.3) 688 (51.3) 470 (35.0) 470 (35.0) 183 (13.6) 183 (13.6) Living conditions Living conditions Alone Alone With family With family 48 (12.2) 48 (12.2) 347 (87.8) 347 (87.8) 49 (10.3) 49 (10.3) 425 (89.7) 425 (89.7) 58 (12.2) 58 (12.2) 419 (87.8) 419 (87.8) 155 (11.5) 155 (11.5) 1191 (88.5) 1191 (88.5) Offspring (number) Offspring (number) 00 1^2 1^2 3^5 3^5 5 566 17 (4.3) 17 (4.3) 58 (14.7) 58 (14.7) 222 (56.3) 222 (56.3) 97 (24.6) 97 (24.6) 7 (1.5) 7 (1.5) 34 (7.2) 34 (7.2) 232 (49.0) 232 (49.0) 200 (42.3) 200 (42.3) 17 (3.6) 17 (3.6) 35 (7.3) 35 (7.3) 227 (47.6) 227 (47.6) 198 (41.5) 198 (41.5) 41 (3.1) 41 (3.1) 127 (9.4) 127 (9.4) 681 (50.7) 681 (50.7) 495 (36.8) 495 (36.8) Physical illness Physical illness Yes Yes No No 350 (88.6) 350 (88.6) 45 (11.4) 45 (11.4) 382 (81.1) 382 (81.1) 89 (18.9) 89 (18.9) 408 (85.5) 408 (85.5) 69 (14.5) 69 (14.5) 1140 (84.9) 1140 (84.9) 203 (15.1) 203 (15.1)
CHONG E T AL CHONG E T A L
disorders was also found in females, among disorders was also found in females, among widows, among those with low education, widows, among those with low education, and among the older ages (the and among the older ages (the `oldest-old') and in those with physical illness. old') and in those with physical illness.
The rates of depressive disorders were The rates of depressive disorders were 2.1 times higher in women than in men 2.1 times higher in women than in men (OR
(OR2.7; 95% CI 2.1±3.6;2.7; 95% CI 2.1±3.6; PP550.001).0.001). The risk for females as against males of The risk for females as against males of neurotic depression (138
neurotic depression (138 v.v. 69; OR69; OR2.95;2.95; 95% CI 2.14±4.07;
95% CI 2.14±4.07; PP550.001) was slightly0.001) was slightly higher than of major depression (48 higher than of major depression (48 v.v. 32;32; OR
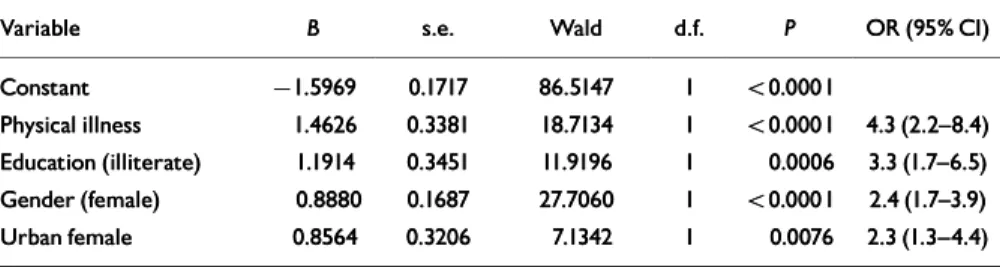
OR2.2; 95% CI 1.4±3.5;2.2; 95% CI 1.4±3.5; PP550.001).0.001). When the above significant factors were When the above significant factors were analysed for the risk of depressive disorders analysed for the risk of depressive disorders using multiple regression, it was found that using multiple regression, it was found that female gender, low education and urban female gender, low education and urban region exerted significant independent region exerted significant independent effects, while female gender and urban effects, while female gender and urban region demonstrated a significant region demonstrated a significant inter-active effect (Table 4).Age was confounded active effect (Table 4).Age was confounded by physical illness, for older ages had a by physical illness, for older ages had a higher risk of physical illness.In summary, higher risk of physical illness.In summary, a high risk of depressive disorders was a high risk of depressive disorders was typi-cally found in an urban widow with a low cally found in an urban widow with a low level of education, while those with level of education, while those with physical illness were highly vulnerable to physical illness were highly vulnerable to depression. depression.
DISCUSSION
DISCUSSION
Methodological considerations
Methodological considerations
In studying depression among the elderly in In studying depression among the elderly in the community, it is important to the community, it is important to differenti-ate between two research strdifferenti-ategies: studies ate between two research strategies: studies assessing the level of symptomatology, and assessing the level of symptomatology, and those using diagnostic algorithms.Most those using diagnostic algorithms.Most studies which assess depressed states or studies which assess depressed states or depressive symptoms are based on depressive symptoms are based on check-lists or screening instruments that are lists or screening instruments that are sensi-tive to standard criteria for diagnosis of tive to standard criteria for diagnosis of depression.However, older individuals are depression.However, older individuals are often afflicted by physical illnesses and often afflicted by physical illnesses and dis-abilities, as in this study.It is not unusual abilities, as in this study.It is not unusual for overinclusion of somatic symptoms to for overinclusion of somatic symptoms to be found if these screening instruments are be found if these screening instruments are applied.In addition, although the number applied.In addition, although the number of depressive symptoms is an indicator of of depressive symptoms is an indicator of the likelihood of depression, these results the likelihood of depression, these results are not equivalent to the diagnosis of a are not equivalent to the diagnosis of a depressive disorder.False positives are depressive disorder.False positives are likely with such a procedure, resulting in likely with such a procedure, resulting in overestimation of the `true' prevalence rate. overestimation of the `true' prevalence rate. In this study trained and experienced In this study trained and experienced senior psychiatrists conducted all senior psychiatrists conducted all assess-ments and measureassess-ments.An ments and measurements.An epidemi-ological study using trained psychiatrists ological study using trained psychiatrists to conduct interviews is costly, but it to conduct interviews is costly, but it enables the acquisition of more reliable enables the acquisition of more reliable information than lay interviewers are able information than lay interviewers are able to provide, because psychiatrists have little to provide, because psychiatrists have little
Table 3
Table 3 Relationship between socio-demographic factors, physical illness, life events and depression:Relationship between socio-demographic factors, physical illness, life events and depression: univariate analysis univariate analysis Depression Depression nn (%)(%) Non-case Non-case nn (%)(%) ww22(d.f.)(d.f.) PP Area Area 6.537 (2)6.537 (2) 550.050.05 Urban Urban Semi-urban Semi-urban Rural Rural 102 (29.9) 102 (29.9) 97 (25.4) 97 (25.4) 88 (21.7) 88 (21.7) 239 (70.1) 239 (70.1) 285 (74.6) 285 (74.6) 317 (78.3) 317 (78.3) Gender Gender 51.107 (1)51.107 (1) 550.0010.001 Male Male Female Female 101 (16.8) 101 (16.8) 186 (35.4) 186 (35.4) 501 (83.2) 501 (83.2) 340 (64.6) 340 (64.6) Age Age 11.671 (2)11.671 (2) 550.010.01 65^74 65^74 75^84 75^84 5 58585 181 (22.9) 181 (22.9) 87 (30.1) 87 (30.1) 19 (40.4) 19 (40.4) 611 (77.1) 611 (77.1) 202 (69.9) 202 (69.9) 28 (59.6) 28 (59.6) Ethnicity Ethnicity 0.155 (1)0.155 (1) NSNS Taiwanese Taiwanese Chinese Chinese 249 (25.3) 249 (25.3) 37 (26.8) 37 (26.8) 737 (74.7) 737 (74.7) 101 (73.2) 101 (73.2) Marital status Marital status 17.339 (1)17.339 (1) 550.0010.001 Married Married Widowed/other Widowed/other 160 (21.6) 160 (21.6) 126 (33.0) 126 (33.0) 582 (78.4) 582 (78.4) 256 (67.0) 256 (67.0) Religion Religion 0.262 (1)0.262 (1) NSNS Yes Yes No No 255 (25.2) 255 (25.2) 31 (27.4) 31 (27.4) 756 (74.8) 756 (74.8) 82 (72.6) 82 (72.6) Education (years) Education (years) 32.768 (2)32.768 (2) 550.0010.001 00 1^6 1^6 5 577 174 (33.3) 174 (33.3) 84 (19.8) 84 (19.8) 28 (15.9) 28 (15.9) 348 (66.7) 348 (66.7) 341 (80.2) 341 (80.2) 148 (84.1) 148 (84.1) Living conditions Living conditions 1.720 (1)1.720 (1) NSNS Alone Alone With family With family 37 (30.3) 37 (30.3) 249 (24.9) 249 (24.9) 85 (69.7) 85 (69.7) 753 (75.1) 753 (75.1) Physical illness Physical illness 27.323 (1)27.323 (1) 550.0010.001 Yes Yes No No 268 (25.4) 268 (25.4) 18 (9.9) 18 (9.9) 675 (71.6) 675 (71.6) 163 (90.1) 163 (90.1) Life events (threat)
Lif e events (threat) 14.07 (4)14.07 (4) 550.0050.005 Marked Marked Important moderate Important moderate General moderate General moderate Mild Mild Little/no Little/no 11 (5.2) 11 (5.2) 41 (19.2) 41 (19.2) 7 (3.3) 7 (3.3) 76 (35.7) 76 (35.7) 78 (36.6) 78 (36.6) 10 (2.5) 10 (2.5) 45 (11.4) 45 (11.4) 14 (3.5) 14 (3.5) 132 (33.3) 132 (33.3) 195 (49.3) 195 (49.3) Table 4
Table 4 Socio-demographic factors, physical illness and depression: multiple logistic regressionSocio-demographic factors, physical illness and depression: multiple logistic regression Variable
Variable BB s.e.s.e. WaldWald d.f.d.f. PP OR (95% CI)OR (95% CI) Constant Constant Physical illness Physical illness Education (illiterate) Education (illiterate) Gender (female) Gender (female) Urban female Urban female 7 71.59691.5969 1.4626 1.4626 1.1914 1.1914 0.8880 0.8880 0.8564 0.8564 0.1717 0.1717 0.3381 0.3381 0.3451 0.3451 0.1687 0.1687 0.3206 0.3206 86.5147 86.5147 18.7134 18.7134 11.9196 11.9196 27.7060 27.7060 7.1342 7.1342 11 11 11 11 11 5 50.00010.0001 5 50.00010.0001 0.0006 0.0006 5 50.00010.0001 0.0076 0.0076 4.3 (2.2^8.4) 4.3 (2.2^8.4) 3.3 (1.7^6.5) 3.3 (1.7^6.5) 2.4 (1.7^3.9) 2.4 (1.7^3.9) 2.3 (1.3^4.4) 2.3 (1.3^4.4)
Physical illness dichotomised as present/absent; education dichotomised as illiterate/high; region dichotomised as Physical illness dichotomised as present/absent; education dichotomised as illiterate/high; region dichotomised as urban/rural.
difficulty in distinguishing patients with difficulty in distinguishing patients with de-pression from normal subjects who have pression from normal subjects who have depressive symptoms.
depressive symptoms.
The measurement of life events was The measurement of life events was carried out by means of a comprehensive, carried out by means of a comprehensive, interview-based schedule, the LEDS±T. interview-based schedule, the LEDS±T. Because of the considerable length of the Because of the considerable length of the full and probing interview, the quality of full and probing interview, the quality of life-event information collected is of great life-event information collected is of great importance, particularly when used in a importance, particularly when used in a community epidemiological survey of community epidemiological survey of elderly people.The results show a elderly people.The results show a satis-factory interrater reliability of threat rating, factory interrater reliability of threat rating, a short mean range of uncertainty and a short mean range of uncertainty and limited fall-off.
limited fall-off.
High response rates were found in this High response rates were found in this study, especially in the semi-urban and study, especially in the semi-urban and rural communities.The importance of a rural communities.The importance of a sound response rate in any epidemiological sound response rate in any epidemiological study has long been stressed.Similarly high study has long been stressed.Similarly high response rates were also noticed in response rates were also noticed in epidemio-logical surveys of other types of psychiatric logical surveys of other types of psychiatric morbidity in the community in Taiwan morbidity in the community in Taiwan (Cheng, 1987; Chong, 1992).They were (Cheng, 1987; Chong, 1992).They were accounted for by the close collaboration accounted for by the close collaboration of various professions, particularly public of various professions, particularly public nurses and local community officers.With nurses and local community officers.With their assistance and thanks to their frequent their assistance and thanks to their frequent communication with the subjects and their communication with the subjects and their families, high response rates were able to families, high response rates were able to be achieved.Besides, because interviews be achieved.Besides, because interviews were conducted at temples that also served were conducted at temples that also served as community centres in some villages, as community centres in some villages, subjects were more likely to cooperate and subjects were more likely to cooperate and provide reliable information.
provide reliable information.
Prevalence studies
Prevalence studies
A high prevalence rate of depression in old A high prevalence rate of depression in old age was found in this study, which age was found in this study, which contra-dicted the findings of most previous studies dicted the findings of most previous studies in Taiwan (Table 1) and other Oriental in Taiwan (Table 1) and other Oriental countries (Komahashi
countries (Komahashi et alet al, 1994; Kua, 1994; Kua etet al
al, 1996), where lower rates have long been, 1996), where lower rates have long been emphasised.Comparison with these studies emphasised.Comparison with these studies is difficult, because of differences in is difficult, because of differences in research methodology, diagnostic criteria research methodology, diagnostic criteria and instruments used.
and instruments used.
In general, significantly lower rates of In general, significantly lower rates of depression were found in a study employing depression were found in a study employing lay interviewers to collect information lay interviewers to collect information using the Diagnostic Interview Schedule using the Diagnostic Interview Schedule (DIS) (Yeh
(DIS) (Yeh et alet al, 1994).The DIS is based, 1994).The DIS is based on the criteria of DSM±III (American on the criteria of DSM±III (American Psy-chiatric Association, 1980), which require chiatric Association, 1980), which require high specificity.This is appropriate for high specificity.This is appropriate for bio-logical research but not suitable in a logical research but not suitable in a com-munity survey where high sensitivity is munity survey where high sensitivity is needed to identify cases for treatment.This needed to identify cases for treatment.This being so, it is not surprising that studies being so, it is not surprising that studies
using the DIS in community surveys using the DIS in community surveys gener-ally demonstrated consistently lower rates ally demonstrated consistently lower rates than most studies with other standardised than most studies with other standardised instruments.
instruments.
When comparing different studies using When comparing different studies using the GMS, it was found that the prevalence the GMS, it was found that the prevalence rate of depression in old age in this study rate of depression in old age in this study is comparable to that recorded in a recent is comparable to that recorded in a recent report on migrants from the Indian report on migrants from the Indian sub-continent living in Bradford, UK continent living in Bradford, UK (Bhatna-gar & Frank, 1997), but higher than those gar & Frank, 1997), but higher than those reported from Liverpool (Copeland reported from Liverpool (Copeland et alet al,, 1976), Dublin (Kirby
1976), Dublin (Kirby et alet al, 1997) and other, 1997) and other European (Beekman
European (Beekman et alet al, 1999) and most, 1999) and most Asian studies.Moreover, the prevalence Asian studies.Moreover, the prevalence rate of depression in old age is three times rate of depression in old age is three times higher than that reported from Singapore higher than that reported from Singapore (Kua
(Kua et alet al, 1996), a community composed, 1996), a community composed predominantly of ethnic Chinese.There predominantly of ethnic Chinese.There were, however, great differences in rates were, however, great differences in rates of suicide between Singapore and Taiwan, of suicide between Singapore and Taiwan, with a higher rate as well as a trend of with a higher rate as well as a trend of high-er suicidal risk with age in Taiwan (Kok & er suicidal risk with age in Taiwan (Kok & Tseng, 1992; Chong & Cheng, 1995).The Tseng, 1992; Chong & Cheng, 1995).The high rate of depression in this study is also high rate of depression in this study is also comparable to that shown in a recent study comparable to that shown in a recent study using the Geriatric Depression Scale (Brink using the Geriatric Depression Scale (Brink et al
et al, 1982) in Kimen, an island just off the, 1982) in Kimen, an island just off the coast of mainland China, which is coast of mainland China, which is popu-lated by Chinese (Liu
lated by Chinese (Liu et alet al, 1997)., 1997).
Socio-demographic correlates
Socio-demographic correlates
of depression
of depression
Gender GenderDepressive symptomatology in late life is Depressive symptomatology in late life is usually found to be more prevalent among usually found to be more prevalent among women than men.This gender difference women than men.This gender difference has also been established in most general has also been established in most general population surveys (Cheng, 1989) and population surveys (Cheng, 1989) and clin-ical settings.The excess rate had been ical settings.The excess rate had been accounted for by the finding that women accounted for by the finding that women were more likely to detect and report were more likely to detect and report depressive symptoms than men.These depressive symptoms than men.These symptoms are more frequently observed in symptoms are more frequently observed in a clinical setting, where it is culturally and a clinical setting, where it is culturally and logically more acceptable to express distress logically more acceptable to express distress in somatic form.In this study, experienced in somatic form.In this study, experienced psychiatrists carried out all the assessments, psychiatrists carried out all the assessments, and for them it was not difficult to and for them it was not difficult to differ-entiate a functional symptom from one entiate a functional symptom from one denoting physical illness.On the other denoting physical illness.On the other hand, most subjects were able to express hand, most subjects were able to express their distress eloquently in colloquial their distress eloquently in colloquial Taiwanese terms, such as
Taiwanese terms, such as kan-korkan-kor (emo- (emo-tional distress),
tional distress), ul-juitul-juit (depression) or(depression) or fun- fun-low
low (upset).The risks of depressive dis-(upset).The risks of depressive dis-orders in this study, leaving aside the orders in this study, leaving aside the bene-fits of better reporting or detection, were, fits of better reporting or detection, were,
however, twice as high in women than in however, twice as high in women than in men.A similar gender ratio distribution men.A similar gender ratio distribution was also seen in other surveys of minor was also seen in other surveys of minor psy-chiatric morbidity in Taiwan (Cheng, 1987; chiatric morbidity in Taiwan (Cheng, 1987; Chong, 1992).
Chong, 1992).
Marital status Marital status
The relation of marital status to depression The relation of marital status to depression among elderly people is less controversial. among elderly people is less controversial. It is generally believed that depression It is generally believed that depression associated with widowhood is probably associated with widowhood is probably due to the bereavement.In addition, due to the bereavement.In addition, loneli-ness, one of the depressive manifestations, ness, one of the depressive manifestations, is commonly seen in elderly people is commonly seen in elderly people regard-less of their marital status.
less of their marital status.
Education and social environment Education and social environment
A high risk of depression was found among A high risk of depression was found among the elderly of a lower educational level. the elderly of a lower educational level. Education is one of the general criteria in Education is one of the general criteria in the assessment of socio-economic status, the assessment of socio-economic status, besides job and income.The educational besides job and income.The educational level of the subjects in this study sample level of the subjects in this study sample was generally low, with more than half was generally low, with more than half being illiterate.Their low level of education being illiterate.Their low level of education was accounted for by the unpopularity of was accounted for by the unpopularity of formal education during their childhood, a formal education during their childhood, a time when China was war-torn and when time when China was war-torn and when Taiwan was under Japanese control Taiwan was under Japanese control (1895±1945).It is well established that (1895±1945).It is well established that low socio-economic status is frequently low socio-economic status is frequently associated with poor health, a condition associated with poor health, a condition related to depression.
related to depression.
Despite the vast social and economic Despite the vast social and economic transformation that has taken place in transformation that has taken place in Tai-wan in recent decades, social welfare for wan in recent decades, social welfare for the elderly is still inadequate and far below the elderly is still inadequate and far below that in most industrialised countries.Many that in most industrialised countries.Many of the elderly are looked after by family of the elderly are looked after by family members, predominantly sons, who take members, predominantly sons, who take their share in turn.Taking care of the their share in turn.Taking care of the elderly has become a burden for poor elderly has become a burden for poor families, who are generally of a low families, who are generally of a low educa-tional level.In the urban community, where tional level.In the urban community, where a higher risk of depression was found, a higher risk of depression was found, limitations in the number of rooms and limitations in the number of rooms and restrictions on movement for the elderly restrictions on movement for the elderly were noticed.By contrast, in the rural were noticed.By contrast, in the rural areas, healthy old couples were seen living areas, healthy old couples were seen living together, in their own house and on their together, in their own house and on their own land, carrying out light farm work. own land, carrying out light farm work. Communication with their children was Communication with their children was maintained by telephone.Thus the support maintained by telephone.Thus the support and daily activities as well as the mental and daily activities as well as the mental health of elderly people in the rural health of elderly people in the rural com-munity are extended.
CHONG E T AL CHONG E T A L
Physical morbidity and other life
Physical morbidity and other life
events
events
Health difficulties exhibited the highest Health difficulties exhibited the highest risk for depressive disorders in this risk for depressive disorders in this cross-sectional study ± more than any other sectional study ± more than any other single socio-demographic factor.The single socio-demographic factor.The majority of the incidences of physical majority of the incidences of physical morbidity in this sample were chronic morbidity in this sample were chronic ill-nesses.Having a health problem is in itself nesses.Having a health problem is in itself stressful.It may lead to disability and stressful.It may lead to disability and impairment, which contribute to the onset impairment, which contribute to the onset and continuance of late-life depression and continuance of late-life depression (Henderson
(Henderson et alet al, 1997; Prince, 1997; Prince et alet al,, 1998).This finding is compatible with 1998).This finding is compatible with those of other community studies, where those of other community studies, where poor health and disability accounted for poor health and disability accounted for 35% of the total variance in depression 35% of the total variance in depression and outranked demographic, social support and outranked demographic, social support and life events (Kennedy
and life events (Kennedy et alet al, 1989).High, 1989).High physical morbidity in this sample might physical morbidity in this sample might contribute to the high rates of depression, contribute to the high rates of depression, which most previous studies in Taiwan which most previous studies in Taiwan did not address.
did not address.
Health problems, difficulties in Health problems, difficulties in rela-tionships and financial problems were the tionships and financial problems were the three main stressful life events.Similar three main stressful life events.Similar find-ings were also noted in a survey in another ings were also noted in a survey in another Chinese community (Boey & Chi, 1998). Chinese community (Boey & Chi, 1998). Relationship problems, particularly those Relationship problems, particularly those regarding children or daughters-in-law, regarding children or daughters-in-law, are significant in the Chinese are significant in the Chinese family.Finan-cial difficulty is very much correlated with cial difficulty is very much correlated with the quality of life.During the period of the quality of life.During the period of the study, some local governments in the study, some local governments in Taiwan, including those of the communities Taiwan, including those of the communities from which our study samples were drawn, from which our study samples were drawn, initiated monthly subsidiary benefits for the initiated monthly subsidiary benefits for the elderly.These benefits, despite their elderly.These benefits, despite their rela-tively small amounts, were substantially tively small amounts, were substantially significant for those in need.Support from significant for those in need.Support from both the family and community are thus both the family and community are thus essential for the mental health of the essential for the mental health of the elderly.
elderly.
ACKNOWLEDGEMENTS
ACKNOWLEDGEMENTS
The authors thank Professor Anthony Mann of the The authors thank Professor Anthony Mann of the Institute of Psychiatry, London, Professor Tsung-Yi Institute of Psychiatry, London, Professor Tsung-Yi Lin of the University of British Columbia, Canada, Lin of the University of British Columbia, Canada, and Professor Andrew Cheng of the Institute of and Professor Andrew Cheng of the Institute of Biomedical Sciences, Academia Sinica, Taiwan, for Biomedical Sciences, Academia Sinica, Taiwan, for their invaluable advice and supervision. We are their invaluable advice and supervision. We are obliged to the public health nurses and local officers obliged to the public health nurses and local officers who helped to locate subjects in this study, and who helped to locate subjects in this study, and most of all, we are grateful to all the respondents most of all, we are grateful to all the respondents and their families for their cooperation and for and their families for their cooperation and for making this study a success. The study was making this study a success. The study was conducted under a grant from the National Health conducted under a grant from the National Health Research Institute, Taiwan (85-CNT-MD-501P; Research Institute, Taiwan (85-CNT-MD-501P; DDO1-861X-MD501P).
DDO1-861X-MD501P).
REFERENCES
REFERENCES
American Psychiatric Association
American Psychiatric Association (1980)(1980)DiagnosticDiagnostic and Statistical Manual of Mental Disorders
and Statistical Manual of Mental Disorders (3rd edn)(3rd edn) (DSM^III).Washington, DC: APA.
(DSM^III).Washington, DC: APA.
Beekman, A. T. F., Copeland, J. R. M. & Prince, M. J. Beekman, A. T. F., Copeland, J. R. M. & Prince, M. J. (1999)
(1999)Review of community prevalence of depression inReview of community prevalence of depression in later life.
later life. British Journal of PsychiatryBritish Journal of Psychiatry,, 174174, 307^311., 30 7^311.
Bhatnagar, K. & Frank, J.
Bhatnagar, K. & Frank, J. (1997)(1997)Psychiatric disordersPsychiatric disorders in elderly from the Indian sub-continent living in in elderly from the Indian sub-continent living in Bradford.
Bradford. International Journal of Geriatric PsychiatryInternational Journal of Geriatric Psychiatry,, 1212,, 907^912.
907^912.
Boey, K.W. & Chi, I.
Boey, K.W. & Chi, I. (1998)(1998)A study of life events andA study of life events and psychological well-being of the older adults in Hong psychological well-being of the older adults in Hong Kong.
Kong. Journal of Clinical GeropsychologyJournal of Clinical Geropsychology,, 44, 55^64., 55^64.
Brink, T. L.,Yesavage, J. A., Lum, O.,
Brink, T. L.,Yesavage, J. A., Lum, O., et alet al (1982)(1982)
Screening tests for geriatric depression. Screening tests for geriatric depression. ClinicalClinical Gerontologist
Gerontologist,, 11, 37^43., 37^43.
Brown, G.W. & Harris, T. O.
Brown, G.W. & Harris, T. O. (1978)(1978)Social Origins ofSocial Origins of Depression: A Study of Psychiatric Disorder in Women. Depression: A Study of Psychiatric Disorder in Women. London: Routledge.
London: Routledge.
Cheng, T. A.
Cheng, T. A. (1987)(1987)A Community Study of MinorA Community Study of Minor Psychiatric Morbidity inTaiwan
Psychiatric Morbidity inTaiwan. PhD thesis,University of. PhD thesis,University of London.
London.
_
_ (1989)(1989)Sex differences in prevalence of minorSex differences in prevalence of minor
psychiatric morbidity: A social epidemiological study in psychiatric morbidity: A social epidemiological study in Taiwan.
Taiwan. Acta Psychiatrica ScandinavicaActa Psychiatrica Scandinavica,, 8080, 395^407., 395^407.
_
_ (1995)(1995)Mental illness and suicide.Mental illness and suicide. Archives of GeneralArchives of General
Psychiatry
Psychiatry,, 5252, 594^60 3., 594^603.
Chong, M.Y.
Chong, M.Y. (1992)(1992)The Six-year Follow-up Study ofThe Six-year Follow-up Study of Minor Psychiatric Morbidity in the Community inTaiwan. Minor Psychiatric Morbidity in the Community inTaiwan. PhD thesis,University of London.
PhD thesis,University of London.
_
_ & Cheng, T. A.& Cheng, T. A. (1995)(1995)Suicidal behaviour observedSuicidal behaviour observed
inTaiwan:Trends over four decades. In
inTaiwan:Trends over four decades. In Chinese SocietyChinese Society and Mental Health
and Mental Health (edsT.Y. Lin,W. S.Teng & E.K.Yeh),(edsT.Y. Lin,W. S.Teng & E.K.Yeh), pp. 209^218. Hong Kong: Oxford University Press. pp. 209^218. Hong Kong: Oxford University Press.
Copeland, J. R. M., Kelleher, M. J., Kellett, J. M., Copeland, J. R. M., Kelleher, M. J., Kellett, J. M., et alet al (1976)
(1976)A semi-structured clinical interview for theA semi-structured clinical interview for the assessment of diagnosis and mental state in the elderly: assessment of diagnosis and mental state in the elderly: The Geriatric Mental State Schedule. I. Development The Geriatric Mental State Schedule. I. Development and reliability.
and reliability. Psychological MedicinePsychological Medicine,, 66, 439^449., 439^449.
_
_ , Dewey, M. E. & Griffiths-Jones, H. M. (1 986), Dewey, M. E. & Griffiths-Jones, H. M.(1986)
Computerized psychiatric diagnostic system and case Computerized psychiatric diagnostic system and case nomenclature for elderly subjects: GMS and AGECAT. nomenclature for elderly subjects: GMS and AGECAT. Psychological Medicine
Psychological Medicine,, 1616, 89^99., 89^99.
_
_ ,,__ ,Wood, N.,,Wood, N., et alet al (1987)(1987)Range of mental illnessRange of mental illness
among the elderly in the community. Prevalence in among the elderly in the community. Prevalence in Liverpool using the GMS^AGECAT package. Liverpool using the GMS^AGECAT package. BritishBritish Journal of Psychiatry
Journal of Psychiatry,, 150150, 815^823., 815^823.
_
_ , Beekman, A. T. F., Dewey, M. E., et al, Beekman, A. T. F., Dewey, M. E.,et al (1999)(1999)
Depression in Europe.Geographical distribution among Depression in Europe.Geographical distribution among older people.
older people. British Journal of PsychiatryBritish Journal of Psychiatry,, 174174, 312^321., 312^321.
Dewey, M. E. & Copeland, J. R. M. Dewey, M. E. & Copeland, J. R. M. (1986)(1986)
Computerized psychiatric diagnosis in the elderly: Computerized psychiatric diagnosis in the elderly: AGECAT.
AGECAT. Journal of Microcomputer ApplicationsJournal of Microcomputer Applications,, 99,, 135^140.
135^140.
Henderson, A. S., Korten, A. E., Jacomb, P. A., Henderson, A. S., Korten, A. E., Jacomb, P. A., et alet al (1997)
(1997)The course of depression in the elderly: aThe course of depression in the elderly: a longitudinal community-based study in Australia. longitudinal community-based study in Australia. Psychological Medicine
Psychological Medicine,, 2727, 119^129.,119^129.
Kay, D.W. K., Henderson, A. S., Scorr, R.,
Kay, D.W. K., Henderson, A. S., Scorr, R., et alet al (1985)(1985)
Dementia and depression among the elderly living in the Dementia and depression among the elderly living in the Hobart community: the effect of diagnostic criteria on Hobart community: the effect of diagnostic criteria on CLINICAL IMPLICATIONS
CLINICAL IMPLICATIONS &
& The prevalence rate ofdepressive disorders among the elderly inTaiwan is as highThe prevalence rate ofdepressive disorders among the elderly inTaiwan is as high
as rates reported in the West. as rates reported in the West.
&
& Health problems were the main stressful life events experienced by the elderly.Health problems were the main stressful life events experienced by the elderly. &
& Being female, a widow, with low education and physical morbidity gave high risksBeing female, a widow, with low education and physical morbidity gave high risks
for depression in the elderly. for depression in the elderly.
LIMITATIONS LIMITATIONS &
& Prevalence ofsub-threshold depression was not addressed.Prevalence ofsub-threshold depression was not addressed. &
& Organic brain disorders with depression were excluded in the analysis.Organic brain disorders with depression were excluded in the analysis. &
& No further cross-comparison among different studies was attempted.No further cross-comparison among different studies was attempted.
MIAN-YOON CHONG, MRCPsych,HIN-YEUNG TSANG,MD,CHENG-SHEN CHEN,MD,TZE-CHUN TANG, MIAN-YOON CHONG,MRCPsych,HIN-YEUNG TSANG, MD,CHENG-SHEN CHEN, MD,TZE-CHUN TANG, MD, Department of Psychiatry,Kaohsiung Medical University,Kaohsiung,Taiwan; CHWEN-CHENG CHEN, MD, Department of Psychiatry,Kaohsiung Medical University,Kaohsiung,Taiwan; CHWEN-CHENG CHEN, MRCPsych,TZUNG-LIEH YEH, MD,YI-HUI LEE, MD, HSIN-YI LO, MD, Department of Psychiatry, National MRCPsych,TZUNG-LIEH YEH, MD,YI-HUI LEE, MD, HSIN-YI LO, MD, Department of Psychiatry, National Cheng Kung University,Tainan,Taiwan
Cheng Kung University,Tainan,Taiwan
Correspondence: Dr Mian-Yoon Chong, Associate Professor and Director, Department of Psychiatry, Correspondence: Dr Mian-Yoon Chong, Associate Professor and Director,Department of Psychiatry, Kaohsiung Medical University,100 Shih-Chuan First Road,Kaohsiung 807,Taiwan.Tel: 886 7 3208219; Kaohsiung Medical University,100 Shih-Chuan First Road,Kaohsiung 807,Taiwan.Tel: 886 7 3208219; fax: 886 7 3112492; e-mail: mchong
fax: 886 7 3112492; e-mail: mchong@@cc.kmu.edu.twcc.kmu.edu.tw
(First received 4 November 1999, final revision 25 April 20 0 0 , accepted 19 June 20 0 0 ) (First received 4 November 1999, final revision 25 April 2000, accepted 19 June 2000)
the prevalence rates.
the prevalence rates. Psychological MedicinePsychological Medicine,, 1515,, 771^778.
771^778.
Kennedy, G. J., Kelman, H. R., Thomas, C., Kennedy, G. J., Kelman, H. R.,Thomas, C., et alet al (1989)
(1989)Hierarchy of characteristics associated withHierarchy of characteristics associated with depressive symptoms in an urban elderly sample. depressive symptoms in an urban elderly sample. American Journal of Psychiatry
American Journal of Psychiatry,, 22, 220^225., 220^225.
Kirby, M., Bruce, I., Radic, A.,
Kirby, M., Bruce, I., Radic, A., et alet al (1997)(1997)MentalMental disorders among the community-dwelling elderly in disorders among the community-dwelling elderly in Dublin.
Dublin. British Journal of PsychiatryBritish Journal of Psychiatry,, 171171, 369^372., 369^372.
Kok, L. P. & Tseng,W. S.
Kok, L. P. & Tseng,W. S. (1992)(1992)Suicidal Behaviour in theSuicidal Behaviour in the Asia-Pacific Region.
Asia-Pacific Region. Singapore: Singapore UniversitySingapore: Singapore University Press.
Press.
Komahashi, M., Ohmori, K. & Nakano, T. Komahashi, M., Ohmori, K. & Nakano,T. (1994)(1994)
Epidemiological survey of dementia and depression Epidemiological survey of dementia and depression
among the aged living in the community in Japan. among the aged living in the community in Japan. Japanese Journal of Psychiatry and Neurology
Japanese Journal of Psychiatry and Neurology,, 4848, 517^526., 517^526.
Kua, E. H., Ko, S. M., Fones, S. L. C.,
Kua, E. H., Ko, S. M., Fones, S. L. C., et alet al (1996)(1996)
Comorbidity of depression in the elderly ^ an Comorbidity of depression in the elderly ^ an epidemiological study in a Chinese community. epidemiological study in a Chinese community. International Journal of Geriatric Psychiatry
International Journal of Geriatric Psychiatry,, 1111, 699^70 4., 699^704.
Liu, C.Y.,Wang, S. J., Teng, E. L.,
Liu, C.Y.,Wang, S. J., Teng, E. L., et alet al (1997)(1997)
Depressive disorders among older residents in a Depressive disorders among older residents in a Chinese rural community.
Chinese rural community. Psychological MedicinePsychological Medicine,, 2727,, 943^949.
943^949.
Lobo, A., Saz, P., Marcos, G., Dia, J-L.,
Lobo, A., Saz, P., Marcos, G., Dia, J-L., et alet al (1995)(1995)
The prevalence of dementia and depression in the The prevalence of dementia and depression in the elderly community in a southern European population: elderly community in a southern European population: the Zaragoza study.
the Zaragoza study. Archives of General PsychiatryArchives of General Psychiatry,, 5252,, 497^506.
497^506.
Newman, S. C., Sheldon, C.T. & Bland, R. C. Newman, S. C., Sheldon, C. T. & Bland, R. C. (1998)(1998)
Prevalence of depression in an elderly community Prevalence of depression in an elderly community sample: a comparison of GMS^AGECATand DSM^IV sample: a comparison of GMS^AGECATand DSM^IV diagnostic criteria.
diagnostic criteria. Psychological MedicinePsychological Medicine,, 2828,1339^1345.,1339^1345.
Prince, M. J., Harwood, R. H., Thomas, A., Prince, M. J., Harwood, R. H., Thomas, A., et alet al (1998)
(1998)A prospective population-based cohort study ofA prospective population-based cohort study of the effects of disablement and social milieu on the onset the effects of disablement and social milieu on the onset and maintenance of late-life depression.The Gospel Oak and maintenance of late-life depression.The Gospel Oak Project VII.
Project VII. Psychological MedicinePsychological Medicine,, 2828, 337^350., 337^350.
Yeh, E. K., Hwu, H. K., Chang, L.Y.,
Yeh, E. K., Hwu, H. K., Chang, L.Y., et alet al (1994)(1994)
Mental disorders and cognitive impairment among the Mental disorders and cognitive impairment among the elderly community population inTaiwan. In
elderly community population inTaiwan. In Principles andPrinciples and Practice of Geriatric Psychiatry
Practice of Geriatric Psychiatry (eds J. R. M.Copeland,(eds J. R. M.Copeland, M.T. Abou-Saleh & D.G. Blazer), pp. 865^871. London: M.T. Abou-Saleh & D.G. Blazer), pp. 865^871. London: John Wiley & Sons.