行政院國家科學委員會專題研究計畫 期中進度報告
淡水河系河口感潮段水理、水質及生態系統模擬之研究(2/3)
計畫類別: 個別型計畫 計畫編號: NSC91-2211-E-002-067-執行期間: 91 年 08 月 01 日至 92 年 07 月 31 日 執行單位: 國立臺灣大學生物環境系統工程學系暨研究所 計畫主持人: 許銘熙 共同主持人: 柳文成,吳俊宗,黃將修 報告類型: 精簡報告 處理方式: 本計畫可公開查詢中
華
民
國 92 年 5 月 28 日
淡水河系河口感潮段水理、水質及生態系統模擬之研究(2/3)
九十一年度計畫期中
報告
國科會計畫編號:NSC 91-2211-E-002-067
(民國 91 年 8 月至 92 年 5 月)
執行單位:國立臺灣大學生物環境系統工程學系
中華民國九十一年五月三十一日
淡水河系河口感潮段水理、水質及生態系統模擬之研究(二)
Simu la t ion of H yd r od yn a mics, W a t er Q u a lit y a n d
E cologica l Syst em in t h e T id a l Da n sh u ei R iver Syst em (I I )
參與工作人員
主 持 人:許銘熙
國立 臺灣大 學生物 環境 系統工 程
系教授兼主任
客座教授:郭義雄
國立 臺灣大 學生物 環境 系統工 程
系客座教授
協同研究人員:柳文成
國 立 臺 灣 大 學 水 工 試 驗 所 技 士
(博士)、中央大學水文科學研究所
兼任助理教授
吳俊宗
中央 研究院 植物研 究所 研究員 、
國立臺灣大學植物研究所教授
黃將修
國立海洋大學海洋生物研究所
教授
兼任研究生助理:王琪芳
國立 臺灣大 學生物 環境 系統工 程
研究所博士班研究生
吳啟瑞
國立 臺灣大 學生物 環境 系統工 程
研究所博士班研究生
陳書怡
國立 臺灣大 學生物 環境 系統工 程
研究所碩士班研究生
劉欣宜
國立 臺灣大 學生物 環境 系統工 程
研究所碩士班研究生
吳政翰
國立海洋大學海洋生物研究所
研究生
謝智偉
國立海洋大學海洋生物研究所
研究生
目錄
頁次
摘要
ii
A. 淡水河系海水入侵變遷之論文稿
-1-B. PACON 2003 之摘要
-2-C. 現場觀測採樣與分析
(1)物理數據
(2)浮游動物數據
(3)浮游藻類與營養鹽
-37-D. 生態模式之測試
-38-摘要
本 研 究 計 畫 自 九十 年 八 月 一 日 開 始 執 行 , 預 定 執 行 期 間 為 三 年 , 第 一 年 度 完 成 之 工 作 包 括: (1)淡 水 河 系 海 水 入 侵 變 遷 之 研 究;(2)模 式 河 川 斷 面 資 料 之 更 新 與 模 式 之 重 新 驗 證 ;(3)兩次現場觀 測採樣與數 據之分析;(4)生態模式之 撰寫 與 偵 錯 。 以 上 工 作 成 果 已 於 第 一 年 之 成 果 報 告 中 詳 加 說 明 。 第 二 年 之 工 作 於 九 十 一 年 八 月 一 日啟 動 , 至 目 前 為 止 , 已 完 成 之 工 作 有 下 列 諸 項 , 加 以 說 明 如 下 :A. 完 成 「 Modeling Salt Water Intrusion in Tanshui River Estuarine System: A Contrast Between Now and Then」 為 題 之 論 文 , 投 稿 至 Journal of Hydraulic Engineering, ASCE。
B. 撰 寫 四 篇 英 文 摘 要 , 將 發 表 於 PACON (Pacific Congress of Marine Science and Technology) 2003, June 30-July 2, 2003, Kaoshuong, Taiwan.
(1) Toward the simulation of Ecological System in the Danshuei River Estuary.
(2) Water Column Light Attenuation in the Danshuei River Estuary. (3) Modeling Water Quality Control for Fish Survival in the Tidal
Hsintien Stream.
(4) Zooplankton Abundance and Distribution in the Danshuei Estuary and Adjacent waters.
C. 現 場 觀 測 採 樣 與 分 析 分 別於 民 國 九 十 一 年 十 月十 五 日 及 九 十 二 年 五月 六 日 完 成 兩 次 全 潮 觀 測 採 樣 。 D. 生 態 模 式 之 測 試 第 一年 撰 寫 之 生 態 模 式 ,經 偵 錯 完 成 後 , 以 虛擬 河 川 作 為 模 式 之 測 試, 證 實 模 式 無 誤 , 演算 結 果 合 理 , 又 以 淡水 河 實 際 資 料 測 試 ,結 果 良 好 。
A. 淡 水河系海水入侵變遷之論文稿
鹽分濃度為感潮河川中最重要之環境參數,它的長期變化對水體中之生態 結構有決定性之影響, 淡 水 河 數 十 年 來 , 因 環 境 之 改 變 , 已 引 起 海 水 入 侵 之 增 強 , 其 中 人 為 因 素 , 包 括 石 門 、 翡 翠 兩 座 水 庫 之 興 建 而 產 生 長 期 流 量 之 減 少 、 河 床 高 程 變 化 等 。 已 利 用 數 值 模 擬 , 對 此 等 因 素 所 引 起 之 海 水 入 侵 程 度 加 以 探 討 , 撰 寫 論 文 一 篇 , 投 稿 至 Journal of Hydraulic Engineering, ASCE, 以 下 僅 附 該 論 文 之 摘 要。Modeling Salt Water Intr usion in Tanshui River Estuar ine System-
A Contr ast between Now and Then
Wen-Cheng Liu1
, Ming-Hsi Hsu2,*, Chi-Ray Wu3
,
Chi-Fang Wang3, and Albert Y. Kuo4, Member, ASCE
Abstr act : A vertical (laterally integrated) two-dimensional numerical model was applied to study the salt water intrusion in the Tanshui River estuarine system, Taiwan. The river system has experienced dramatic changes in the past half century because of human interference. The construction of two reservoirs and water diversion in the upper reaches of the river system significantly reduces the freshwater inflow. The land subsidence within the Taipei basin and the enlargement of the river constriction at Kuan-Du lower the river bed. Both changes contribute to the farther intrusion of tidal flow and salt water in upriver direction. The model reverification was conducted with the earliest available hydrographic data measured in 1977. The overall performance of the model is in reasonable agreement with the field data. The model was then used to investigate the change in salt water intrusion as the result of reservoir construction and bathymetric changes in the river system. The model simulation study reveals that significant salinity increase has resulted from the changes combined. It is believed that the long-term increase in salinity is the driving force altering the aquatic ecosystem structure in the lower reach of the estuary and the Kuan-Du mangrove swamp, particularly the enlargement of the mangrove area and the disappearance of freshwater marshes.
Keywords: Salt water intrusion; Tanshui River system; Numerical model; Kuan-Du mangrove swamp; Reservoir construction; Bathymetric change. 1
Senior Research Engineer, Hydrotech Research Institute, National Taiwan University, No. 158 Chow-Shan Road, Taipei 10617, Taiwan. E-mail: [email protected]
2
Professor and Director, Department of Bioenvironmental Systems Engineering, National Taiwan University, Taipei 10617, Taiwan.
3
Doctoral Student, Department of Bioenvironmental Systems Engineering, National Taiwan University, Taipei 10617, Taiwan.
Taipei 10617, Taiwan. *
Corresponding author. E-mail: [email protected]
B. P AC O N 2003 之摘要
PACON (Pacific Congress of Marine Science and Technology) 2003 研討會將 於民國 92 年 6 月 30 日至 7 月 2 日在高雄舉行,由台灣主辦,本計畫團隊總共投 稿四篇論文摘要,全部將由研究生以英文發表,藉機訓練學生參與學術成果發表 會之能力,以下付列此三篇論文摘要。
Towar d the Simulation of Ecological System in the
Danshuei River Estuar y
Chi-Fang Wang1, Ming-Hsi Hsu1, Jiang-Shiou Hwang2, Jiunn-Tzong Wu3, Wen-Cheng Liu4, and Albert Y. Kuo1
1
Department of Bioenvironmental Systems Engineering National Taiwan University, Taipei, Taiwan
2
Institute of Marine Biology, National Taiwan Ocean University, Keelung, Taiwan
3
Institute of Botany, Academia Sinica, Taipei, Taiwan
4
Hydrotech Research Institute, National Taiwan University, Taipei, Taiwan ABSTRACT
The Danshuei River system is the largest estuary in Taiwan. To get a better understanding of the ecological system in the Danshuei River, a multi-disciplinary study including the physical transport processes, nutrient dynamics, primary production, and the zooplankton population is being carried out. In this study, a calibrated and validated two-dimensional hydrodynamic model is used and expanded to simulate the interactions between physical, chemical, and biological factors in the estuary.
To make the model more realistic, there should be field data to accompany the development of the numerical model. Two slackwater surveys and one intensive survey have been conducted to collect simultaneous data of physical properties, nutrient concentrations, and phytoplankton and zooplankton populations at predetermined stations along the axis of the lower reach of the estuary. The physical properties measured include salinity, temperature, total suspended sediment concentrations, and PAR (photosynthetically active radiation). Concentrations of various forms or species of nitrogen, phosphorus, silica, phytoplankton, and zooplankton were also analyzed.
zooplankton, copepod and others. The formulations of the relations between the ecological state variables are constructed through literature reference. The calibrated and validated two-dimensional hydrodynamic model has been expanded to include nutrient dynamics, phytoplankton growth and the zooplankton predation. With the field data, and the appropriate values of parameters and rate coefficients, the numerical model may properly simulate the ecological system in the Danshuei River Estuary.
Water Column Light Attenuation in the Danshuei River Estuar y
Shu-Yi Chen1 Chi-Ray Wu1 Ming-Hsi Hsu1 Wen-Cheng Liu2 Albert Y. Kuo1
1
Department of Bioenvironmental Systems Engineering, National Taiwan University, Taipei, Taiwan
Phone: 886-2-2369-8508-ext.721 E-mail: [email protected]
2
Hydrotech Research Institute, National Taiwan University, Taipei, Taiwan ABSTRACT
The penetration of sunlight into the water column plays a critical role in the aquatic ecosystem of a water body. Insufficient light is often the principal limiting factor for primary production in many turbid estuaries. The Danshuei River is the largest estuarine system in Taiwan. This study investigates the light attenuation through the water column of the Danshuei River estuary and explores the models for quantifying it. The light penetration into water column is measured by two methods, the Secchi-depth measurement and the measurement of PAR (Photosynthetically Active Radiation). The PAR measurements indicate that the conventional exponential attenuation of light with depth is a very good model. A light attenuation coefficient may be derived from the PAR measurements at each of the stations. The simpler measurements of Secchi-depth provide an approximate estimate of the attenuation coefficients through inverse linear relationship.
Light attenuation through water column is controlled by the amount and kinds of materials dissolved and suspended in the water. A model often used in predictive water quality and ecosystem modeling is to assume that the light attenuation due to dissolved matter is relatively constant and include it with water itself, and that the contributions due to chlorophyll and suspended particles are proportional to their concentrations. However, the linear regression with such a model results in very poor correlation, and relatively large constant term in most cases. The regression with salinity yield much better correlation, indicating that the fraction of sea water might be a good parameter for estimating light attenuation coefficient for practical
application in the Danshuei River.
Key Words: light attenuation coefficient, model, estuaries.
Modeling Water Quality Contr ol for Fish Sur vival
in the Tidal Hsintien Str eam
Shin-Yi Liu1 Wen-Cheng Liu2 Albert Y. Kuo1 and Ming-Hsi Hsu1
1
Department of Bioenvironmental Systems Engineering, National Taiwan University, Taipei, Taiwan
2
Hydrotech Research Institute, National Taiwan University, Taipei, Taiwan ABSTRACT
The Hsintien Stream is one of the major branches of the Danshuei River system, which is the largest estuary in Taiwan. It runs through the metropolitan capital city of Taipei and receives large amount of wastewater. The dissolved oxygen is generally low in the tidal portion of the Hsintien Stream. Hypoxia/anoxia occurs often, particularly during the low flow period when the Feitsui reservoir impounds the freshwater for municipal water supply. Fish kills happen from time to time.
The purpose of this study is to develop and apply numerical hydrodynamic and water quality model for the Danshuei River, with special attention on the Hsintien Stream. The model is calibrated with the prototype conditions of year 2000. Daily freshwater discharges are specified as the upstream boundary conditions at the three major branches. Hourly tidal heights are derived from field data at the river mouth for the downstream boundary conditions. The hydrodynamic portion of the model has been recalibrated with measured surface elevation and velocity at various stations in the river system. The water quality portion of the model requires the input data of point and nonpoint sources as well as the boundary conditions of the concentrations of various forms of nutrients, CBOD and dissolved oxygen. The model is being calibrated with respect to the field data provided by Taiwan EPA.
Through this study, we may understand the dissolved oxygen dynamics in the Hsintien Stream, apply the model to develop the appropriate strategy to make sure the dissolved oxygen level suitable for fish survival, and propose effective methods to improve the general water quality of the Hsintien Stream.
Zooplankton Abundance and Distr ibution in the Danshuei Estuar y
and Adjacent Water s
Jiang-Shiou Hwang, Chih-Wei Hsieh
Institute of Marine Biology, National Taiwan Ocean University, Keelung 202, Taiwan, ROC
ABSTRACT
The Danshuei River is the most important estuarine ecosystem in northern Taiwan. Huge amount of derived substances and wastewater from Taipei city and county are discharged into the Danshuei ecosystem daily. The transportation process and the terminal destination of derived substances and wastewater are influential on zooplankton abundance and distribution in this ecosystem. However, relatively few studies of zooplankton were carried out in this important ecosystem. The purpose of this study was to investigate zooplankton abundance and distribution in the Danshuei estuary and adjacent waters. Zooplankton was sampled in 5 stations along the Danshuei river from fresh waters to the river mouth. The abundance, distribution, grazing rate, carbon and nitrogen contents of zooplankton were investigated in 5 stations. The results showed that copepods usually were the most dominant composition of zooplankton with high station variations in terms of abundance and distribution. The chlorophyll a contents in the gut of Copepods were relatively low indicating low grazing rate on phytoplankton. However, the C/N of copepods was relatively constant e.g 7. in the Danshuei ecosystem. Occasionally, the barnacle larvae became dominant in the Danshuei ecosystem. Nonetheless, it appeared that the discharge of wastewater from Taipei city and county has great impact on the distribution and abundance of zooplankton in the ecosystem of Danshuei.
C . 現場觀測採樣與分析
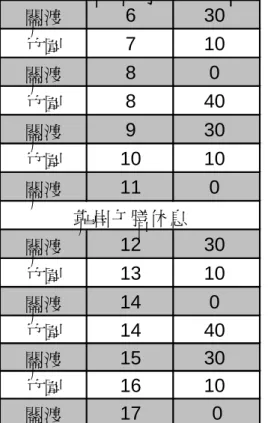
本計畫第二年預定作兩次全潮之觀測、採樣與與分析,第一次原於九十一 年九月二十五日執行,但是執行一半時,天氣驟變,下起傾盆大雨,持久不停, 只得放棄。復於十月十五日執行,配合計畫協同主持人吳俊宗教授之另一計畫, 同步觀測與採樣,量測物理、化學與生物等方面之數據。又春季之觀測採樣工作 原定於九十二年四月二十四日執行,因颱風之威脅,乃改於五月六日執行。兩次 全潮觀測採樣之測站與時間如附表 C-1-1 與 C-1-2 所載。以下附列九十一年九月 及十月觀測採樣所得之數據,九十二年五月之樣本尚在分析中。 (1) 物理數據 物理性質之數據,包括鹽分濃度、溫度、懸浮顆粒濃度與光度等,量測所得 數據以下列諸圖展示,九十一年十月十五日之鹽分分佈圖顯示當日水體分層現象 非常明顯,當日為陰曆九月十日,屬小潮(neap tide),潮汐混合力較弱,除高潮 時段外,整個水柱由水面至水底分層厲害,低潮時在關渡站之垂直鹽度差有 14 ppt 之多,竹圍站水深較淺,垂直鹽度差亦有 8 ppt ,皆屬強分層(strong stratification)型水體,在高潮時段,則因海水大量入侵,將淡水頂托水面,僅最 上面約兩公尺之水層有明顯分層現象,兩公尺以下呈均勻水體。又數據顯示,鹽 度隨潮時之變化甚巨,以中層水估計,高潮時鹽度可高於低潮時鹽度 10 ppt 左右。 懸浮顆粒(TSS)濃度則不高,尤其表層水之濃度皆在 10mg / 左右,估計它l 們對光度衰減係數的影響約 1.0/m 左右,約為觀測所得數據的 2/3 至 1/2 之間。 高懸浮顆粒僅存在於河水深處,在關渡站發生於高潮時段,在竹圍站則發生於低 潮時段,可能有一高濃度的水團在兩者之間隨潮流來回移動。 光線隨水深之變化則顯示呈指數函數(exponential function)隨水深遞減,相關 係數( 2 R )大都在 0.9 以上,詳細分析見 B 部分之第二篇摘要。表 C-1-1 民國九十一年十月十五日全潮觀測採樣時間表
潮汐表
潮高(公尺) 潮類 0 31 1.46 L 6 8 2.56 H 12 38 0.95 L 19 23 2.9 H預測各站高低平潮時間
河口 6 26 19 41 13 8 竹圍 6 31 19 46 13 16 關渡 6 35 19 50 13 23 重陽橋 6 38 19 53 13 35 士林焚化爐 6 44 19 59 13 34預計抵達各站時間(預估操作時間30分鐘)
關渡 6 30 竹圍 7 10 關渡 8 0 竹圍 8 40 關渡 9 30 竹圍 10 10 關渡 11 0 關渡 12 30 竹圍 13 10 關渡 14 0 竹圍 14 40 關渡 15 30 竹圍 16 10 關渡 17 0 SBF(時 分) 靠岸午膳休息民國91年10月15日(二)農曆9月10日
潮時(時 分)淡水(121
o24'E, 25
o11'N)
SBE(時 分)表 C-1-2 民國九十二年五月六日全潮觀測採樣時間表
潮汐表
潮高(公尺) 潮類 1 33 3 H 7 42 1.26 L 13 16 2.71 H 19 41 0.61 L預測各站高低平潮時間
河口 13 34 7 51 20 16 竹圍 13 39 7 59 20 24 關渡 13 43 8 6 20 31 重陽橋 13 46 8 17 20 43 士林焚化爐 13 52 8 17 20 42預計抵達各站時間(預估操作時間30分鐘)
關渡 6 30 竹圍 7 10 關渡 8 0 竹圍 8 40 關渡 9 30 竹圍 10 10 關渡 11 0 關渡 12 30 竹圍 13 10 關渡 14 0 竹圍 14 40 關渡 15 30 竹圍 16 10 關渡 17 0 SBE(時 分) SBF(時 分) 靠岸午膳休息民國92年5月6日(二)農曆4月6日
潮時(時 分)淡水(121
o24'E, 25
o11'N)
6 7 8 9 10 11 12 13 14 15 16 17 18 -14 -12 -10 -8 -6 -4 -2 0 D e p th (m ) 14.6 26.6 27.1 27.7 27.7 28.4 15.4 20.4 25.8 26.2 26.3 27.4 13.2 14.3 19.0 20.7 21.8 23.0 11.7 14.5 14.1 16.0 19.4 9.5 11.2 14.8 20.3 22.2 22.9 8.0 12.0 22.1 22.4 23.5 25.0 10.7 14.8 18.0 18.3 23.4 15.1 17.9 18.8 20.2 22.6 Salinity(ppt) 6 7 8 9 10 11 12 13 14 15 16 17 18 -14 -12 -10 -8 -6 -4 -2 0 D e p th (m ) 7.5 16.4 31.0 34.5 30.8 73.2 9.6 9.2 22.0 29.6 27.2 32.8 6.4 6.4 8.8 24.4 30.0 29.2 6.8 13.5 7.2 7.6 10.8 16.4 17.2 14.4 12.4 16.9 19.2 8.4 14.4 7.2 12.0 18.0 25.2 12.0 8.0 8.8 11.2 17.2 21.2 7.2 7.6 10.0 10.8 20.8 46.8 TSS (mg/L) 6 7 8 9 10 11 12 13 14 15 16 17 18 -14 -12 -10 -8 -6 -4 -2 0 6 7 8 9 10 11 12 13 14 15 16 17 18 Time (hr) -14 -12 -10 -8 -6 -4 -2 0 D e p th (m ) 26.7 26.7 26.8 26.8 26.8 26.8 26.6 26.6 26.7 26.7 26.8 26.8 27.2 26.9 26.8 26.8 26.8 26.8 28.0 27.4 27.2 27.2 27.0 26.9 28.0 27.6 27.6 27.1 26.9 26.9 26.8 26.8 26.8 28.4 28.1 27.4 27.0 26.9 26.9 26.8 28.6 27.6 27.4 27.2 26.9 26.8 26.8 28.3 28.3 27.8 27.5 27.2 27.2 26.9 26.8 Water Temperature(oC) 圖 C-1-1 關渡測站鹽分濃度、懸浮顆粒濃度及水溫(九十一年十月十五日)
6 7 8 9 10 11 12 13 14 15 16 17 18 -5 -4 -3 -2 -1 0 1 D e p th (m ) 19.7 28.4 31.2 32.1 18.6 27.8 29.5 30.2 13.0 25.0 27.2 28.5 13.8 16.9 20.8 25.7 15.1 17.2 20.4 22.8 20.2 23.1 23.6 24.0 6 7 8 9 10 11 12 13 14 15 16 17 18 -5 -4 -3 -2 -1 0 1 Salinity(ppt) 6 7 8 9 10 11 12 13 14 15 16 17 18 Time (hr) -5 -4 -3 -2 -1 0 1 D e p th (m ) 5.6 7.0 8.0 12.0 6.0 12.8 7.6 9.2 9.2 15.2 15.6 16.0 9.6 7.2 12.8 16.4 9.2 7.6 11.2 13.2 10.8 11.2 18.8 34.8 TSS (mg/L) 6 7 8 9 10 11 12 13 14 15 16 17 18 Time (hr) -5 -4 -3 -2 -1 0 1 D e p th (m ) 26.0 26.5 26.5 26.6 26.8 26.7 26.7 26.7 26.7 27.7 26.9 26.7 28.4 27.5 27.0 26.8 28.1 27.9 27.3 27.1 27.1 28.1 27.7 27.5 27.5 27.5 Water Temperature(oC) 圖 C-1-2 竹圍測站鹽分濃度、懸浮顆粒濃度及水溫(九十一年十月十五日)
關渡--06:40 I = 8.6019e-1.8268z R2 = 0.9445 0 1 2 3 4 5 6 7 8 9 10 0 0.2 0.4 0.6 0.8 1 1.2 1.4 1.6 1.8 2 水深 (m) 光度 關渡--08:00 I = 64.246e-1.3031z R2 = 0.9965 0 10 20 30 40 50 60 70 80 0 0.2 0.4 0.6 0.8 1 1.2 1.4 1.6 1.8 2 水深 (m) 光度
關渡--09:20 I = 99.982e-1.316z R2 = 0.9867 0 20 40 60 80 100 120 0 0.2 0.4 0.6 0.8 1 1.2 1.4 1.6 1.8 2 水深 (m) 光度 關渡--11:00 I = 54.789e-1.2785z R2 = 0.8836 0 10 20 30 40 50 60 0 0.2 0.4 0.6 0.8 1 1.2 1.4 1.6 1.8 2 水深 (m) 光度
關渡--12:30 I = 43.815e-1.8193z R2 = 0.966 0 10 20 30 40 50 60 70 80 90 100 0 0.5 1 1.5 2 2.5 3 水深 (m) 光度 關渡--13:50 I = 90.058e-1.8798z R2 = 0.9855 0 10 20 30 40 50 60 70 80 90 100 0 0.5 1 1.5 2 2.5 水深 (m) 光度
關渡--15:20 I = 65.266e-2.5475z R2 = 0.9305 0 10 20 30 40 50 60 70 0 0.2 0.4 0.6 0.8 1 1.2 1.4 1.6 1.8 2 水深 (m) 光度 關渡--16:40 I = 6.6086e-1.743z R2 = 0.9403 0 1 2 3 4 5 6 7 8 0 0.5 1 1.5 2 2.5 3 水深 (m) 光度
竹圍--07:20 I = 33.764e-0.9712z R2 = 0.9937 0 5 10 15 20 25 30 35 40 0 0.2 0.4 0.6 0.8 1 1.2 1.4 1.6 1.8 2 水深 (m) 光度 竹圍--08:40 I = 117.42e-1.5281z R2 = 0.9869 0 20 40 60 80 100 120 140 0 0.2 0.4 0.6 0.8 1 1.2 1.4 1.6 1.8 2 水深 (m) 光度
竹圍--10:00 I = 121.6e-1.5781z R2 = 0.9874 0 20 40 60 80 100 120 140 0 0.2 0.4 0.6 0.8 1 1.2 1.4 1.6 1.8 2 水深 (m) 光度 竹圍--13:10 I = 81.954e-1.4184z R2 = 0.996 0 10 20 30 40 50 60 70 80 90 0 0.2 0.4 0.6 0.8 1 1.2 1.4 1.6 1.8 2 水深 (m) 光度
竹圍--14:30 I = 86.982e-1.6856z R2 = 0.9917 0 10 20 30 40 50 60 70 80 90 100 0 0.2 0.4 0.6 0.8 1 1.2 1.4 1.6 1.8 2 水深 (m) 光度 竹圍--16:00 I = 21.951e-1.4954z R2 = 0.998 0 5 10 15 20 25 0 0.5 1 1.5 2 2.5 水深 (m) 光度
7 8 9 10 11 12 13 14 15 -14 -12 -10 -8 -6 -4 -2 0 2 D e p th (m ) 7.1 12.8 15.5 15.6 18.0 20.1 11.7 13.0 13.5 14.3 14.8 20.4 21.4 21.2 21.7 21.9 25.7 27.4 28.3 29.2 29.7 18.2 26.3 31.5 31.8 32.2 32.6 Salinity(ppt) 7 8 9 10 11 12 13 14 15 -14 -12 -10 -8 -6 -4 -2 0 2 D e p th (m ) 21.6 22.4 19.2 17.6 17.6 30.4 14.8 13.2 16.0 12.4 12.4 22.0 31.2 33.6 33.2 34.0 27.2 39.6 31.6 36.4 46.0 21.2 24.8 33.2 37.6 24.8 33.2 TSS(mg/L) 27.1 26.9 26.8 26.8 26.8 26.8 26.8 26.8 26.8 26.8 28.1 27.1 26.9 26.8 26.8 26.7 26.7 26.8 26.8 26.9 26.8 26.8 26.8 26.7 26.7 26.7 27.5 27.0 26.9 26.8 26.8 26.8 26.8 26.8 26.9 26.9 26.9 26.9 26.9 26.9 26.9 26.9 26.9 Water Temperature(oC) 7 8 9 10 11 12 13 14 15 Time (hr) -14 -12 -10 -8 -6 -4 -2 0 2 D e p th (m )
7 8 9 10 11 12 13 14 15 -8 -6 -4 -2 0 2 D e p th (m ) 14.1 15.2 16.9 20.7 24.7 26.6 26.9 27.2 33.4 33.3 33.4 33.4 33.4 Salinity(ppt) 7 8 9 10 11 12 13 14 15 -8 -6 -4 -2 0 2 D e p th (m ) 21.6 21.2 13.6 18.0 12.0 20.4 19.6 30.4 12.5 39.6 16.5 31.2 35.6 TSS(mg/L) 27.1 26.8 26.8 26.8 26.8 26.8 27.6 26.8 26.7 26.7 26.7 26.8 27.4 27.2 27.1 27.1 27.1 27.1 7 8 9 10 11 12 13 14 15 Time (hr) -8 -6 -4 -2 0 2 D e p th (m ) Water Temperature(oC) 圖 C-1-4 竹圍測站鹽分濃度、懸浮顆粒濃度及水溫(九十一年九月二十五日)
7:30竹圍 I = 19.484e-1.4572z R2 = 0.9538 0 5 10 15 20 25 0 0.2 0.4 0.6 0.8 1 1.2 1.4 1.6 1.8 2 水深 (m) 光度 8:35關渡 I = 95.559e-2.4566z R2 = 0.9488 0 10 20 30 40 50 60 70 80 0 0.2 0.4 0.6 0.8 1 1.2 1.4 1.6 1.8 2 水深 (m) 光度
9:40關渡 I = 23.616e-1.6892z R2 = 0.9695 0 5 10 15 20 25 30 0 0.2 0.4 0.6 0.8 1 1.2 1.4 1.6 1.8 2 水深 (m) 光度 10:30竹圍 I = 12.764e-1.4624z R2 = 0.9721 0 2 4 6 8 10 12 14 0 0.2 0.4 0.6 0.8 1 1.2 1.4 1.6 1.8 2 水深 (m) 光度
11:15關渡 I = 17.49e-1.6545z R2 = 0.9798 0 5 10 15 20 25 0 0.2 0.4 0.6 0.8 1 1.2 1.4 1.6 1.8 2 水深 (m) 光度 11:55竹圍 I = 38.504e-1.4155z R2 = 0.9925 0 5 10 15 20 25 30 35 40 45 0 0.2 0.4 0.6 0.8 1 1.2 1.4 1.6 1.8 2 水深 (m) 光度
12:30關渡 I = 29.444e-2.4206z R2 = 0.9779 0 10 20 30 40 50 60 0 0.2 0.4 0.6 0.8 1 1.2 1.4 1.6 1.8 2 水深(m) 光度 13:55關渡 I = 0.6927e-0.8377z R2 = 0.3547 0 0.2 0.4 0.6 0.8 1 1.2 1.4 1.6 1.8 2 0 0.2 0.4 0.6 0.8 1 1.2 1.4 1.6 1.8 2 水深 (m) 光度
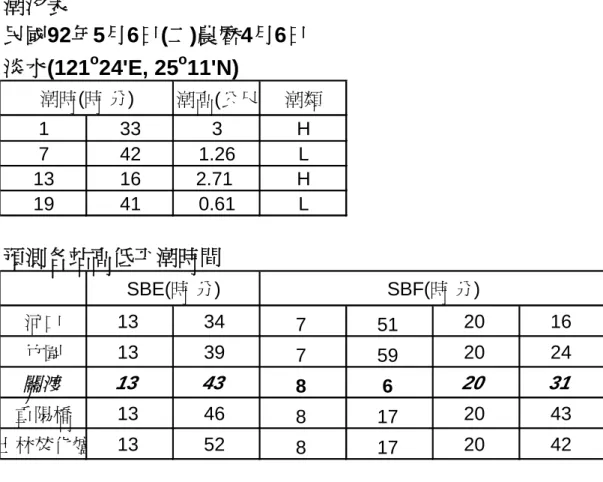
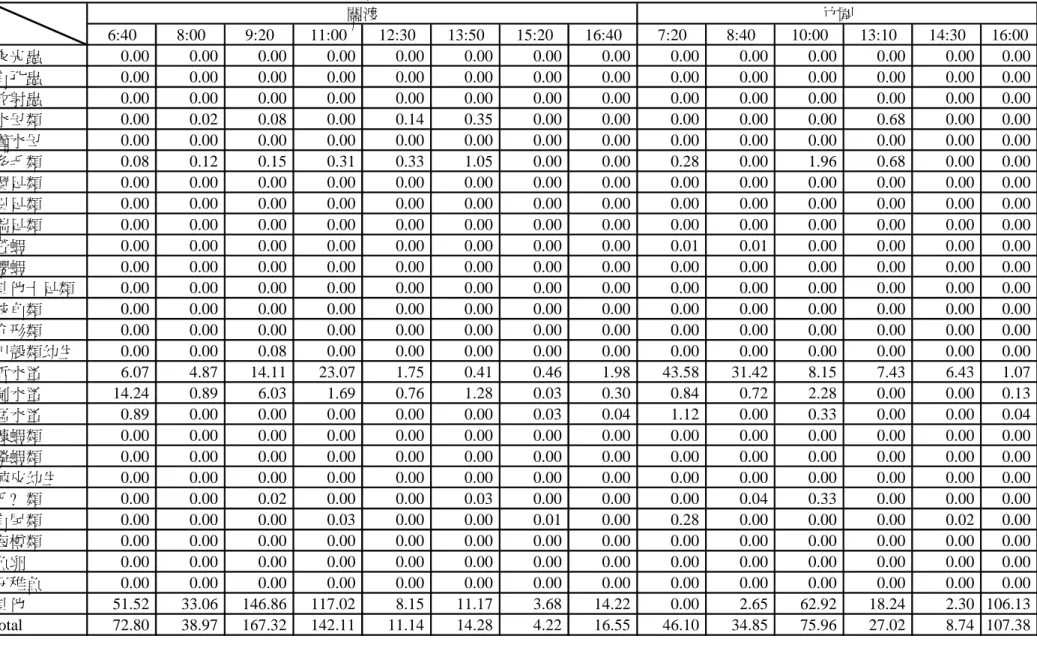
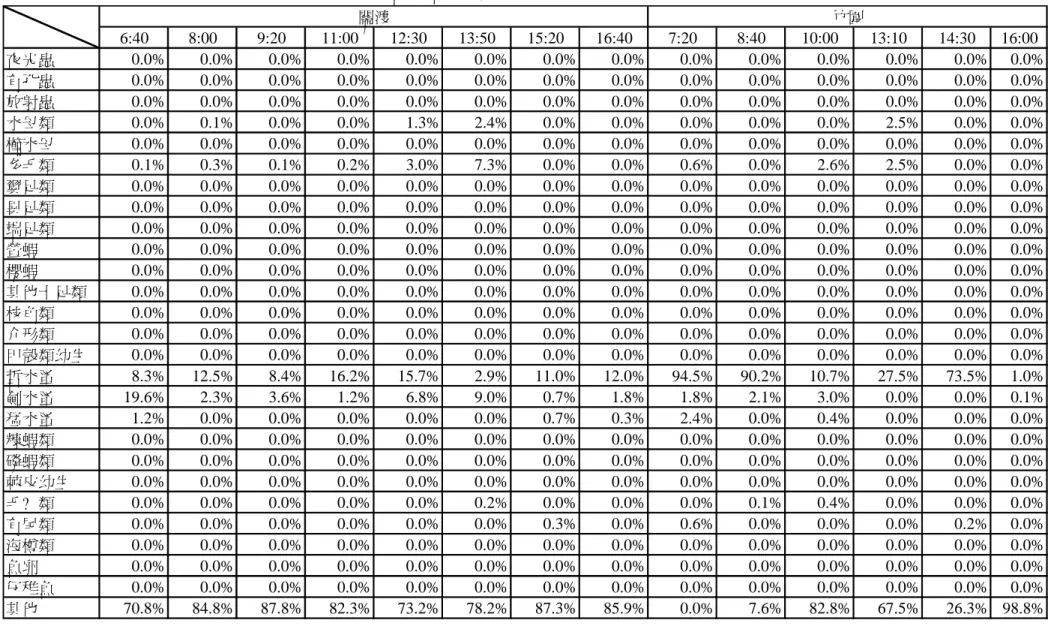
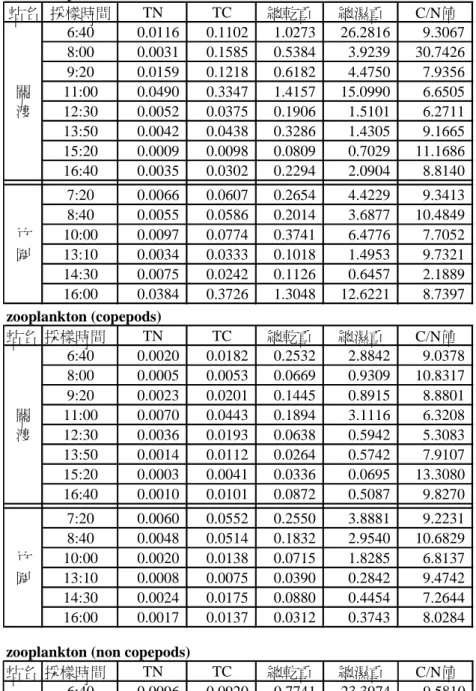
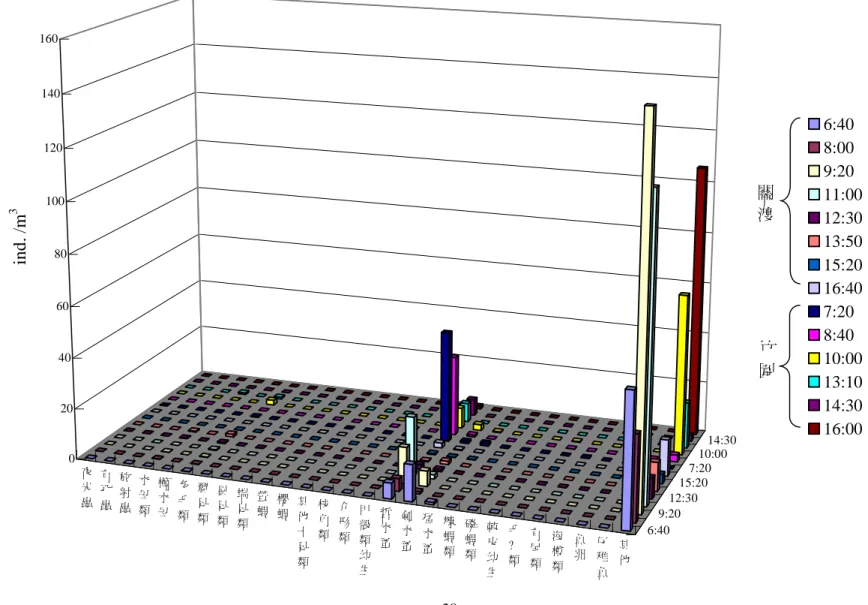
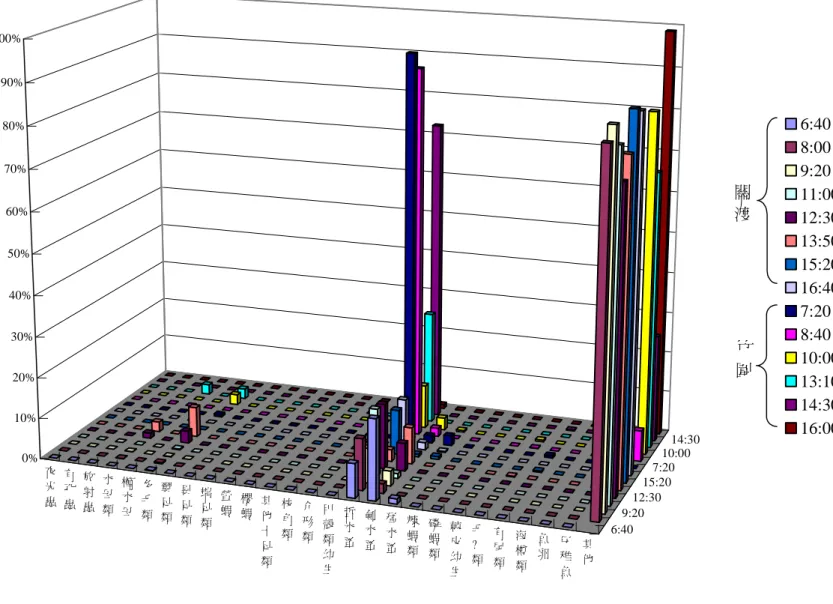
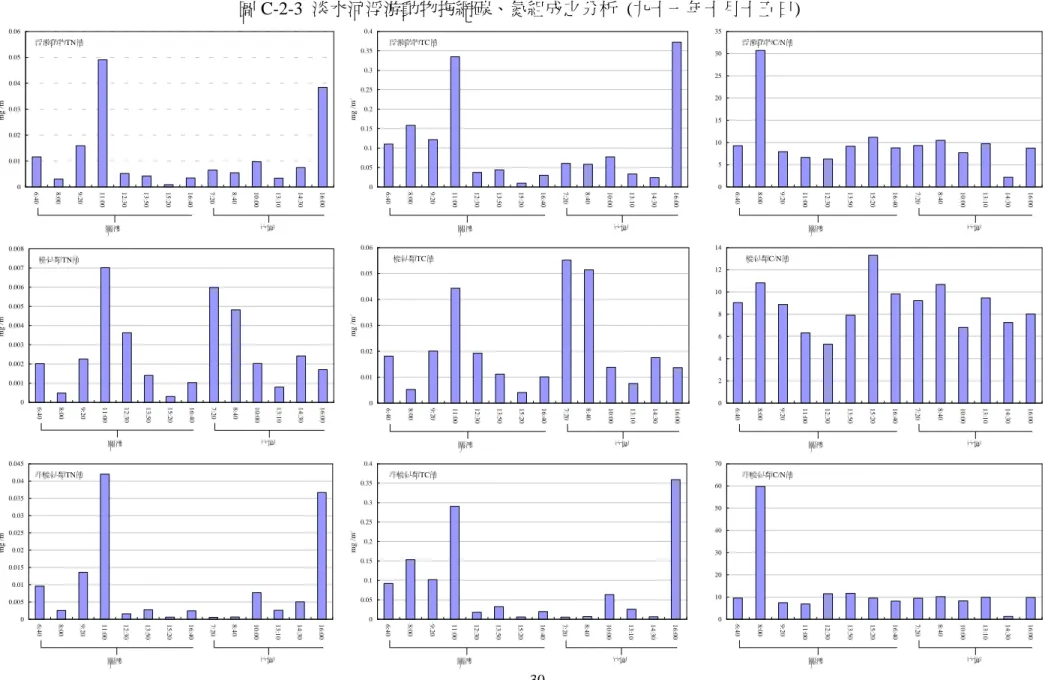
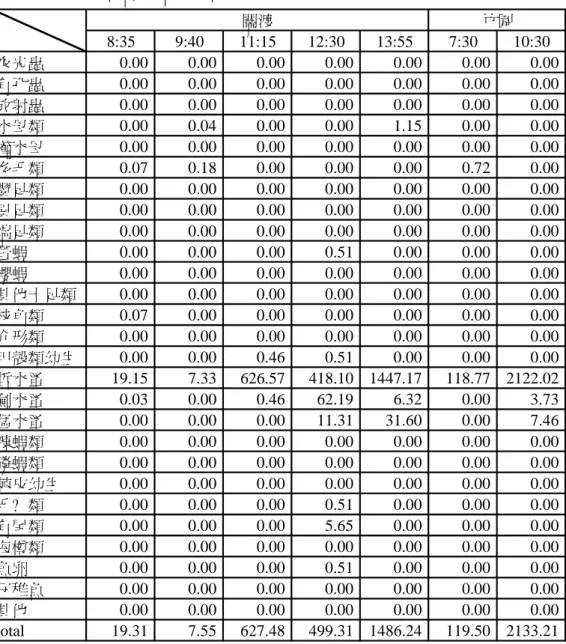
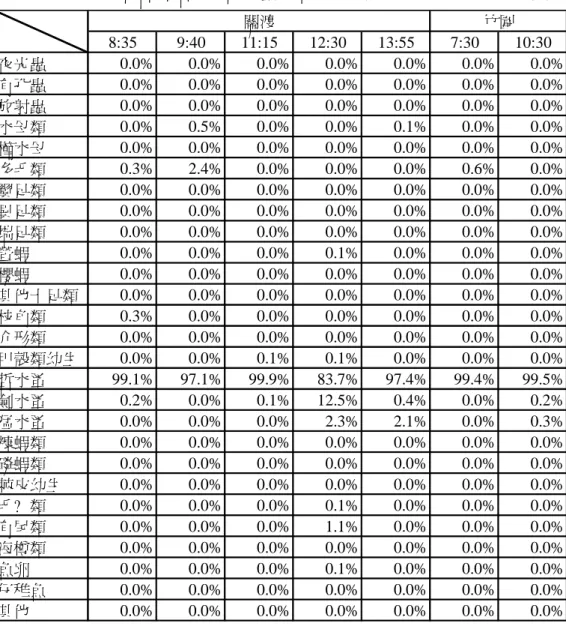
(2) 浮游動物數據 浮游動物樣本以 200µ之拖網採集,因採集所需時間較長,約 30 至 40 分鐘, 故每個測站只能採取接近水面之樣本。 (a)九十一年十月十五日之數據 表 C-2-1 與表 C-2-2 分列各類浮游動物在每一單位水體中之個數及個數百分 比,圖 C-2-1 與圖 C-2-2 則將此數據以圖形展示,除高潮時段在竹圍站所採得之 樣本以外,皆有大量之「其他」類浮游動物存在,經鑑定,此乃藤壺類之幼體, 因其存在只限於偶有之繁殖期,且懸浮於水體中之時間短暫,故對整個食物鏈不 重要,把它們扣除後仍以橈足類佔優勢。又表 C-2-3 和圖 C-2-3,列示單位水體 中的質量,並將橈足類及非橈足類之浮游動物的質量濃度分別單獨表示,其中碳 的濃度將為模擬時代表生物質量(Biomass)的變數,此次觀測所得,最高濃度 0.37 3 /m mg (橈足類及非橈足類的總和),為歷次觀測所得最低。 (b)九十一年九月二十五日之數據 本次採樣只取得一部份之數據,分列於表 C-2-4 至 C-2-6 與圖 C-2-4 至 C-2-6 中。如表 C-2-5 所示,在每一個測站,皆以橈足類佔絕對優勢,最高達 99 %。 又單位水體中浮游動物含碳量有高達 4.5 3 /m mg 者,應是一組較好的數據,然 因天候因素而未能完成全潮採樣,甚為可惜。
表 C-2-1 淡水河各測站浮游動物組成 ( 3 / . m Ind ,九十一年十月十五日) 6:40 8:00 9:20 11:00 12:30 13:50 15:20 16:40 7:20 8:40 10:00 13:10 14:30 16:00 夜光蟲 0.00 0.00 0.00 0.00 0.00 0.00 0.00 0.00 0.00 0.00 0.00 0.00 0.00 0.00 有孔蟲 0.00 0.00 0.00 0.00 0.00 0.00 0.00 0.00 0.00 0.00 0.00 0.00 0.00 0.00 放射蟲 0.00 0.00 0.00 0.00 0.00 0.00 0.00 0.00 0.00 0.00 0.00 0.00 0.00 0.00 水母類 0.00 0.02 0.08 0.00 0.14 0.35 0.00 0.00 0.00 0.00 0.00 0.68 0.00 0.00 櫛水母 0.00 0.00 0.00 0.00 0.00 0.00 0.00 0.00 0.00 0.00 0.00 0.00 0.00 0.00 多毛類 0.08 0.12 0.15 0.31 0.33 1.05 0.00 0.00 0.28 0.00 1.96 0.68 0.00 0.00 翼足類 0.00 0.00 0.00 0.00 0.00 0.00 0.00 0.00 0.00 0.00 0.00 0.00 0.00 0.00 異足類 0.00 0.00 0.00 0.00 0.00 0.00 0.00 0.00 0.00 0.00 0.00 0.00 0.00 0.00 端足類 0.00 0.00 0.00 0.00 0.00 0.00 0.00 0.00 0.00 0.00 0.00 0.00 0.00 0.00 螢蝦 0.00 0.00 0.00 0.00 0.00 0.00 0.00 0.00 0.01 0.01 0.00 0.00 0.00 0.00 櫻蝦 0.00 0.00 0.00 0.00 0.00 0.00 0.00 0.00 0.00 0.00 0.00 0.00 0.00 0.00 其他十足類 0.00 0.00 0.00 0.00 0.00 0.00 0.00 0.00 0.00 0.00 0.00 0.00 0.00 0.00 枝角類 0.00 0.00 0.00 0.00 0.00 0.00 0.00 0.00 0.00 0.00 0.00 0.00 0.00 0.00 介形類 0.00 0.00 0.00 0.00 0.00 0.00 0.00 0.00 0.00 0.00 0.00 0.00 0.00 0.00 甲殼類幼生 0.00 0.00 0.08 0.00 0.00 0.00 0.00 0.00 0.00 0.00 0.00 0.00 0.00 0.00 哲水蚤 6.07 4.87 14.11 23.07 1.75 0.41 0.46 1.98 43.58 31.42 8.15 7.43 6.43 1.07 劍水蚤 14.24 0.89 6.03 1.69 0.76 1.28 0.03 0.30 0.84 0.72 2.28 0.00 0.00 0.13 猛水蚤 0.89 0.00 0.00 0.00 0.00 0.00 0.03 0.04 1.12 0.00 0.33 0.00 0.00 0.04 糠蝦類 0.00 0.00 0.00 0.00 0.00 0.00 0.00 0.00 0.00 0.00 0.00 0.00 0.00 0.00 磷蝦類 0.00 0.00 0.00 0.00 0.00 0.00 0.00 0.00 0.00 0.00 0.00 0.00 0.00 0.00 棘皮幼生 0.00 0.00 0.00 0.00 0.00 0.00 0.00 0.00 0.00 0.00 0.00 0.00 0.00 0.00 毛? 類 0.00 0.00 0.02 0.00 0.00 0.03 0.00 0.00 0.00 0.04 0.33 0.00 0.00 0.00 有尾類 0.00 0.00 0.00 0.03 0.00 0.00 0.01 0.00 0.28 0.00 0.00 0.00 0.02 0.00 海樽類 0.00 0.00 0.00 0.00 0.00 0.00 0.00 0.00 0.00 0.00 0.00 0.00 0.00 0.00 魚卵 0.00 0.00 0.00 0.00 0.00 0.00 0.00 0.00 0.00 0.00 0.00 0.00 0.00 0.00 仔稚魚 0.00 0.00 0.00 0.00 0.00 0.00 0.00 0.00 0.00 0.00 0.00 0.00 0.00 0.00 其他 51.52 33.06 146.86 117.02 8.15 11.17 3.68 14.22 0.00 2.65 62.92 18.24 2.30 106.13 total 72.80 38.97 167.32 142.11 11.14 14.28 4.22 16.55 46.10 34.85 75.96 27.02 8.74 107.38 關渡 竹圍
表 C-2-2 淡水河各測站浮游動物數量百分比 (九十一年十月十五日) 6:40 8:00 9:20 11:00 12:30 13:50 15:20 16:40 7:20 8:40 10:00 13:10 14:30 16:00 夜光蟲 0.0% 0.0% 0.0% 0.0% 0.0% 0.0% 0.0% 0.0% 0.0% 0.0% 0.0% 0.0% 0.0% 0.0% 有孔蟲 0.0% 0.0% 0.0% 0.0% 0.0% 0.0% 0.0% 0.0% 0.0% 0.0% 0.0% 0.0% 0.0% 0.0% 放射蟲 0.0% 0.0% 0.0% 0.0% 0.0% 0.0% 0.0% 0.0% 0.0% 0.0% 0.0% 0.0% 0.0% 0.0% 水母類 0.0% 0.1% 0.0% 0.0% 1.3% 2.4% 0.0% 0.0% 0.0% 0.0% 0.0% 2.5% 0.0% 0.0% 櫛水母 0.0% 0.0% 0.0% 0.0% 0.0% 0.0% 0.0% 0.0% 0.0% 0.0% 0.0% 0.0% 0.0% 0.0% 多毛類 0.1% 0.3% 0.1% 0.2% 3.0% 7.3% 0.0% 0.0% 0.6% 0.0% 2.6% 2.5% 0.0% 0.0% 翼足類 0.0% 0.0% 0.0% 0.0% 0.0% 0.0% 0.0% 0.0% 0.0% 0.0% 0.0% 0.0% 0.0% 0.0% 異足類 0.0% 0.0% 0.0% 0.0% 0.0% 0.0% 0.0% 0.0% 0.0% 0.0% 0.0% 0.0% 0.0% 0.0% 端足類 0.0% 0.0% 0.0% 0.0% 0.0% 0.0% 0.0% 0.0% 0.0% 0.0% 0.0% 0.0% 0.0% 0.0% 螢蝦 0.0% 0.0% 0.0% 0.0% 0.0% 0.0% 0.0% 0.0% 0.0% 0.0% 0.0% 0.0% 0.0% 0.0% 櫻蝦 0.0% 0.0% 0.0% 0.0% 0.0% 0.0% 0.0% 0.0% 0.0% 0.0% 0.0% 0.0% 0.0% 0.0% 其他十足類 0.0% 0.0% 0.0% 0.0% 0.0% 0.0% 0.0% 0.0% 0.0% 0.0% 0.0% 0.0% 0.0% 0.0% 枝角類 0.0% 0.0% 0.0% 0.0% 0.0% 0.0% 0.0% 0.0% 0.0% 0.0% 0.0% 0.0% 0.0% 0.0% 介形類 0.0% 0.0% 0.0% 0.0% 0.0% 0.0% 0.0% 0.0% 0.0% 0.0% 0.0% 0.0% 0.0% 0.0% 甲殼類幼生 0.0% 0.0% 0.0% 0.0% 0.0% 0.0% 0.0% 0.0% 0.0% 0.0% 0.0% 0.0% 0.0% 0.0% 哲水蚤 8.3% 12.5% 8.4% 16.2% 15.7% 2.9% 11.0% 12.0% 94.5% 90.2% 10.7% 27.5% 73.5% 1.0% 劍水蚤 19.6% 2.3% 3.6% 1.2% 6.8% 9.0% 0.7% 1.8% 1.8% 2.1% 3.0% 0.0% 0.0% 0.1% 猛水蚤 1.2% 0.0% 0.0% 0.0% 0.0% 0.0% 0.7% 0.3% 2.4% 0.0% 0.4% 0.0% 0.0% 0.0% 糠蝦類 0.0% 0.0% 0.0% 0.0% 0.0% 0.0% 0.0% 0.0% 0.0% 0.0% 0.0% 0.0% 0.0% 0.0% 磷蝦類 0.0% 0.0% 0.0% 0.0% 0.0% 0.0% 0.0% 0.0% 0.0% 0.0% 0.0% 0.0% 0.0% 0.0% 棘皮幼生 0.0% 0.0% 0.0% 0.0% 0.0% 0.0% 0.0% 0.0% 0.0% 0.0% 0.0% 0.0% 0.0% 0.0% 毛? 類 0.0% 0.0% 0.0% 0.0% 0.0% 0.2% 0.0% 0.0% 0.0% 0.1% 0.4% 0.0% 0.0% 0.0% 有尾類 0.0% 0.0% 0.0% 0.0% 0.0% 0.0% 0.3% 0.0% 0.6% 0.0% 0.0% 0.0% 0.2% 0.0% 海樽類 0.0% 0.0% 0.0% 0.0% 0.0% 0.0% 0.0% 0.0% 0.0% 0.0% 0.0% 0.0% 0.0% 0.0% 魚卵 0.0% 0.0% 0.0% 0.0% 0.0% 0.0% 0.0% 0.0% 0.0% 0.0% 0.0% 0.0% 0.0% 0.0% 仔稚魚 0.0% 0.0% 0.0% 0.0% 0.0% 0.0% 0.0% 0.0% 0.0% 0.0% 0.0% 0.0% 0.0% 0.0% 其他 70.8% 84.8% 87.8% 82.3% 73.2% 78.2% 87.3% 85.9% 0.0% 7.6% 82.8% 67.5% 26.3% 98.8% 關渡 竹圍
表 C-2-3 顆粒性質濃度 ( 3 /m mg ,九十一年十月十五日) Total zooplankton 站名 採樣時間 TN TC 總乾重 總濕重 C/N值 6:40 0.0116 0.1102 1.0273 26.2816 9.3067 8:00 0.0031 0.1585 0.5384 3.9239 30.7426 9:20 0.0159 0.1218 0.6182 4.4750 7.9356 11:00 0.0490 0.3347 1.4157 15.0990 6.6505 12:30 0.0052 0.0375 0.1906 1.5101 6.2711 13:50 0.0042 0.0438 0.3286 1.4305 9.1665 15:20 0.0009 0.0098 0.0809 0.7029 11.1686 16:40 0.0035 0.0302 0.2294 2.0904 8.8140 7:20 0.0066 0.0607 0.2654 4.4229 9.3413 8:40 0.0055 0.0586 0.2014 3.6877 10.4849 10:00 0.0097 0.0774 0.3741 6.4776 7.7052 13:10 0.0034 0.0333 0.1018 1.4953 9.7321 14:30 0.0075 0.0242 0.1126 0.6457 2.1889 16:00 0.0384 0.3726 1.3048 12.6221 8.7397 關 渡 竹 圍 zooplankton (copepods) 站名 採樣時間 TN TC 總乾重 總濕重 C/N值 6:40 0.0020 0.0182 0.2532 2.8842 9.0378 8:00 0.0005 0.0053 0.0669 0.9309 10.8317 9:20 0.0023 0.0201 0.1445 0.8915 8.8801 11:00 0.0070 0.0443 0.1894 3.1116 6.3208 12:30 0.0036 0.0193 0.0638 0.5942 5.3083 13:50 0.0014 0.0112 0.0264 0.5742 7.9107 15:20 0.0003 0.0041 0.0336 0.0695 13.3080 16:40 0.0010 0.0101 0.0872 0.5087 9.8270 7:20 0.0060 0.0552 0.2550 3.8881 9.2231 8:40 0.0048 0.0514 0.1832 2.9540 10.6829 10:00 0.0020 0.0138 0.0715 1.8285 6.8137 13:10 0.0008 0.0075 0.0390 0.2842 9.4742 14:30 0.0024 0.0175 0.0880 0.4454 7.2644 16:00 0.0017 0.0137 0.0312 0.3743 8.0284 關 渡 竹 圍
zooplankton (non copepods)
站名 採樣時間 TN TC 總乾重 總濕重 C/N值 6:40 0.0096 0.0920 0.7741 23.3974 9.5810 8:00 0.0026 0.1533 0.4715 2.9929 59.7770 9:20 0.0136 0.1018 0.4737 3.5835 7.4785 11:00 0.0420 0.2904 1.2263 11.9874 6.9114 12:30 0.0016 0.0182 0.1268 0.9159 11.5421 13:50 0.0028 0.0327 0.3022 0.8563 11.7103 15:20 0.0006 0.0058 0.0473 0.6334 9.5590 16:40 0.0024 0.0201 0.1422 1.5817 8.2189 7:20 0.0006 0.0055 0.0105 0.5347 9.4635 8:40 0.0007 0.0072 0.0181 0.7336 10.2553 10:00 0.0077 0.0636 0.3026 4.6491 8.2746 13:10 0.0026 0.0257 0.0628 1.2111 9.8708 14:30 0.0051 0.0067 0.0245 0.2003 1.3177 關 渡 竹 圍
圖 C-2-1 淡水河各測站之單位體積水體浮游動物組成 ( 3 / . m Ind ,九十一年十月十五日) 夜 光 蟲 有 孔 蟲 放 射 蟲 水 母 類 櫛 水 母 多 毛 類 翼 足 類 異 足 類 端 足 類 螢 蝦 櫻 蝦 其 他 十 足 類 枝 角 類 介 形 類 甲 殼 類 幼 哲 水 蚤 劍 水 蚤 猛 水 蚤 糠 蝦 類 磷 蝦 類 棘 皮 幼 毛 ? 類 有 尾 類 海 樽 類 魚 卵 仔稚 其他 6:40 9:20 12:30 15:20 7:20 10:00 14:30 0 20 40 60 80 100 120 140 160 ind. / m 3 6:40 8:00 9:20 11:00 12:30 13:50 15:20 16:40 7:20 8:40 10:00 13:10 14:30 16:00 關 渡 竹 圍
圖 C-2-2 淡水河各測站之浮游動物百分比組成 (九十一年十月十五日) 夜 光 蟲 有 孔 蟲 放 射 蟲 水 母 類 櫛 水 母 多 毛 類 翼 足 類 異 足 類 端 足 類 螢 蝦 櫻 蝦 其 他 十 足 類 枝 角 類 介 形 類 甲 殼 類 幼 生 哲 水 蚤 劍 水 蚤 猛 水 蚤 糠 蝦 類 磷 蝦 類 棘 皮 幼 生 毛 ? 類 有 尾 類 海 樽 類 魚 卵 仔 稚 魚 其 他 6:40 9:20 12:30 15:20 7:20 10:00 14:30 0% 10% 20% 30% 40% 50% 60% 70% 80% 90% 100% 6:40 8:00 9:20 11:00 12:30 13:50 15:20 16:40 7:20 8:40 10:00 13:10 14:30 16:00 關 渡 竹 圍
圖 C-2-3 淡水河浮游動物拖網碳、氮組成之分析 (九十一年十月十五日) 浮游動物TN值 0 0.01 0.02 0.03 0.04 0.05 0.06 6: 40 8:00 9:20 11:00 12:30 13:50 15:20 16:40 7:20 8:40 10:00 13:10 14:30 16:00 m g / m 3 關渡 竹圍 浮游動物TC值 0 0.05 0.1 0.15 0.2 0.25 0.3 0.35 0.4 6: 40 8:00 9:20 11:00 12:30 13:50 15:20 16:40 7:20 8:40 10:00 13:10 14:30 16:00 m g / m 3 關渡 竹圍 浮游動物C/N值 0 5 10 15 20 25 30 35 6: 40 8:00 9:20 11:00 12:30 13:50 15:20 16:40 7:20 8:40 10:00 13:10 14:30 16:00 關渡 竹圍 橈足類TN值 0 0.001 0.002 0.003 0.004 0.005 0.006 0.007 0.008 6: 40 8:00 9:20 11:00 12:30 13:50 15:20 16:40 7:20 8:40 10:00 13:10 14:30 16:00 mg /m 3 關渡 竹圍 橈足類TC值 0 0.01 0.02 0.03 0.04 0.05 0.06 6: 4 0 8: 0 0 9: 2 0 11 :00 12 :30 13 :50 15 :20 16 :40 7: 2 0 8: 4 0 10 :00 13 :10 14 :30 16 :00 m g / m 3 關渡 竹圍 橈足類C/N值 0 2 4 6 8 10 12 14 6: 40 8:00 9:20 11:00 12:30 13:50 15:20 16:40 7:20 8:40 10:00 13:10 14:30 16:00 關渡 竹圍 非橈足類TN值 0 0.005 0.01 0.015 0.02 0.025 0.03 0.035 0.04 0.045 6: 40 8:00 9:20 11:00 12:30 13:50 15:20 16:40 7:20 8:40 10:00 13:10 14:30 16:00 mg / m 3 非橈足類TC值 0 0.05 0.1 0.15 0.2 0.25 0.3 0.35 0.4 6: 40 8:00 9:20 11:00 12:30 13:50 15:20 16:40 7:20 8:40 10:00 13:10 14:30 16:00 mg / m 3 非橈足類C/N值 0 10 20 30 40 50 60 70 6: 40 8:00 9:20 11:00 12:30 13:50 15:20 16:40 7:20 8:40 10:00 13:10 14:30 16:00
表 C-2-4 淡水河各測站浮游動物組成 ( 3 / . m Ind ,九十一年九月二十五日) 8:35 9:40 11:15 12:30 13:55 7:30 10:30 夜光蟲 0.00 0.00 0.00 0.00 0.00 0.00 0.00 有孔蟲 0.00 0.00 0.00 0.00 0.00 0.00 0.00 放射蟲 0.00 0.00 0.00 0.00 0.00 0.00 0.00 水母類 0.00 0.04 0.00 0.00 1.15 0.00 0.00 櫛水母 0.00 0.00 0.00 0.00 0.00 0.00 0.00 多毛類 0.07 0.18 0.00 0.00 0.00 0.72 0.00 翼足類 0.00 0.00 0.00 0.00 0.00 0.00 0.00 異足類 0.00 0.00 0.00 0.00 0.00 0.00 0.00 端足類 0.00 0.00 0.00 0.00 0.00 0.00 0.00 螢蝦 0.00 0.00 0.00 0.51 0.00 0.00 0.00 櫻蝦 0.00 0.00 0.00 0.00 0.00 0.00 0.00 其他十足類 0.00 0.00 0.00 0.00 0.00 0.00 0.00 枝角類 0.07 0.00 0.00 0.00 0.00 0.00 0.00 介形類 0.00 0.00 0.00 0.00 0.00 0.00 0.00 甲殼類幼生 0.00 0.00 0.46 0.51 0.00 0.00 0.00 哲水蚤 19.15 7.33 626.57 418.10 1447.17 118.77 2122.02 劍水蚤 0.03 0.00 0.46 62.19 6.32 0.00 3.73 猛水蚤 0.00 0.00 0.00 11.31 31.60 0.00 7.46 糠蝦類 0.00 0.00 0.00 0.00 0.00 0.00 0.00 磷蝦類 0.00 0.00 0.00 0.00 0.00 0.00 0.00 棘皮幼生 0.00 0.00 0.00 0.00 0.00 0.00 0.00 毛? 類 0.00 0.00 0.00 0.51 0.00 0.00 0.00 有尾類 0.00 0.00 0.00 5.65 0.00 0.00 0.00 海樽類 0.00 0.00 0.00 0.00 0.00 0.00 0.00 魚卵 0.00 0.00 0.00 0.51 0.00 0.00 0.00 仔稚魚 0.00 0.00 0.00 0.00 0.00 0.00 0.00 其他 0.00 0.00 0.00 0.00 0.00 0.00 0.00 total 19.31 7.55 627.48 499.31 1486.24 119.50 2133.21 關渡 竹圍
表 C-2-5 淡水河各測站浮游動物數量百分比 (九十一年九月二十五日) 8:35 9:40 11:15 12:30 13:55 7:30 10:30 夜光蟲 0.0% 0.0% 0.0% 0.0% 0.0% 0.0% 0.0% 有孔蟲 0.0% 0.0% 0.0% 0.0% 0.0% 0.0% 0.0% 放射蟲 0.0% 0.0% 0.0% 0.0% 0.0% 0.0% 0.0% 水母類 0.0% 0.5% 0.0% 0.0% 0.1% 0.0% 0.0% 櫛水母 0.0% 0.0% 0.0% 0.0% 0.0% 0.0% 0.0% 多毛類 0.3% 2.4% 0.0% 0.0% 0.0% 0.6% 0.0% 翼足類 0.0% 0.0% 0.0% 0.0% 0.0% 0.0% 0.0% 異足類 0.0% 0.0% 0.0% 0.0% 0.0% 0.0% 0.0% 端足類 0.0% 0.0% 0.0% 0.0% 0.0% 0.0% 0.0% 螢蝦 0.0% 0.0% 0.0% 0.1% 0.0% 0.0% 0.0% 櫻蝦 0.0% 0.0% 0.0% 0.0% 0.0% 0.0% 0.0% 其他十足類 0.0% 0.0% 0.0% 0.0% 0.0% 0.0% 0.0% 枝角類 0.3% 0.0% 0.0% 0.0% 0.0% 0.0% 0.0% 介形類 0.0% 0.0% 0.0% 0.0% 0.0% 0.0% 0.0% 甲殼類幼生 0.0% 0.0% 0.1% 0.1% 0.0% 0.0% 0.0% 哲水蚤 99.1% 97.1% 99.9% 83.7% 97.4% 99.4% 99.5% 劍水蚤 0.2% 0.0% 0.1% 12.5% 0.4% 0.0% 0.2% 猛水蚤 0.0% 0.0% 0.0% 2.3% 2.1% 0.0% 0.3% 糠蝦類 0.0% 0.0% 0.0% 0.0% 0.0% 0.0% 0.0% 磷蝦類 0.0% 0.0% 0.0% 0.0% 0.0% 0.0% 0.0% 棘皮幼生 0.0% 0.0% 0.0% 0.0% 0.0% 0.0% 0.0% 毛? 類 0.0% 0.0% 0.0% 0.1% 0.0% 0.0% 0.0% 有尾類 0.0% 0.0% 0.0% 1.1% 0.0% 0.0% 0.0% 海樽類 0.0% 0.0% 0.0% 0.0% 0.0% 0.0% 0.0% 魚卵 0.0% 0.0% 0.0% 0.1% 0.0% 0.0% 0.0% 仔稚魚 0.0% 0.0% 0.0% 0.0% 0.0% 0.0% 0.0% 其他 0.0% 0.0% 0.0% 0.0% 0.0% 0.0% 0.0% 關渡 竹圍
表 C-2-6 顆粒性質濃度 ( 3 /m mg ,九十一年九月二十五日) Total zooplankton 站名 採樣時間 TN TC 總乾重 總濕重 C/N值 8:35 0.0059 0.0300 0.0789 2.7524 5.2806 9:40 0.0039 0.0215 0.0520 0.6658 5.6149 11:15 0.0953 0.6261 1.5291 27.3295 6.9855 12:30 0.1382 0.9359 2.7104 28.8667 6.8590 13:55 0.4314 2.1535 5.4151 145.4600 6.1371 7:30 0.0415 0.2400 0.6709 9.8640 6.3536 10:30 0.7513 4.4248 14.7305 291.0445 6.4798 關 渡 竹 圍 zooplankton (copepeods) 站名 採樣時間 TN TC 總乾重 總濕重 C/N值 8:35 0.0054 0.0272 0.0681 2.2766 4.9993 9:40 0.0034 0.0170 0.0414 0.4045 4.9691 11:15 0.0944 0.6198 1.5060 26.8781 6.5628 12:30 0.1338 0.9056 2.6082 28.3702 6.7677 13:55 0.4279 2.1335 5.3463 144.4989 4.9862 7:30 0.0408 0.2345 0.6592 9.5908 5.7428 10:30 0.7508 4.4207 14.7191 290.7562 5.8883 關 渡 竹 圍
zooplankton (non copepods)
站名 採樣時間 TN TC 總乾重 總濕重 C/N值 8:35 0.0005 0.0027 0.0108 0.4758 6.0079 9:40 0.0004 0.0045 0.0107 0.2612 10.3882 11:15 0.0008 0.0062 0.0230 0.4513 7.5092 12:30 0.0044 0.0303 0.1022 0.4965 6.9409 13:55 0.0035 0.0200 0.0688 0.9611 5.6730 7:30 0.0007 0.0055 0.0118 0.2732 8.3346 10:30 0.0005 0.0041 0.0114 0.2883 7.8362 關 渡 竹 圍
圖 C-2-4 淡水河各測站之單位體積水體浮游動物組成 ( 3 / . m Ind ,九十一年九月二十五日) 夜 光 蟲 有 孔 蟲 放 射 蟲 水 母 類 櫛 水 母 多 毛 類 翼 足 類 異 足 類 端 足 類 螢 蝦 櫻蝦 其他 十 足 類 枝 角 類 介 形 類 甲 殼 類 幼 生 哲 水 蚤 劍 水 蚤 猛 水 蚤 糠 蝦 類 磷 蝦 類 棘 皮 幼 生 毛 ? 類 有 尾 類 海 樽 類 魚 卵 仔稚 魚 其 他 8:35 11:15 13:55 10:30 0 500 1000 1500 2000 2500 ind. / m 3 8:35 9:40 11:15 12:30 13:55 7:30 10:30 關 渡 竹 圍
圖 C-2-5 淡水河各測站之浮游動物百分比組成 (九十一年九月二十五日) 夜 光 蟲 有 孔 蟲 放 射 蟲 水 母 類 櫛 水 母 多 毛 類 翼 足 類 異 足 類 端 足 類 螢 蝦 櫻蝦 其他 十 足 類 枝 角 類 介 形 類 甲 殼 類 幼 生 哲 水 蚤 劍 水 蚤 猛 水 蚤 糠 蝦 類 磷 蝦 類 棘 皮 幼 生 毛 ? 類 有 尾 類 海 樽 類 魚 卵 仔稚 魚 其 他 8:35 11:15 13:55 10:30 0% 10% 20% 30% 40% 50% 60% 70% 80% 90% 100% 8:35 9:40 11:15 12:30 13:55 7:30 10:30 關 渡 竹 圍
圖 C-2-6 淡水河浮游動物拖網碳、氮組成之分析 (九十一年九月二十五日) 浮游動物TN值 0 0.1 0.2 0.3 0.4 0.5 0.6 0.7 0.8 8: 35 9:40 11:15 12:30 13:55 7:30 10:30 m g / m 3 關渡 竹圍 浮游動物TC值 0 0.5 1 1.5 2 2.5 3 3.5 4 4.5 5 8: 35 9:40 11:15 12:30 13:55 7:30 10:30 m g / m 3 關渡 竹圍 浮游動物C/N值 0 1 2 3 4 5 6 7 8 8: 35 9:40 11:15 12:30 13:55 7:30 10:30 關渡 竹圍 橈足類TN值 0 0.1 0.2 0.3 0.4 0.5 0.6 0.7 0.8 8: 35 9:40 11:15 12:30 13:55 7:30 10:30 m g / m 3 關渡 竹圍 橈足類TC值 0 0.5 1 1.5 2 2.5 3 3.5 4 4.5 5 8: 35 9:40 11:15 12:30 13:55 7:30 10:30 m g / m 3 關渡 竹圍 橈足類C/N值 0 1 2 3 4 5 6 7 8 8: 35 9:40 11:15 12:30 13:55 7:30 10:30 關渡 竹圍 非橈足類TN值 0 0.0005 0.001 0.0015 0.002 0.0025 0.003 0.0035 0.004 0.0045 0.005 8: 35 9:40 11:15 12:30 13:55 7:30 10:30 m g / m 3 非橈足類TC值 0 0.005 0.01 0.015 0.02 0.025 0.03 0.035 8: 35 9:40 11:15 12:30 13:55 7:30 10:30 m g / m 3 非橈足類C/N值 0 2 4 6 8 10 12 8: 35 9:40 11:15 12:30 13:55 7:30 10:30
(3) 浮游藻類與營養鹽
此類數據之採樣與分析乃是由本計畫協同主持人吳俊宗教授之另一國科會 資助之計畫執行,採樣時與本計畫同步作業。分析所得數據,由該計畫另行列報。
D. 生態模式之測試
A series of test runs were conducted to make sure that the model program was coded correctly. A fictitious estuary with simple geometry was used for the test. The following gives the pertinent information for the test runs.
Geometric Information:
Constant width = 200 m, constant depth = 5 m. Hydrodynamic Information:
Tidal amplitude at the mouth = 30 cm, tidal period = 12.42 hours (i. e., M2 tide),
Salinity at the mouth = 35 ppt,
Freshwater discharge at the head = 25 cms. Computational Information:
Ä x = 2 km, Ä z = 1 m, Ä t = 108 sec.
Water Quality Information:
Upstream boundary conditions: DO = 7.5 mg/l, and everything else is zero.
Downstream boundary conditions: DO = 7.5 mg /l, PB1 (diatom) = 0.3 mg/l, ZB1 (copepod) = 0.05 mg/l, everything else is zero.
Pollutant loading: a point source is located at 30 km from the head of estuary with flow rate = 1.0 cms.
In each of the model test run, all input conditions were held constant and the model was run until the equilibrium state was reached. The model was first run with the kinetic coefficients specified in such a way that the newly developed model was equivalent to the original HEM-2d (i. e., with 8 water quality state variables). The results of the new model were compared with that of the HEM-2d, and it was proved that the two sets of results are identical. Then the input file was modified to bring in the new state variables one or a few at a time, and made sure the model results were in accordance to expectation at each step of modification. This process continued until the full set of 21 state variables were in operation simultaneously. Then the model was run by changing the value of kinetic coefficient one at a time to check if the model response was reasonable. The following figures present the results of one model run as an example, of which the point source loading is shown in table D-1. The figures show the spatial distribution of the concentrations of state variables. The horizontal axis is distance from the estuarine mouth in kilometers, and the vertical axis is depth in meters. All the iso-concentration contours are in mg/l.
表 D-1 test run 點源污染排放量 水質類別 水質因子 模式中使用代號 排放量(kg/day) 難分解顆粒態有機碳 RPOC 10,000 易分解顆粒態有機碳 LPOC 10,000 碳 溶解態有機碳 DOC 10,000 難分解顆粒態有機氮 RPON 500 易分解顆粒態有機氮 LPON 500 溶解態有機氮 DON 500 氨氮 NH4 8,000 氮 硝酸氮 NO3 2,000 難分解顆粒態有機磷 RPOP 200 易分解顆粒態有機磷 LPOP 200 溶解態有機磷 DOP 200 磷 磷酸根 PO4t 1,000 生物源顆粒態矽 SU 500 矽 可用性矽 SAt 10,000 化學需氧量 COD 10,000 溶氧 DO 430
(a) -5 -4 -3 -2 -1 0 -5 -4 -3 -2 -1 0 D e p th (m ) (b) 0 20 40 60 80 100 120 140 -5 -4 -3 -2 -1 0 0 20 40 60 80 100 120 140
Distance from estuarine mouth (km)
-5 -4 -3 -2 -1 0 D e p th (m ) 圖 D-1 潮平均模擬結果 — (a)Salinity, ppt ; (b)TSS, mg/L (a) -5 -4 -3 -2 -1 0 -5 -4 -3 -2 -1 0 D e p th (m ) (b) 0 20 40 60 80 100 120 140 -5 -4 -3 -2 -1 0 0 20 40 60 80 100 120 140
Distance from estuarine mouth (km)
-5 -4 -3 -2 -1 0 D e p th (m ) 圖 D-2 日平均模擬結果 — (a)ZB1; (b)ZB2, mg C/L
(a) -5 -4 -3 -2 -1 0 -5 -4 -3 -2 -1 0 D e p th (m ) (b) -5 -4 -3 -2 -1 0 -5 -4 -3 -2 -1 0 D e p th (m ) (c) 0 20 40 60 80 100 120 140 -5 -4 -3 -2 -1 0 0 20 40 60 80 100 120 140
Distance from estuarine mouth (km)
-5 -4 -3 -2 -1 0 D e p th (m ) 圖 D-3 日平均模擬結果 — (a)PB1; (b)PB2; (c)PB3, mg C/L
(a) -5 -4 -3 -2 -1 0 -5 -4 -3 -2 -1 0 D e p th (m ) (b) -5 -4 -3 -2 -1 0 -5 -4 -3 -2 -1 0 D e p th (m ) (c) 0 20 40 60 80 100 120 140 -5 -4 -3 -2 -1 0 0 20 40 60 80 100 120 140
Distance from estuarine mouth (km)
-5 -4 -3 -2 -1 0 D e p th (m )
(a) -5 -4 -3 -2 -1 0 -5 -4 -3 -2 -1 0 D e p th (m ) (b) -5 -4 -3 -2 -1 0 -5 -4 -3 -2 -1 0 D e p th (m ) (c) -5 -4 -3 -2 -1 0 -5 -4 -3 -2 -1 0 D e p th (m ) (d) -5 -4 -3 -2 -1 0 -5 -4 -3 -2 -1 0 D e p th (m ) (e) 0 20 40 60 80 100 120 140 -5 -4 -3 -2 -1 0 0 20 40 60 80 100 120 140
Distance from estuarine mouth (km)
-5 -4 -3 -2 -1 0 D e p th (m )
(a) -5 -4 -3 -2 -1 0 -5 -4 -3 -2 -1 0 D e p th (m ) (b) -5 -4 -3 -2 -1 0 -5 -4 -3 -2 -1 0 D e p th (m ) (c) 0 20 40 60 80 100 120 140 -5 -4 -3 -2 -1 0 0 20 40 60 80 100 120 140
Distance from estuarine mouth (km)
-5 -4 -3 -2 -1 0 D e p th (m )
(a) -5 -4 -3 -2 -1 0 -5 -4 -3 -2 -1 0 D e p th (m ) (b) 0 20 40 60 80 100 120 140 -5 -4 -3 -2 -1 0 0 20 40 60 80 100 120 140
Distance from estuarine mouth (km)
-5 -4 -3 -2 -1 0 D e p th (m ) 圖 D-8 日平均模擬結果— (a)COD; (b)DO, mg O2/L