Study on key factors to Apply sediment
bypass tunnel for reservoir sediment
management
Eisei Kitamura, Masato Ono, Gen Nagatani, Tetsuya Sumi
Abstract
With this research, in line with our purpose of obtaining a general understanding of the applicability of sediment bypass tunnels with individual dams, we created an outline plan investigation flowchart. The criteria to be used as decision benchmarks in the flowchart, which include structural specifications, design discharge, sediment discharge unit cost, and project cost, have been set based on sediment bypass tunnels in Japan and Switzerland, and on Japanese regional characteristics. As a case study, this flowchart was used to evaluate the applicability of sediment bypass tunnels with 37 dams in Japan, and it was determined that a tunnel was applicable for 19 of the dams. When the authors analyzed the reasons for applicability being low for the remaining 18 dams, a primary reason was that either the tunnel diameter was not within the range of limiting conditions.This factor was applied to 11 of the dams. Of these 11 dams, 7 dams met the criteria for initial cost and sediment discharge unit cost but were judged to have low applicability because the tunnel diameter was D<3m, and therefore we thought that a more reasonable result may be obtained by eliminating the lower limit for the tunnel diameter. When applicability was re-evaluated based on this adjustment, a tunnel was found to be applicable for 26 dams. In addition, when considering the relationship between sediment concentration and sediment discharge unit cost, it was determined that most dams with sediment concentration of 0.015% or higher have applicability. From this finding, it was recognized that sediment concentration could be used as one of the decision benchmarks for applicability.
Keywords: sediment bypass tunnel, outline plan investigation flowchart, decision benchmarks, sediment concentration
1 Introduction
A sediment bypass tunnel is a well-known engineering structure offering permanent results as a measure for reservoir sediment. However, cases of execution worldwide are few, and the planning and design used in each case differ by the characteristics of a particular dam. In order to plan and design more efficient and economical sediment bypass tunnels, systemization of tunnel planning and design is essential. This report sets criteria for use as decision benchmarks during general evaluation of sediment bypass tunnel applicability, based on sediment bypass tunnels in Japan and Switzerland, and
establishes an outline plan investigation flowchart for that purpose. As a case study, the outline plan investigation flowchart was implemented with a total of 37 dams in Japan, by which the authors validated the suitability of the flowchart for evaluating the applicability of sediment bypass tunnels and considered the need for any improvements.
2 Setting criteria for structural specifications, sediment discharge unit
cost and project cost
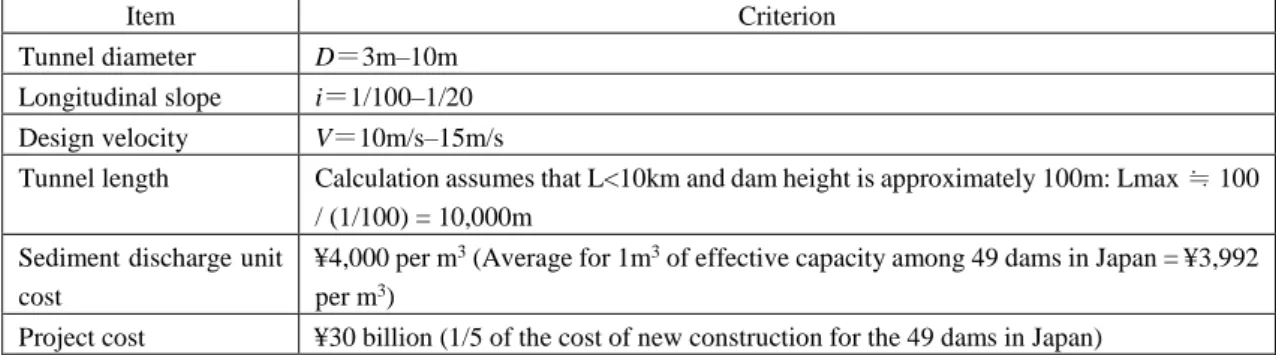
During creation of the outline plan investigation flowchart for sediment bypass tunnels, we set criteria for the tunnel diameter, longitudinal slope, and design velocity of a sediment bypass tunnel (open channel), to serve as limiting conditions. The criteria were based on the minimum and maximum values found at four dams in Japan and six dams in Switzerland. Tunnel length was based on a longitudinal slope minimum value of approximately i=1/100, with the result that, for example, a dam with a height of 100m has a criterion for maximum tunnel length of approximately L=10km. Furthermore, cost-effectiveness and project cost incurred by the installation of a sediment bypass tunnel may also become limiting conditions for implementing a project. For this reason, we used past dam construction costs to seek the monetary amount needed to secure 1m3 of effective capacity in a reservoir, and we consequently set ¥4,000/m3 as the upper limit for the sediment discharge unit cost. It can be assumed that a tunnel project will not be implemented unless its cost is much lower than the cost of constructing a new dam, so we tentatively set the project cost at ¥30 billion, about 1/5 of the cost of building a new dam. The components explained above are shown in Table 1.
Table 1: Criteria for structural specifications, sediment discharge unit cost and project cost of a sediment bypass tunnel (open channel)
Item Criterion
Tunnel diameter D=3m–10m
Longitudinal slope i=1/100–1/20
Design velocity V=10m/s–15m/s
Tunnel length Calculation assumes that L<10km and dam height is approximately 100m: Lmax ≒ 100 / (1/100) = 10,000m
Sediment discharge unit cost
¥4,000 per m3 (Average for 1m3 of effective capacity among 49 dams in Japan = ¥3,992 per m3)
Project cost ¥30 billion (1/5 of the cost of new construction for the 49 dams in Japan)
3 Outline plan investigation flowchart for sediment bypass tunnel
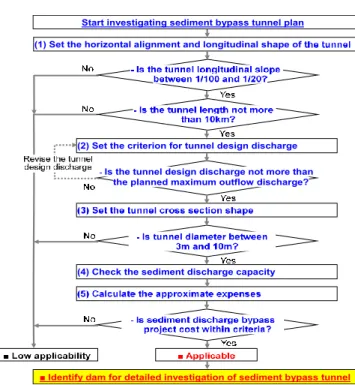
Figure 1 shows an outline plan investigation flowchart for evaluating the applicability of a sediment bypass tunnel. This flowchart was created for the purpose of performing a general and systematic primary evaluation of the applicability of a sediment bypass tunnel. The flowchart provides a process for investigating an outline plan for a sediment bypass tunnel, including the above-mentioned structural specifications, sediment discharge unit cost, and project cost as limiting conditions, and then adds a process to check whether or not design discharge is within the planned maximum outflow discharge for the dam.
Figure 1: Outline plan investigation flowchart for sediment bypass tunnel
4 Validation of outline plan investigation flowchart
4.1 Sediment inflow conditions
When calculating the volume of sediment inflow to the dam, we used the following correlation equation [1] with sediment volume L and discharge Q, which is a basic statistical method.
[1] Where, L is the sediment volume, Q is the discharge, and α and β are coefficients. When setting the optimum tunnel scale for each dam, it is actually preferable to set the
L-Q equation separately according to the actual discharge and sediment inflow for each dam.
However, the objective at this point is to apply the currently created outline plan investigation flowchart to 37 dams throughout Japan and to grasp the validity and tendencies of the results, and therefore the following simple parameters were set for the
L-Q equation. Regarding β, when β for suspended sediment (less than 2.0mm) is made
larger, there is a tendency for the inflow sediment volume entering the sediment bypass tunnel to increase and for the tunnel scale to become larger, so this was fixed at general value β=2. α was set so that average annual inflow sediment volume, taken from hydrograph discharge data from 2002 to 2017, the years for which data could be obtained, would match the average annual deposited sediment volume for each dam. The grain composition used in the L-Q equation was based on the grain composition of sediment deposited in 27 dam reservoirs in Japan that was collected by Sakurai et al. (2003) as well as the average value of 15 dams in Japan, where the grain composition of inflow sediment
could be ascertained. This composition is: pebbles (2mm or larger) at 15%, sand (0.075mm to 2.0mm) at 35%, and silt and clay (0.075mm or smaller) at 50%.
4.2 Investigation conditions for tunnel size
Table 2 shows the investigation conditions for optimum tunnel size. For the optimum tunnel size of a selected target dam, we calculated the sediment discharge unit cost for each tunnel size using the previously mentioned L-Q equation with the actual discharge, and we selected the size to yield the smallest sediment discharge unit cost.
Table 2: Investigation conditions for optimum tunnel size
Item Investigation conditions
Tunnel maximum discharge
○ Parameter: Sets approximately 7 cases for each dam
* Based on the existing sediment bypass tunnel examples shown in Figure 2, we set the investigation cases by using as a criterion the specific discharge range of approximately 0.1m3/s/km2 to 4.0m3/s/km2.
Branching conditions ○ Bypass maximum discharge ≧ inflow ⇒ bypass discharge = inflow
○ Bypass maximum discharge < inflow → Bypass discharge = Bypass maximum discharge Sediment branching
conditions
Bed load sediment (assuming D=2.0mm or larger): Full volume discharged to downstream from tunnel
Suspended sediment (assuming under D=2.0mm): Ratio is the same as the ratio of branching discharge to the tunnel
Sediment inflow
conditions ○ Adopts the L-Q equation set in "Sediment inflow conditions" Tunnel specifications
○ Length: Set generally based on the reservoir level of each dam
○ Slope: Assumes that height difference = dam height, sets tunnel slope based on tunnel length and height difference
Calculation period ○ Uses actual discharges for 16 years from 2002 to 2017
Tunnel cost ○Calculate initial cost (tunnel construction cost) and maintenance cost (wear repair) based on required tunnel size for design discharge
Sediment discharge unit cost
○ Sediment discharge unit cost = tunnel cost (initial + maintenance) / 100-year sediment discharge volume
Assessment of optimum size
○ Assesses the optimum size for each tunnel size calculated above to be the size for which the sediment discharge unit cost is lowest
Figure 2: Relationship between catchment area and existing tunnel design discharge (specific discharge)
4.3 Result of applying outline plan investigation flowchart
Table 3 shows the results of applying the outline plan investigation flowchart. As a result of applying the outline plan investigation flowchart, it was determined that a sediment bypass tunnel has applicability for 19 of 37 dams. On the other hand, the most prominent reason for a dam to be assessed to have low applicability was the diameter of the sediment bypass tunnel, and of the 18 dams determined to have low applicability, 11 of those dams were impacted by this factor.
0 2 4 6 8 10 0 200 400 600 800 1000 Desig n Discha rg e (Sp e cif ic Di sch a rg e )( m 3/s/ km 2) Catchment Area(km2) 0.1~4.0m3/s/km2
Reject as outliers ○ :Japan
△ :Switzerland □ :Taiwan
T ab le 3 : Res u lt o f ev alu atin g ap p licab ilit y b ased o n o u tlin e p lan in v esti g atio n f lo wch ar t A p p lic a b ili ty J u d g m e n t 1 H o kka id o 299 9 2 ,7 0 0 3 2 5 ,9 3 0 74 0 .0 1 4 7 ,4 0 0 120 30 0 .1 0 4 .1 0 6 .2 9 1 .6 1 ,7 7 0 8 0 .2 - 2 H o kka id o 292 6 6 ,0 0 0 4 4 2 ,1 0 4 59 0 .0 0 8 4 ,8 0 0 60 40 0 .1 4 3 .3 0 7 .3 5 0 .0 1 ,1 6 0 8 6 .2 ○ 3 H o kka id o 1 ,6 6 2 1 0 8 ,0 0 0 1 ,8 8 6 ,5 1 9 369 0 .0 1 2 1 2 ,1 0 0 250 100 0 .0 6 9 .3 0 9 .7 3 3 6 .6 1 ,3 7 0 8 0 .8 - 4 H o kka id o 1 ,2 1 5 3 1 ,5 0 0 1 ,4 6 1 ,4 0 0 710 0 .0 2 9 1 4 ,5 0 0 460 150 0 .1 2 1 4 .7 0 1 3 .3 6 3 1 .3 1 ,7 0 0 7 6 .5 - 5 T o h o ku 583 1 1 4 ,1 6 0 1 ,4 0 7 ,8 6 9 194 0 .0 0 8 1 1 ,0 0 0 130 150 0 .2 6 7 .8 0 9 .3 2 5 5 .0 1 ,9 4 0 7 8 .2 - 6 T o h o ku 635 6 5 ,0 0 0 1 ,2 7 8 ,2 8 5 217 0 .0 1 0 9 ,9 0 0 190 100 0 .1 6 8 .1 0 8 .9 2 3 9 .0 2 ,0 3 0 6 6 .6 - 7 T o h o ku 231 1 0 9 ,0 0 0 9 0 0 ,8 6 0 153 0 .0 1 0 5 ,4 0 0 50 60 0 .2 6 3 .5 0 8 .6 5 8 .2 550 7 3 .0 ○ 8 T o h o ku 225 5 3 ,1 0 0 4 0 1 ,8 3 1 92 0 .0 1 4 6 ,1 0 0 70 40 0 .1 8 3 .5 0 7 .1 6 5 .1 940 8 4 .0 ○ 9 T o h o ku 205 5 0 ,0 0 0 4 9 0 ,2 8 5 79 0 .0 1 0 5 ,9 0 0 90 60 0 .2 9 4 .6 0 7 .9 8 2 .7 1 ,4 3 0 8 3 .9 ○ 10 K a n to 323 8 3 ,0 0 0 1 8 6 ,7 1 6 200 0 .0 6 4 3 ,7 0 0 30 200 0 .6 2 4 .2 0 1 2 .6 4 9 .6 430 7 9 .3 ○ 11 K a n to 170 2 6 ,9 0 0 1 3 3 ,1 5 4 89 0 .0 4 0 4 ,0 0 0 50 80 0 .4 7 3 .9 0 9 .2 4 8 .8 1 ,0 1 0 7 5 .4 ○ 12 K a n to 214 1 9 3 ,0 0 0 2 7 0 ,6 3 9 235 0 .0 5 2 8 ,5 0 0 60 60 0 .2 8 3 .8 0 8 .3 9 7 .0 750 6 4 .4 ○ 13 K a n to 167 2 0 4 ,3 0 0 5 4 6 ,9 4 5 117 0 .0 1 3 8 ,9 0 0 70 40 0 .2 4 3 .5 0 7 .1 9 2 .8 1 ,3 2 0 7 2 .0 ○ 14 H o ku ri ku 618 2 4 ,7 0 0 1 ,6 1 5 ,3 0 8 546 0 .0 2 0 2 ,4 0 0 30 90 0 .1 5 3 .1 0 1 0 .5 2 7 .0 90 6 7 .5 ○ 15 H o ku ri ku 826 5 7 ,5 0 0 1 ,0 6 0 ,0 2 7 161 0 .0 0 9 4 ,1 0 0 60 90 0 .1 1 3 .1 0 6 .9 2 7 .7 300 6 9 .3 ○ 16 H o ku ri ku 193 3 3 ,9 0 0 5 6 7 ,1 8 3 35 0 .0 0 4 2 ,5 0 0 30 45 0 .2 3 2 .4 0 8 .5 2 0 .6 770 8 5 .9 - 17 H o ku ri ku 428 2 3 1 ,0 0 0 1 ,1 7 5 ,0 7 6 232 0 .0 1 2 1 2 ,0 0 0 80 40 0 .0 9 3 .8 0 7 .2 1 3 6 .1 4 ,5 8 0 5 1 .1 - 18 H o ku ri ku 76 2 7 ,5 0 0 1 9 3 ,3 8 8 77 0 .0 2 4 2 ,3 0 0 20 30 0 .3 9 1 .7 0 7 .3 1 3 .5 390 7 6 .0 - 19 C h u b u 311 2 9 ,9 5 2 4 1 3 ,4 1 9 111 0 .0 1 6 5 ,9 0 0 90 30 0 .1 0 3 .6 0 6 .6 6 5 .5 870 7 1 .8 ○ 20 C h u b u 471 4 0 ,0 0 0 9 8 8 ,7 0 9 164 0 .0 1 0 7 ,0 0 0 90 100 0 .2 1 5 .6 0 8 .9 1 1 8 .9 1 ,1 5 0 7 4 .6 ○ 21 C h u b u 81 3 2 ,6 0 0 1 7 3 ,6 7 8 85 0 .0 2 9 3 ,6 0 0 50 60 0 .7 4 3 .5 0 8 .6 3 9 .1 1 ,3 4 0 5 5 .3 ○ 22 K in ki 352 2 6 ,2 8 0 3 ,1 2 1 ,7 1 7 97 0 .0 0 2 5 ,5 0 0 80 600 1 .7 0 1 0 .3 0 1 4 .3 1 7 4 .0 1 ,6 4 0 9 4 .9 - 23 K in ki 215 2 3 ,3 0 0 3 3 0 ,3 8 3 66 0 .0 1 2 2 ,8 0 0 40 800 3 .7 2 8 .1 0 1 7 .2 7 3 .2 700 9 5 .8 - 24 K in ki 290 6 6 ,0 0 0 3 5 9 ,7 6 4 124 0 .0 2 1 5 ,2 0 0 80 20 0 .0 7 2 .9 0 5 .4 4 7 .4 1 ,2 5 0 4 8 .0 - 25 C h u g o ku 308 4 7 ,3 0 0 3 7 3 ,7 9 5 59 0 .0 0 9 5 ,0 0 0 100 30 0 .1 0 3 .8 0 6 .3 5 9 .3 1 ,0 1 0 6 1 .2 ○ 26 C h u g o ku 32 2 0 ,6 0 0 6 1 ,3 6 9 11 0 .0 1 1 3 ,2 0 0 40 10 0 .3 1 1 .6 0 5 .7 1 6 .3 240 6 5 .7 - 27 C h u g o ku 301 1 1 2 ,0 0 0 2 8 1 ,8 8 5 162 0 .0 3 5 5 ,9 0 0 50 90 0 .3 0 4 .0 0 9 .4 7 2 .1 990 7 6 .1 ○ 28 C h u g o ku 242 6 0 ,0 0 0 1 7 1 ,8 9 1 41 0 .0 1 4 6 ,3 0 0 80 20 0 .0 8 2 .9 0 5 .4 5 6 .2 2 ,9 7 0 5 9 .7 - 29 S h iko ku 73 1 2 ,8 0 0 3 1 ,1 7 8 24 0 .0 4 5 2 ,7 0 0 40 10 0 .1 4 1 .6 0 5 .7 1 4 .5 780 5 5 .8 - 30 S h iko ku 689 6 6 ,0 0 0 1 ,2 2 0 ,6 6 3 167 0 .0 0 8 8 ,6 0 0 90 900 1 .3 1 1 2 .7 0 1 5 .5 3 2 9 .3 4 ,2 4 0 8 1 .5 - 31 S h iko ku 168 1 6 ,0 0 0 2 0 1 ,1 9 7 32 0 .0 0 9 6 ,0 0 0 100 100 0 .6 0 5 .9 0 8 .8 1 0 7 .1 5 ,3 1 0 7 7 .1 - 32 K yu sh u 805 1 2 3 ,0 0 0 1 ,8 1 4 ,7 4 0 212 0 .0 0 7 1 5 ,9 0 0 140 400 0 .5 0 1 1 .7 0 1 1 .8 5 4 7 .5 4 ,5 9 0 7 1 .2 - 33 K yu sh u 89 2 3 ,3 0 0 1 0 4 ,8 1 5 24 0 .0 1 4 3 ,8 0 0 70 80 0 .9 0 4 .6 0 8 .8 5 4 .1 3 ,8 6 0 7 7 .9 ○ 34 K yu sh u 491 5 4 ,6 0 0 9 9 1 ,9 3 8 89 0 .0 0 5 8 ,3 0 0 100 100 0 .2 0 5 .9 0 8 .8 1 4 7 .6 3 ,4 5 0 5 8 .7 ○ 35 K yu sh u 185 5 9 ,3 0 0 4 2 4 ,2 0 1 99 0 .0 1 4 5 ,6 0 0 60 150 0 .8 1 5 .3 0 1 0 .6 9 0 .5 1 ,5 9 0 7 0 .3 ○ 36 K yu sh u 359 4 6 ,0 0 0 7 0 7 ,2 7 3 169 0 .0 1 4 7 ,0 0 0 100 90 0 .2 5 5 .7 0 8 .6 1 2 0 .7 1 ,5 2 0 6 0 .7 ○ 37 K yu sh u 34 1 3 ,6 0 0 2 3 ,0 9 1 13 0 .0 3 3 2 ,0 0 0 20 20 0 .5 9 1 .5 0 6 .6 1 0 .1 1 ,4 0 0 7 3 .1 - A p p lica b le 32 31 37 37 26 35 33 33 37 19 L o w a p p lic a b ili ty 5 6 0 0 11 2 4 4 0 18 N o te : T h e re d l et te rs i n t h e ta b le i n d ic at e a v al u e o u ts id e th e ap p li ca b le ra n g e. J u d g m e n t A p p lic a b le : ○ L o w a p p lic a b ili ty : - N o . R e g io n S e d im e n t B yp a ss T u n n e l S p e ci fi ca ti o n s D a m /R e se rv o ir S p e ci fi ca ti o n s C a tc h m e n t A re a (k m 2) T o ta l R e s e rv o ir C a p a c it y (1 0 0 0 m 3) A v e ra g e A n n u a l In fl o w W a te r V o l (1 0 0 0 m 3) A v e ra g e A n n u a l In fl o w S e d im e n t V o l (1 0 0 0 m 3) S e d im e n t C o n c e n tr a ti o n (% ) T u n n e l L e n g th (m ) In it ia l C o s t (¥ 1 0 0 m ill io n ) S e d im e n t D is c h a rg e U n it C o s t (¥ /m 3) S e d im e n t D is c h a rg e E ff ic ie n c y (% ) T u n n e l S lo p e (1 /N ) D e s ig n D is c h a rg e (m 3/s ) D e s ig n S p e c if ic D is c h a rg e (m 3/s /k m 2) T u n n e l D ia m e te r (m ) P ip e V e lo c it y (m /s )
4.4 Verifying the validity of outline plan investigation flowchart application results
Figure 3 shows the applicability investigation results derived from the outline plan investigation flowchart, plotted on a graph created by Sumi (2005) to present the relationship between reservoir characteristics (reservoir turnover rate, reservoir life) and the applicability of a sediment discharge method. From the graphed relationship between reservoir life (reservoir capacity (m3) / average annual inflow sediment volume (m3/year)) and 1/reservoir turnover rate (reservoir capacity (m3) / average annual inflow water volume (m3)), it can be discerned that, as reservoir life becomes shorter and the reservoir turnover rate becomes higher, the sediment discharge methods can be classified in this order: measure not needed, check dam and sediment replenishment, sediment discharge bypass, and sediment flushing (sluicing). Dams that were assessed by the outline plan investigation flowchart to have applicability are concentrated within a range with high applicability of sediment discharge bypass. Accordingly, the results derived from the flowchart can be considered largely reasonable.
CAP: water storage capacity (m3). MAR: average annual inflow water volume (m3/year). MAS: average
annual inflow sediment volume (m3/year)
Figure 3: Reservoir turnover rate as well as reservoir life and sediment discharge method
4.5 Analysis of the main factors impacting a finding of applicability
The primary reason for an assessment of low applicability was tunnel diameter, which was associated with 11 dams. A breakdown of these 11 dams shows seven dams with a tunnel diameter of D<3m and four dams with a tunnel diameter of D>10m. With the seven dams having a tunnel diameter of D<3m, both the initial cost (project cost) and the sediment discharge unit cost satisfy the limiting conditions, and therefore it can be judged that there is no problem regarding implementation of the project. For that reason, we
10 100 1000 10000 100000 0.001 0.010 0.100 1.000 10.000 R es erv oir lif e = C AP/ M AS
1/Reservoir turnover rate = CAP/MAR
: Check dam : Sediment flushing : Sediment discharge gate : Sediment discharge pipe : Sediment discharge bypass : Land excavation
: Dredging
: Low applicability (investigated dam) : Applicable (investigated dam)
Check dam and sediment replenishment
Measure not needed (due to internal reason)
Sediment flushing (sluicing) Sediment discharge
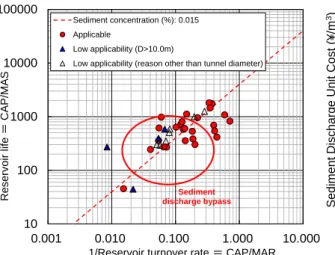
thought that more reasonable results could be obtained by eliminating the lower limit for tunnel diameter. When re-evaluating the applicability of sediment bypass tunnels based on this determination, 26 of 37 dams had applicability, and 16 of these dams are included in the area within which the applicability of a sediment discharge bypass is high as shown in Figure 4. Furthermore, when focusing attention on the relationship between the applicability assessment result and sediment concentration (= average annual inflow sediment volume / average annual inflow water volume × (1.0-0.4)), dams with sediment concentration of 0.015% or more yielded an assessment result of applicability, except for one dam. From this finding, it was determined that sediment concentration could be one of the decision benchmarks for applicability. When we analyzed what kind of limiting condition could be indexed by sediment concentration, the correlation to sediment discharge unit cost, as shown in Figure 5, provided higher relevance than other limiting factors. This is because, when positing a somewhat equivalent size for the sediment bypass tunnels of the various dams, a high sediment concentration increases the sediment discharge volume and lowers the sediment discharge unit cost. Moreover, if the sediment concentration falls below 0.02%, the variance in sediment discharge unit cost becomes larger. This is because other factors related to the initial cost (project cost), such as tunnel length, have a large impact on sediment discharge unit cost. Based on the above determination, and on the fact that tunnel slope was the second leading factor, after tunnel diameter, for a finding of low applicability, it can be thought difficult to judge the suitability of a sediment bypass tunnel based solely on sediment concentration. However, with our primary evaluation we determined that dams with sediment concentration above 0.015% have applicability. For dams falling below this value, we thought that it would be possible to determine applicability based on an investigation of structural specifications such as tunnel slope, tunnel length, and tunnel diameter.
CAP: water storage capacity (m3). MAR: average annual inflow water volume (m3/year). MAS: average annual inflow sediment volume (m3/year)
Figure 4: Reservoir turnover rate, reservoir life, sediment concentration, and sediment bypass tunnel applicability assessment results
Figure 5: Relationship between sediment concentration and sediment discharge unit cost 10 100 1000 10000 100000 0.001 0.010 0.100 1.000 10.000 Res ervoi r life = CAP /M AS
1/Reservoir turnover rate = CAP/MAR Sediment concentration (%): 0.015
Applicable
Low applicability (D>10.0m)
Low applicability (reason other than tunnel diameter)
Sediment discharge bypass 0 1000 2000 3000 4000 5000 6000 0.00 0.02 0.04 0.06 0.08 S e d im e n t Di sch a rg e Un it Co st (¥ /m 3) Sediment concentration
(= average annual inflow sediment volume / average annual inflow water volume × (1.0-0.4))
0.015
Application range Sediment discharge unit cost decreases when sediment concentration increases
5 Conclusions
With this research, in line with our purpose of performing a general and systematic primary evaluation of the applicability of sediment bypass tunnels, we created an outline plan investigation flowchart and verified the suitability of that flowchart. As a result, dams assessed to have applicability were concentrated within a range in which the applicability of sediment discharge bypass was determined to be high based on the relationship between reservoir turnover rate and reservoir life. Accordingly, the results derived from the flowchart can be considered largely reasonable. However, we considered the possibility that more reasonable results might be obtained by eliminating the lower limit of D<3m for the tunnel diameter. We also suggested that sediment concentration, which is not considered in the flowchart, could also become a decision benchmark. Going forward, we will increase the number of dams to be investigated, proceed with verification and improvement of flowchart suitability, and continue to consider possibilities for new decision benchmarks.
Acknowledgement
This paper includes content taken from discussions at the Dam Sediment Management Research Committee organized by the Water Resources Environment Center, and we received much advice from committee members. At this time, we express our gratitude in writing.
References
Toshiyuki Sakurai, Josuke Kashiwai,Maki Oguro, :Sediment form of dam reservoir: Civil engineering journal 45-3, 2003
Tetsuya Sumi: Implementation of a thousand year dam in sediment control, Quarterly River Review,2005
Hideaki Ohori, Masato Ono, Yasufumi Takata, Gen Nagatani, Tetsuya Sumi: Case Analysis of Sediment Bypass Tunnels (Switzerland, Taiwan, Japan), 2nd International Workshop on Sediment Bypass Tunnels, 2017
Authors (Text style: Authors Address)
Eisei kitamura Masato Ono
Water Resources Environment Center (WEC) Email: [email protected]