行政院國家科學委員會專題研究計畫 成果報告
奈米晶粒錳酸鑭基薄膜之合成與電傳輸現象之研究
計畫類別: 個別型計畫 計畫編號: NSC92-2212-E-002-097- 執行期間: 92 年 11 月 01 日至 93 年 10 月 31 日 執行單位: 國立臺灣大學材料科學與工程學研究所 計畫主持人: 韋文誠 計畫參與人員: 陳彥友、許恆瑞、王聖璋 報告類型: 精簡報告 處理方式: 本計畫可公開查詢行政院國家科學委員會補助專題研究計畫
成果報告
奈米晶粒錳酸鑭基薄膜之合成與電傳輸現象之研究
計畫類別:個別型計畫
計畫編號:NSC 92-2212-E-002-097
執行期間:民國 92 年 11 月 01 日至 93 年 10 月 31 日
計畫主持人:韋文誠
計畫參與人員: 陳彥友、許恆瑞、王聖璋
成果報告類型(依經費核定清單規定繳交): □完整報告
執行單位:台大材料系
中文摘要
本研究共包括兩個部分,第一部分以溶膠凝膠合成法來製備多孔、純
質之錳酸鍶鑭(LSM)材料,使其具有高導電性及氧傳輸之特性,應用於固態
氧化物燃料電池之陰極。第二部份以類似之技術,製備氧化鋯固態電解質
薄膜。實驗採用聚丙烯酸(PAA)或 PVP 為高分子添加劑,經由適當之懸鍍、
乾燥過程及燒結處理,所得之薄膜樣品利用 X 光繞射技術、光學顯微鏡、
掃瞄及穿透式電子顯微鏡進行微結構觀察和定性量測。以四點式直流電電
阻法來進行不同形態薄膜之電性量測,以了解材料前趨物濃度,製程條件
對導電性質之影響。
關鍵詞:溶凝膠合成法、錳酸鑭、氧化鋯、薄膜、電性
(第一部份)
多孔奈米錳酸(鍶)鑭粉末的合成與燒結研究*
Synthesis and Sintering of Porous La
0.8Sr
0.2MnO
3Films
摘要
本研究以溶膠凝膠合成法來製備多孔、純質之錳酸鍶鑭(LSM)粉體, 用於燃料電池之陰 極材料。材料之製備以硝酸鹽為起始原料,並添加聚丙烯酸(PAA)做為晶相穩定劑,經 由適當之乾燥過程及熱處理,獲得不同結晶型態及粒度之奈米粉體。文中利用 X 光繞射 儀進行 LSM 粉末之相鑑定。微結構方面利用掃瞄及穿透式電子顯微鏡(SEM & TEM)進行 觀察和量測。實驗結果顯示,LSM 粉末製程中,利用(P)AA/LSM=2 之比例,可在 500
℃溫度下生成奈米級之純 LSM 結晶顆粒,在 1000o
C 以下的溫度仍保有多孔之特徵。
Abstract
In this research, La0.8Sr0.2MnO3 precursors were synthesized from metallic nitrates by
sol-gel method using polyacrylic acid (PAA) as the chelating to prepare pure and porous powders for the cathode application in solid oxide fuel cell (SOFC). The LSM powders after dried and sintered at suitable temperatures were characterized by X-ray diffractometry (XRD), scanning, and transmission electron microscopes (SEM and TEM). The LSM powder with nano-crystalline synthesized by adding (P)AA/LSM=2 was obtained after calcined at 500℃ for 2 h, and still kept porous character up to 1000oC.
1. 前言
錳酸鑭 (Lanthanum Manganite, LM)為一鈣鈦礦(ABO3)結構,該結構之氧化物具有
順電、壓電、光電及磁等特殊性質,近二、三十年來成為諸多功能材料研究開發之重點。 LM 材料中由於兩價 Sr 離子加入,取代三價 La 離子,形成含有電洞及金屬離子空缺之 固溶材料(簡稱 LSM)。另外,也會有過比例的氧原子含量,故 LSM 可應用其高溫電導 特性,來當作固態氧化物燃料電池(SOFC)之陰極材料[1],或應用其氧化反應催化的特 性 , 做 為 氣 體 偵 測 器 及 觸 媒 [2-3] , 亦 有 文 獻 中 報 導 LSM 因 具 有 巨 磁 阻 (giant magneto-resistive)的性質,被應用在記憶體方面[4]。 利用固態反應合成法是最為常見的鈣鈦礦結構氧化物之製備方法,在 Mori 等學者 之研究中[5]報導固相法需要較高之溫度煆燒,且合成之粒徑只達到微米級。除了固相 法,溶膠凝膠合成法(sol-gel synthesis method)是近十幾年研究之重點,溶膠凝膠法 合成之粉體具備奈米粒徑、高均勻性等優點。LSM 系統中多是利用金屬鹽類來當作其 起始的原料,像是醋酸鹽[6]或是硝酸鹽[7]等。此外,溶膠凝膠法為了形成良好的薄膜 特性,添加聚丙稀酸(poly(acrylic acid), PAA)[7]、聚乙烯乙醇[8](poly(vinyl alcohol), PVA)高分子,形成良好網狀結構,有利於形成緻密完整之薄膜。 溶膠凝膠法無論在粉末的合成或是薄膜的製備都是製備 LSM 之最適製程。在粉末 合成方面,溶膠凝膠法可在較低之溫度合成穩定結晶相,合成出之粉末具有良好均勻、 奈米級之粒徑尺寸。文獻中報導利用溶膠凝膠法來合成錳酸鍶鑭材料,其形成結晶相所 需溫度多在 500℃以下。在硝酸鹽-PAA 系統中[7],添加 PAA 使前驅溶液產生膠化,再 將凝膠在 400℃煆燒 6 小時即可得到錳酸鍶鑭的結晶相,其中 PAA 的含量對錳酸鍶鑭結 晶相的產生可說是一關鍵,但在文獻中並無清楚報導 PAA 的含量對於 LSM 結晶相生成 以及產生奈米顆粒的關係。 本研究中利用溶膠凝膠合成法來製備高純度、小粒徑、均質之粉末,為了提升粉體 的均質性,本實驗利用不同 PAA 為高分子添加劑,在 1000o C 以下製備出 LSM 粉末, 以各種微觀分析設備,瞭解其晶相生成以及燒結之特性。
2. 實驗步驟
Chemical, 東京,日本)為原料,以 0.8:0.2:1.0 莫耳比,配置 0.5, 1.0 及 2.0M 濃度之溶 液,再加入不同比例之聚丙烯酸(Polyacrylic acid, PAA, 分子量 8000~12000, Aldrich Chemical Co )後,混合 30 min。然後在烘箱中以 105℃溫度乾燥,將所得的粉末進行熱 分析實驗(DTA, Thermal Analyst 2000, DuPont Co., USA),並在不同溫度下進行煆燒,利 用 X 光繞射分析儀(Philips PW1710, Philips Co., Netherlands),判斷各溫度下錳酸鑭結晶 相是否生成,以及殘留之雜相。研究中並以穿透式電子顯微鏡(TEM, JEOL 100CX Ⅱ,
Japan),進行粉末粒徑及型態之觀察。
燒結試驗則將 500℃、6h 煆燒完之 LSM 粉末,以乾壓的方式來成型,預壓壓力為 60MPa,持壓 30 秒後以 120MPa 的壓力持壓 1 分鐘,得到直徑 1 公分的圓片狀試片,生 胚密度為 22~40%T.D.。將乾壓成型之圓片狀試片使用熱機分析儀(TMA, SETSYS TMA 16/18, SETRAM Co., Calurie, France)測試其燒結收縮之曲線,或在常壓下燒結圓片試 片,以 10℃/min 的升溫速率,加熱至 1000~1500℃持溫 8 小時,再以每分鐘 30℃的速 率在爐中冷卻至室溫,試片之密度以阿基米德法量測。
3. 結果與討論
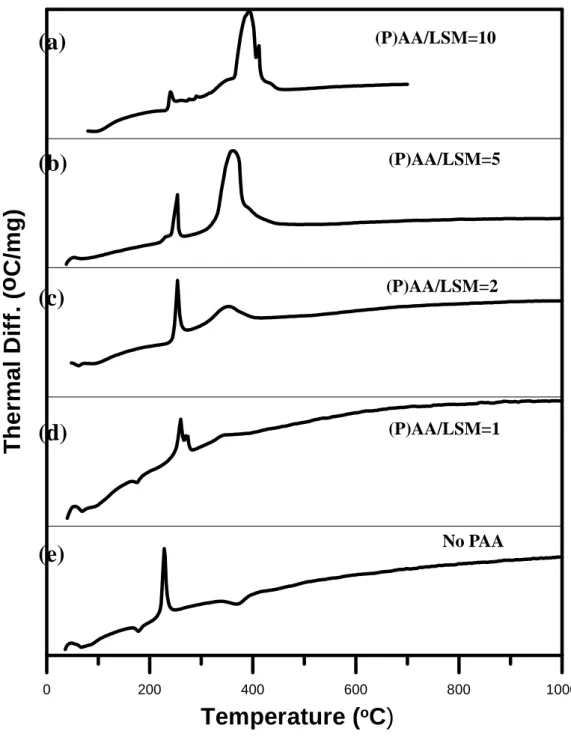
3.1 PAA 對 LSM 晶相合成之影響 PAA 之添加為影響其結晶溫度、粉末性質之重要因素,因此本實驗以不同之 (P)AA/LSM 比例合成 LSM 粉末,利用熱差及熱重分析(DTA/TGA)來測定粉體熱分解 行為,進一步探討 PAA 的添加量對 LSM 合成反應之影響。 實驗將添加不同分子莫耳比 (P)AA/LSM 比例(1:1~10:1)之合成粉末,經 105o C 乾燥後,進行熱重分析,結果如圖 1 所示。未添加 PAA 之純 LSM 在 230℃溫度時有一 放熱峰,添加 PAA 之後放熱峰的位置則出現在 240℃左右。Taguchi 等人[7]之 DTA 實驗MnCO3和 MnO(OH)之結晶相生成。因此,由室溫至 300℃可能發生下述反應:
2Mn(NO3)2+ H2O → 2MnO(OH) + 4NO2(g)+
2 1 O2(g) (1) 3MnO(OH) → Mn3O4+ 2 3 H2O+ 4 1 O2(g) (2) 2MnO(OH) + 2 1 O2(g) → 2MnO2+ H2O(g) (3) 當煆燒溫度提高到 400℃,持溫 6 h 之後,XRD 相鑑定結果顯示生成 La(OH)3和 LaO(OH)之結晶相,其反應可能循下面式(4)或(5)進行脫除硝酸及水氣。原有錳之氧化物 及氫氧化物消失。在此溫度下,LSM 結晶相尚未生成。
2La(NO3)3+ H2O → 2LaO(OH) + 6NO2+
2 3 O2(g) (4) LaO(OH) + H2O → La(OH)3 (5) 將煆燒溫度提高至 500℃,此溫度下氫氧化鑭產生去水(dehydration)反應,生成氧化鑭 La2O3,如式(6)所顯示,此反應為一吸熱反應。 2La(OH)3 → La2O3+ 3H2O △H = 128.9 kCal/mol (6)
但圖 1 DTA 曲線(e)在 380~400℃即有一吸熱峰,猜測此反應應為 La(OH)3生成 La2O3所
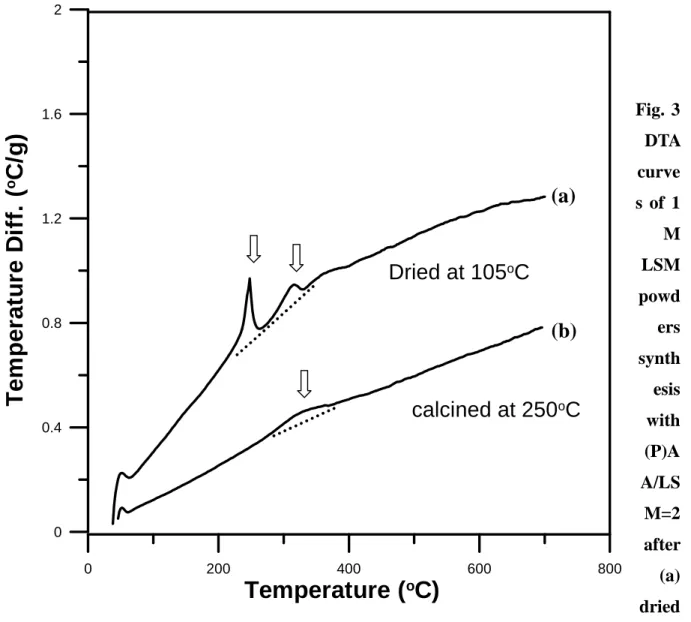
造成,與 Taguchi[7]提到 400℃之吸熱反應為鈣鈦礦結構結晶化所形成並不相同。圖 1 中僅有曲線(e)在 400℃有放熱反應的生成,其餘添加 PAA 之粉末樣品皆為放熱反應,故 在 400℃反應並非 LSM 鈣鈦礦之結晶化溫度。 為 確 定 230~260 ℃ 之 放 熱 反 應 為 NO2 揮 發 所 造 成 , 將 105 ℃ 乾 燥 完 的 LSM((P)AA/LSM=2)粉末在 250oC 進行熱處理,在加熱過程中發現有紅棕色之氣體揮 發,待紅棕色氣體逸出後,將所得之粉末再度進行 DTA 熱分析,得到結果圖 3。在圖 3 中,兩條曲線相較,因為前 250℃熱處理,曲線(a)在 250℃之放熱峰而不出現在曲線(b) 中,在 300o C 之放熱峰則是 PAA 分解所產生,相對強度經過前熱處理後有減弱的趨勢。 圖 1 中添加不同(P)AA/LSM 比例之 DTA 曲線中皆有兩個放熱反應,在 230- 270℃ 時都有一較狹窄的放熱峰,確認為 NO2氣體逸出之放熱反應;另一放熱反應則產生在 350 ℃~500℃的溫度範圍,隨著 PAA 比例的增加放熱反應愈劇烈,且反應溫度愈高,經由
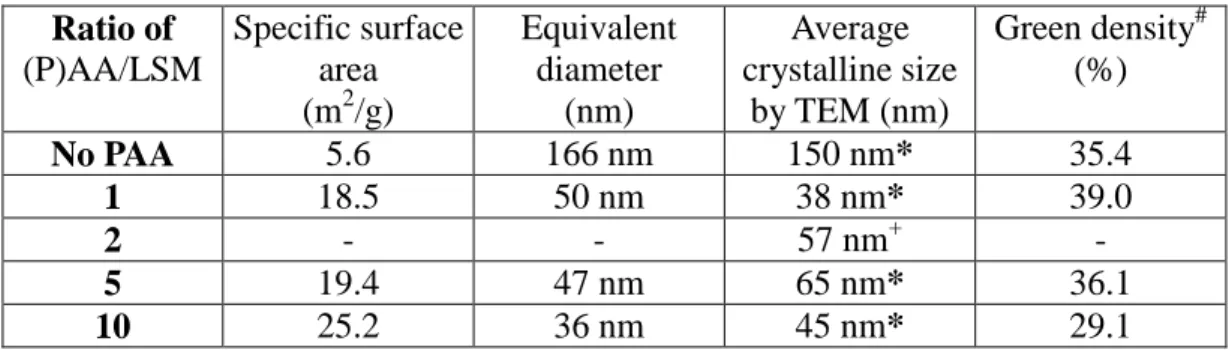
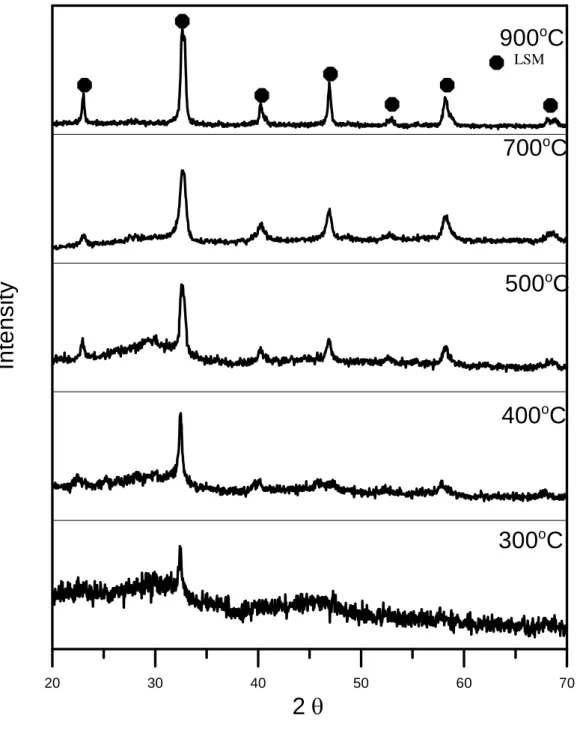
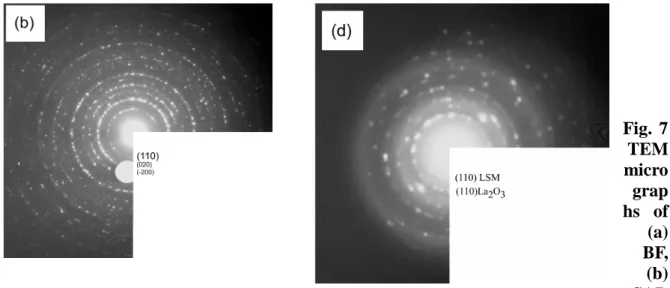
添加 PAA 有助於 LSM 相的生成,但不同比例的添加量對其反應亦有影響。圖 4 顯 示當(P)AA/LSM=1 時,可以在 300℃就有少量 LSM 晶相的出現,但還有非晶相的鑭鍶 錳混合物,隨著溫度高於 400℃,除了 LSM 外,還出現非常少量的 La2O3晶相,而且到 1000o C 仍有殘留。可是當(P)AA/LSM 比例增加到 2 時(圖 5),也是在 300℃有少量 LSM 結晶相生成,混在非晶質態的基材之中,400℃持溫 6 小時後就只有單一的 LSM 相。當 (P)AA/LSM 比例增加到 10 後(圖 6),經由適當的溫度(>700oC)處理後亦可得到單一的 LSM 相,但需要的煆燒溫度會因高分子比例的增加而提高。故(P)AA/LSM 比例大於 2 皆可得到單一之 LSM 相,但高分子含量過多時,結晶化的溫度則會提高,這可能與 PAA 分子結構有關,其功能鍵可以固定不同金屬離子,在 PAA 在 230o C 分解前,仍然能夠提 供均質混合之功效,因此可以有效降低 LSM 結晶溫度。但當 PAA 含量過多時,PAA 分子 則會包覆金屬分子團,在煆燒時,需將外圍之高分子燒除,方能進一步使 LSM 相結晶 化,故反而提高 LSM 之結晶化溫度。所以在合成 LSM 粉末過程,(P)AA/LSM=2 是一 個較適宜的比例。 3.2 奈米晶粒與燒結 將(P)AA/LSM=2 及不加 PAA 的兩個配方所合成之粉末,經由 500℃或 700o C、6 小 時煆燒後,進行 TEM 微結構觀察,所得結果如圖 7 所示,在圖 7(a)中可以觀察到 LSM 晶粒尺寸約為 57 nm 左右,已有部分聚結的現象發生,聚結粒呈現多孔特性,大小超過 0.5m 以上,但觀察到的聚結粒粒徑和 TEM 樣品以碳膜取樣的條件有關,一般可以觀察 到多孔的聚結粒由數十 nm 的晶粒所組成。反觀不加 PAA 的粉體呈現緻密的顆粒,幾乎 沒有孔洞,組成之晶粒都較大(圖 7(c)),LSM 晶粒可以長到 150 nm,而且混有數十 nm 的氧化鑭顆粒。
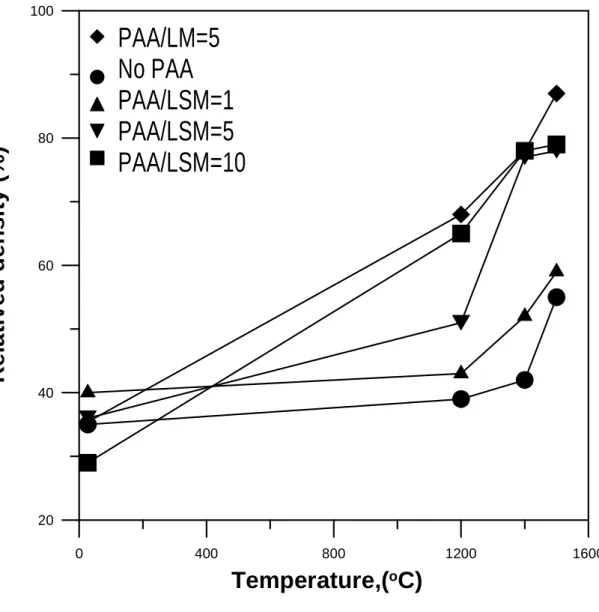
在 1000o C 以上才有明顯之收縮,到達 1400oC 之總收縮量也隨著 PAA 含量的增加而增 加。故在 500℃下煆燒 6 小時,雖可去除所有的 PAA,但粉粒之微結構仍受 PAA 的影 響,粉粒形成不同孔隙率及聚結情況。圖 8 曲線(a)和(b)測試至 1400℃之收縮量幾乎相 同;曲線(c)及(d)之起始燒結溫度也隨著 PAA 含量增加而下降,分別為 1000 及 850℃, 相信是受到聚結粒結構之影響,添加之 PAA 量越多,晶粒越小,聚結粒孔隙越多,越 能保有奈米顆粒之低溫燒結優點。 接著,將試片在不同燒結溫度下(1200℃、1400℃、1500℃)燒結 8 小時,來觀察 其燒結現象,結果如圖 9 所示。在 1400℃下,所有試片之相對密度皆維持在 70%以下; 未 添加 PAA 及添加少量 PAA 之 LSM 粉末經過 1200o C 長時間燒結還是維持生胚時之密 度,即使將燒結溫度提高至 1500℃,(P)AA/LSM=0 和 1 兩配方之試片密度仍然只有<60 %T.D.,其餘試片密度都達 80%。 將 1500o C 燒結 8 小時之試片進行研磨、拋光之步驟後,在 1300℃下作熱侵蝕(thermal etching)30 分鐘,觀察其微結構。圖 10(a)之燒結樣品密度較低(55% T.D.),平均晶粒 尺寸則為 2.1μm; 在(P)AA/LSM=5 及=10 條件下的兩個 LSM 塊材試片(圖 10(b)及(c)) 有晶粒成長的現象,孔隙率也只有<20%。由文獻[11]中知道一般固相法中 LSM 需在 1500 ℃下燒結 24~36 小時方能達到 90%的相對密度,而利用溶膠凝膠合成法所製備之乾壓胚 體則似乎沒有燒結曲線這方面的研究成果可供比對。在本研究中添加 PAA 之 LSM 粉末 合成方式和固相法的結果有明顯差異,添加 PAA 合成出來出來 40~65 nm 的 LSM 粉末, 奈米晶粒間在低溫(≦500℃)皆已燒結成近微米、多孔之粉粒,但隨著 PAA 含量的增 加,在相同燒結條件下,可得到均質多孔之胚體。 4. 結論 本研究採用溶凝膠法,使用硝酸鹽為起始原料,添加或不添加 PAA 高分子助劑, 調製分子級混合溶液。溶液乾燥後,得到之合成粉體經過去除硝酸及去水等一連串之高 溫反應,以及後續之高溫結晶過程,形成多孔、高表面積之粉體,該粉體在 700o C 處理 及在 1200o C 燒結 8 小時,仍保有 40%T.D.狀態。以下將研究中得到的重要結果報導。 1. 未添加 PAA 之粉體,在 500℃熱處理條件下,先形成錳之氫氧化物及氧化
固定鑭、鍶、錳金屬離子,因此煆燒 PAA 過程中,均無各金屬離子的氫氧 化物生成。如果(P)AA/LSM>2,可以在 300o C 開始生成 LSM 結晶,>500o C 的溫度就可以得到接近純的 LSM 樣品。
3.
利用溶膠凝膠合成法的 LSM 粉末經由 500℃、6 小時的煆燒,可得到數十 奈米晶粒等級的粉末,且已有初步燒結的現象,粉粒呈現多孔、聚結的結 構。4.
粉粒粒徑及聚結狀態對於燒結階段為一重要因素。實驗中 PAA 含量增加, 得到的立體阻隔現象越明顯,合成之粉末粒徑愈小,聚結粒表面積較高, 在 1000o C 長時間處理或是 1200oC 長達 8 小時燒結,使用 PAA 之燒結胚體 仍能保有多孔均質的特性,其密度約只有 40%T.D.。5.
當(P)AA/LSM=5 及 10 之粉體樣品在 1500℃、8 小時燒結之後,可得到 80%的燒結 密度,(P)AA/LSM 比例愈低,燒結密度愈差,未添加 PAA 所合成之粉末燒至 1500o C 僅 有 60%T.D.的密度。5. 參考文獻
1. J.V.Herle,A.J.McEvoy,and K.R.Thampi,“A Study On The LSM Oxygen Cathode,”
Electrochimica Acta, Vol. 41, No. 9, 1447-1454(1996)
2. J.A.M.V.Roosmalen,E.H.P.Cordfunke,and R.B.Helmholdt,“The Defect Chemistry of LaMnO3: 2. Structure Aspects of LaMnO3,”J. Solid State Chem., 110, 100-105(1994)
3. G.Sinquin,J.P.Hindermann,and C.Petit,A.Kiennemann,“Perovskite As Polyvalent Catalysts For Total Destruction of C1, C2 and Aromatic Chlorinated Volatile Organic Compounds,”Catalysis Today, 54, 107-118(1999)
4. E.I. Tiffee, W. Wersing, and M. Schieβl, “Ceramic and Metallic Components for a Planar SOFC,”Phys. Chem., 94, 978-981(1990)
5. M.Mori,T.Hiei,T.Yamamoto,and H.Itoh,“Lanthanum Alkaline-Earth Manganites as a Cathode Material in High-Temperature Solid Oxide Fuel Cells,”J. Electrochem. Soc.,
146[11], 4041-4046(1999)
6. S. Bilger, E. Syskakis, A. Naoumidis, and H. Nickel, “Sol-Gel Synthesis of Strontium-Doped Lanthanum Manganite,”J. Am. Ceram. Soc., 75[4], 964-70 (1992)
7. H.Taguchi,D.Matsuda,and M.Nagao,“Synthesis of Perovskite-Type LSM at Low Temperature,”J. Am. Ceram. Soc., 75[1], 201-202(1992)
8. Y. Shimizu, and T. Murata, “Sol-Gel Synthesis of Perovskite-Type Lanthanum Manganite Thin Films and Powders Using Metal Acetylacetonate and Poly(vinyl alcohol),”J. Am. Ceram. Soc., 80[10], 2702-704(1997)
9. A.Chakraborty,P.S.Devi,S.Roy,and H.S.Maiti,“Low-Temperature Synthesis of Ultrafine LSM Powder by an Autoignition Process,”J. Mater. Res., Vol. 9, No. 4, 986-991(1994)
10. J. H. Kuo, and H. U. Anderson, “Oxidation-Reduction Behavior of Undoped and Sr-Doped LaMnO3: Defect Structure, Electrical Conductivity, and Thermoelectric
Power,”J. Solid State Chem., 87, 55-63(1990)
11. H.Taguchi,D.Matsuda,and M.Nagao,“Surface Characterization of LSM Synthesized Using a Sol-Gel Process and Solid-State Reaction,”J. Mater. Sci. Lett., 14, 12-14(1995)
Table 1 Characteristics of LSM powders after calcined at 500℃ or 700℃for 6 h Ratio of (P)AA/LSM Specific surface area (m2/g) Equivalent diameter (nm) Average crystalline size by TEM (nm) Green density# (%) No PAA 5.6 166 nm 150 nm* 35.4 1 18.5 50 nm 38 nm* 39.0 2 - - 57 nm+ -5 19.4 47 nm 65 nm* 36.1 10 25.2 36 nm 45 nm* 29.1
Note *:calcined at.700
oC/6 h
+: calcined at 500℃/6 h
0 200 400 600 800 1000
Temperature (
oC)
T
h
e
rm
a
l
D
if
f.
(o
C
/m
g
)
Fig. 1 DTA curves of 1 M LSM powder synthesized with various molar ratio of
(P)AA/LSM (a) 10, (b) 5, (c) 2, (d) 1, and (e) no PAA. The heating rate is 10oC/min.
(a)
(b)
(c)
(d)
(e)
(P)AA/LSM=10 (P)AA/LSM=1 (P)AA/LSM=2 (P)AA/LSM=5 No PAAFig. 2 X-ra y Diff racti on patt erns of 1 M LS M pow der synt hesi zed with out PAA, whic 20 30 40 50 60 70
2
300
oC
In
te
n
s
it
y
400
oC
700
oC
500
oC
900
oC
LSM LSM Mn3O4 MnO2 MnO(OH) La(OH)3 LaO(OH) La2O3 MnCO3Fig. 3 DTA curve s of 1 M LSM powd ers synth esis with (P)A A/LS M=2 after (a) dried at 105℃, (b) calcined at 250℃.
(a)
(b)
0 200 400 600 800Temperature (
oC)
0 0.4 0.8 1.2 1.6 2T
e
m
p
e
ra
tu
re
D
if
f.
(
oC
/g
)
Dried at 105
oC
calcined at 250
oC
20 30 40 50 60 70
2
300
oC
400
oC
500
oC
700
oC
900
oC
In
te
n
s
it
y
LSM La2O320 30 40 50 60 70
2
300
oC
400
oC
500
oC
700
oC
900
oC
In
te
n
s
it
y
Fig. 5 X-ray diffraction pattern of 1 M LSM powder with (P)AA/LSM=2, which was
calcined at 300℃~900oC for 6 h.
20 30 40 50 60 70
2
300
oC
500
oC
600
oC
700
oC
900
oC
In
te
n
s
it
y
LSMFig. 7 TEM micro grap hs of (a) BF, (b) SAD P of 1 M LSM powders synthesized by adding (P)AA/LSM=2, which was calcined at 500 ℃ for 6 h, (c) CDF, and (d) SADP of the sample without PAA, calcined at 700℃ for 6 h.
0 400 800 1200 1600
Temperature(
oC)
50 60 70 80 90 100 110L
in
e
a
r
S
h
ri
n
k
a
g
e
(%
)
(a) No PAA
(b) PAA/LSM=1
(c) PAA/LSM=5
(d) PAA/LSM=10
(a)
(b)
(c)
(d)
0 400 800 1200 1600
Temperature,(
oC)
20 40 60 80 100R
e
la
ti
v
e
d
d
e
n
s
it
y
(%
)
PAA/LM=5
No PAA
PAA/LSM=1
PAA/LSM=5
PAA/LSM=10
Fig. 9 Relative density as a function of sintering temperature. Samples with various ratios of (P)AA/LSM are sintered at specified temperature for 8 h.
(b)
(第二部份)
Processing and Characterization of Ultra-Thin Yttria Stabilized Zirconia
Electrolytic Films for SOFC
Abstract
Sub-micron yttria stabilized zirconia (YSZ) electrolyte layer was prepared to a thickness less
than 1 m by liquid state deposition method to improve the performance of made solid oxide fuel cell (SOFC). A spin coating of YSZ precursor, containing yttrium and zirconium species
and a polyvinylpyrrolidone (PVP) additive, was applied on a Ni/YSZ anode substrate. Several
properties, including crystal phase, microstructure, current-voltage (I-V) curve, were
investigated. The 4-mol% Y2O3doped YSZ (4YSZ) consisted of cubic, tetragonal, and a trace
of monoclinic phases appeared crack-free and outstanding electric properties. The cell testing
of 4YSZ coating samples showed a power density of 684 mW/cm2 at 800oC. The surface
crack of other YSZ coating samples (e.g. 8YSZ) can be repaired by multi-coating method.
1. Introduction
In the past two decades, there were four major configurations developed for SOFC. The structures were either sealless tubular, segmented-cell-in-series, monolithic, or planar type. [1] Because of easy processing and sealing, the sealless tubular and planar-type structures were popular as the subject of several SOFC research works. [2] The original design of a single cell was an electrolyte support structure with cathode and anode on the opposite sides. However, due to a highly internal ohmic resistance of the electrolyte, the ionic conductivity decreased while decreasing operation temperature. Therefore, the operating temperature of electrolyte supported FC was limited at the temperatures of 800~1000oC. Therefore, electrolyte layer is one of the key components to reach the aims of lowering operation temperature and increasing cell efficiency. Besides, the replacement of ZrO2 with any high conductivity
electrolyte materials and reducing the thickness of the electrolyte are two effective approaches to reduce the polarization effects of the layer. An anode support concept has been adopted in order to significantly reduce the thickness of the electrolyte to 30 m or less. [3,4] As a consequence, the operating temperature is possibly reduced to the range of 600~800oC or lower.
The methods to prepare an anode support SOFC can be classified into three categories. One is vapor-phase deposition, such as spray pyrolysis. Another is liquid-phase deposition, such as sol-gel methods. The other is particle deposition/consolidation*1, such as tape casting, screen printing methods, etc. [5] The vapor-phase deposition methods have high potentials to prepare thin electrolyte with a thickness less than 1 m, but show a disadvantage on processing cost. In contrast, the particle deposition/consolidation methods are popular and in-expensive among the methods. However, in concerning the issues of thickness reduction, the methods produce the scale of layer thickness on several micrometers. Among these
additive, poly-vinyl-pyrrolidone (PVP), were prepared and spin-coating on porous NiO/YSZ substrate to prepare submicron thin layer. Besides, the polymerizing agent, polyvinyl-pyrrolidone (PVP), was adopted in previous works, [8,9] and had successfully overcome the cracking problems of oxide coating layer. Therefore, in considering the requirements of the intactness of the electrolyte layer to prevent the cross linking of fuel and air, several attempts, such as using a multi-coating method, adding polymerizing agents in the formula, [6,7,8] were used in this study to overcome the problems.
2. Experimental
2.1 Sample preparation
Zirconium chloride hydroxide (ZrOCl2˙8H2O, NTHU, China), and yttrium chloride
hydroxide (YCl6˙6H2O, Acros Co., USA) were chosen as the sources of yttria and zirconia,
respectively. De-ionized water was the media, and an additive, PVP (Acros Co., USA), was
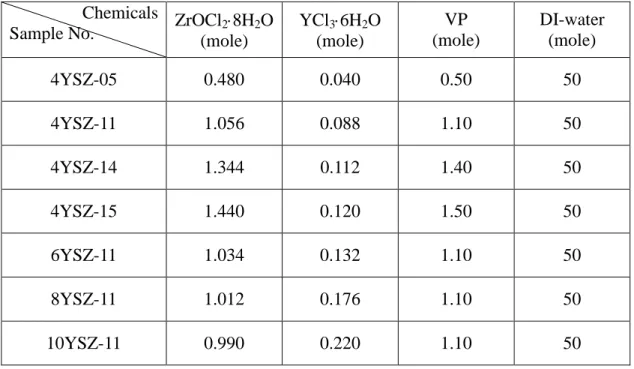
taken as a polymerizing agent. The compositions of precursors are listed in Table 1. The ratio
of yttria species to total oxide species (Y2O3+ZrO2) was formulated from 4 to 10 mol%. The
ratio of monomer of PVP to total oxide species was kept at unity. The molar concentrations of
total YSZ species in this research were selected between 0.5~1.5. After fully dissolved, the
precursors sol were spin-coating on porous NiO/YSZ substrates and dried at ambient
temperature for 1 day.
The NiO/YSZ substrates were prepared by tape casting method [10] and the thickness of
the tape was around 500 m. After dried, the samples were sintered at a heating rate of 10oC/min to 1300oC then holding for 1 h. Besides, the tape for cell testing was reduced by 5%
Philips Instrument Co., Netherlands). The sintered samples for XRD analysis were pulverized
first before analysis. The microstructure and elemental distribution were observed by
scanning electron microscope (SEM, Leo1530, England) equipped with energy dispersive
spectroscopy (EDS, EDAX Co., USA). The samples for SEM and EDS analysis were
prepared either a as-sintered surface, or a cross-section surface. The conductivity for the
investigations of I-V behaviors and power density of single cell were conducted by using a
current source (Model 224, Keithley Instruments Inc., USA), a digital voltmeter (Model 182,
Keithley Instrument Inc., USA), and a programmable linear power supply (LPS-305,
American Reliance Inc. USA). The cathode for cell testing used Pt/Pd paste which was
applied on sample surface by a painting method. The fuel, 5% H2/95% N2, for the testing of
cell performance was used at a flow rate of 100 ml/min, and the air was the oxidant.
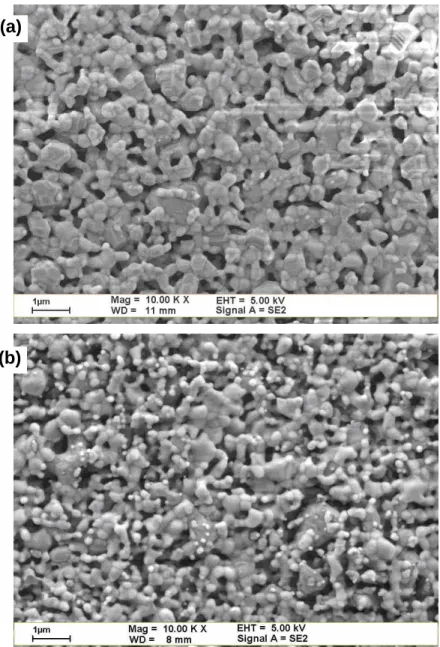
The microstructures of anode tape after sintered and reduced were shown in Fig. 1. The content of Ni phase in the anode was fixed at 40 vol% and appeared porous, which was in the range specified in literature. [1,3,11,12] In addition, the coefficient of thermal expansion (CTE) of the anode was measured by a thermal mechanical analyzer (TMA, Setsys TMA 16/18, Setram Co., France). The porosity of the anode were measured and calculated by Archimedes’method. Table 2 summarized and compared these anode properties with those in literature. The properties of the made anode tape in this study fulfilled the requirements of an anode-supported SOFC. [3, 12]
shows the detail XRD spectra in the ranges of 34o~36oand 59o~61o. Compared with the JCPD
files*2 of ZrO2, the broaden and unsymmetrical peaks consisted of t(110), c(200), m(002) in
34o~36oand t(211), m(131), m(203), c(222) in 59o~61o, respectively.
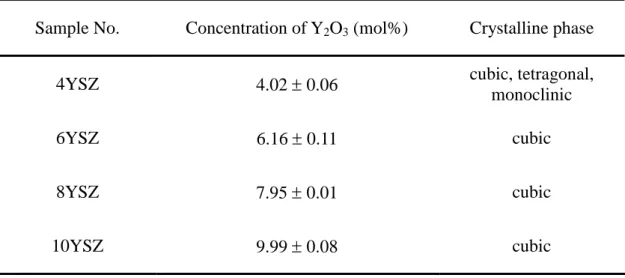
Arachi et al. reported that the phases of YSZ made by chemical precipitation method
with 5~6 mol% yttria doping contained cubic and tetragonal phases. [14] But in this study, the
tetragonal phase in the 6YSZ was not found. The disappearance of the tetragonal phase might
be due to the difference of Y2O3concentration. In order to precisely decide the concentration
of doping Y2O3 in YSZ samples, a quantitative EDS analysis method [15] was conducted.
Table 3 shows the results of the Y2O3 concentration in various YSZ samples. The
concentrations of the doping Y2O3 are in an acceptable range (+0.2%) to the select
concentration in the formula. The other report by Ramamoorthy et al. also indicated the
crystal phase of YSZ doped with 3, 4.5 and 6 mol% Y2O3 made by chemical precipitation
method. [16] It is no doubt that the crystal phase of 3YSZ is tetragonal. The results in
Ramamoorthy’s report showed a spectrum of the 4.5YSZ only with cubic phase. However,
the authors indicated it should be a mixture of cubic and tetragonal phases. The crystal phase
of 6YSZ was pure cubic and the same as the result in this study. An early report by
Kuzjukevics et al. reported the crystal phases of YSZ made by radio frequency plasma
method. [17] The 3.9YSZ sample appeared tetragonal, cubic and monoclinic phases, and the
6.2YSZ showed tetragonal and cubic phases. In summary, the crystal phases consisted of
cubic, tetragonal and a trace of monoclinic phases for 4YSZ, and a major in cubic phase for
6YSZ possibly with a minor of tetragonal phase were the possible equilibrium phases, but
top-view of the coating (Fig. 4(a)) shows dense features with a few cavities. The average grain size is about 0.59 m. From the microstructure of the cross-section in Figs. 4(b) and 4(c), a thin layer of dense 4YSZ appeared on the surface of the sample. Due to the illegible interface between the coating layer and substrate, the thickness of the coating layer was estimated about 0.5 m. Similar microstructures also appeared on a 4YSZ-11 coating sample. It was noted that the coating layer of 4YSZ only composed of one grain in thickness direction. The grain boundary of YSZ materials is usually in associated with residual amorphous silica. [18] This leads to the decrease of conductivity, especially at grain boundary. The contribution of electric resistivity by grain boundary was proven by the AC impendence measurement on YSZ materials. [16]
Fig. 5 shows the microstructures of the cross-section of a YSZ coating sample from 4YSZ-05 precursor solution. The dense layer in a thickness of ca. 35m was identified on the surface and next to porous substrate. A close examination (Fig. 5(b)) showed that this layer consisted of two kinds of grains. The dark gray regions belonged to NiO phase, and the light gray ones were the ZrO2phase. The formation of the dense di-phasic layer might be due to the
viscosity of the YSZ precursor, which showed a lower viscosity and resulted in the absorption of the precursor into the surface of anode substrate by capillary force during spin coating. When the concentration of precursor was higher than 1.5 M, the morphology of coating sample turned to porous, as shown in Fig. 6. The coating layer was around hundreds nanometers in thickness, but with significant porosity and serious cracking.
Another attempt in this study was changing the concentration of doping yttria. Fig. 7 shows the microstructures of the top view of those YSZ coating samples after heat treatment at 600oC. The coating samples showed some micro-cracks and were similar in morphology. Compared with the 4YSZ coating sample, these samples tended to form cracks possibly because of high concentration of doping yttria. When the concentration of doping yttria was
follows R-curve behavior and can enhance the fracture toughness. This toughening effect may prevent the growth of cracks on 4YSZ coating layer. But the 6YSZ or the YSZ samples with a higher doping content of yttria suffer the thermal stresses without the toughening.
3.3 Cell Testing
Among these YSZ coating samples, the 4YSZ-11 and 4YSZ-14 samples have a thin and
dense YSZ layer, which has the properties coincided with the requirements of SOFC. Fig. 8
shows the I-V curves and associated power densities of a single 4YSZ-11 cell as a function of
current density. The decrease of the cell voltage is consistent with the ohmic resistance
behavior. [3] The highest power density at 800oC and 600oC are 684 mW/cm2 and 477
mW/cm2, respectively. Although the Y2O3content of YSZ with the highest conductivity was
in the range of 8~10 mol%, [14, 20, 21], and the power density of the made single cell was
typically around hundreds mW/cm2 at operating temperature. The performance of the anode
support SOFC with 4YSZ electrolyte is much better than an 8YSZ electrolyte-support SOFC
at 800oC (Fig. 8(b)) in the similar testing conditions. The effects by the thickness of
electrolyte as well as the doping concentration of Y2O3 for YSZ electrolyte are notable. The
results also show that the reduction of the thickness to less than 1 m can greatly improve the power density of a single cell with a dense and thin 4YSZ electrolyte film.
4. Conclusion
A typical electrolyte material system of YSZ was adopted and used to prepare an ultra-thin film on Ni/YSZ anode substrate by liquid precursor method. The crystal phase of YSZ doped with 4 mol% Y2O3 consisted of cubic, tetragonal, and a trace of monoclinic
phases. The others with higher Y-doping showed cubic phase only. Among the coatings, a 4YSZ coating sample was made in crack-free state, and showed an average thickness of 0.5
The results of the cell testing of the 4YSZ coating sample show the best power density of 477 mW/cm2at 600oC and 684 mW/cm2at 800oC, respectively.
Acknowledgement
The authors would like to thank the funding given by National Science Council (NSC) in
Taiwan under grant number NSC92-2212-E-002-097, and NSC-DAAD summer program of
2002. The comments given by Prof. Andreas Roosen and helps from the colleagues at
Department of Materials Science, Friedrich- Alexander- University Erlangen- Nuremberg in
References
1. N.Q. Minh, “Ceramic fuel cells,”J. Am. Ceram. Soc., 76 (1993) 563-88.
2. F. Tietz, H.-P Buchkremer, and D. Stover, “Components manufacturing for solid oxide fuel cells,”Solid State Ionics, 152-153 (2002) 373-381.
3. Fuel Cell Handbook, 6thed., EG&G Services Parsons, Inc. issued by U.S. Department of Energy, 2002.
4. A. Weber, and E. Ivers-Tiffée, “Materials and concepts for solid oxide fuel cells (SOFCs) in stationary and mobile applications,”J. Power Sources, 127 (2004) 273-283.
5. J. Will, A. Mitterdorfer, C. Kleinlogel, D. Perednis, and L.J. Gauckler, “Fabrication of thin electrolyte for second-generation solid oxide fuel cells,”Solid State Ionics, 131 (2000) 79-96.
6. C. Xia, S. Zha, W. Yang, R. Peng, D. Peng, and G. Meng, “Preparation of yttria stabilized zirconia membranes on porous substrate by a dip-coating process,”Solid State Ionics, 133 (2000) 287-294.
7. T. Suzuki, I. Kosacki, and H. U. Anderson, “Electrical conductivity and lattice defects in nanocrystalline cerium oxide thin films,”J. Am. Ceram. Soc., 84 (2001) 2007-14.
8. Y. Y. Chen, and W. C. J. Wei, “Formation of mullite thin film via a sol-gel process with polyvinylpyrrolidone additive,”J. Europ. Ceram. Soc., 21, 2535-40 (2001).
9. H. Kozuka, and M. Kajimura, “Single-step dip coating of crack-free BaTiO3films > 1 mm
thick: effect of poly(vinylpyrrolidone) on critical thickness,”J. Am. Ceram. Soc., 83 (2000) 1056-62.
10. M. Wagner, A. Stiegelschmitt, and A. Roosen, “Mehrlagen-Foliengiessen zur direkten Herstellung geschichteter keramischer Verbundstrukturen und Untersuchung ihrer mechanischen Eigenschaften,“Keramische Zeitschrift, 52 (2000) 490-95.
11. .D.-S Lee, J.-H. Lee, J. Kim, H.-W. Lee, and H.S. Song, “Tuning of the microstructure and electrical properties of SOFC anode via compaction pressure control during forming,”
Solid State Ionics, 166 (2004) 13-17.
12. W. Z. Zhu, and S.C. Deevi, “A review on the status of anode materials for solid oxide fuel cells,”Materials Science and Engineering, A362, (2003) 228-239.
zirconia polycrystals (TZPs),”J. Europ. Ceram. Soc., 22 (2002) 199-207.
16. R. Ramamoorthy, D. Sundararaman, and S. Ramasamy, “Ionic conductivity studies of ultrafine-grained yttria stabilized zirconia polymorphs,”Solid State Ionics, 123 (1999) 271-278.
17. A. Kuzjukevics, S. Linderoth, and J. Grabis, “Characterization of yttria-doped zirconia powders produced by plasma-chemical method,”Solid State Ionics, 92 (1996) 253-260. 18. S.P.S. Badwal, J. Drennam and A.E. Hughes, “Segregation in oxygen-ion conducting solid
electrolytes and its influence on electrical properties,”Science of Ceramic Interfaces, edit by J. Nowotny, Elsevier Science Inc., (1991) p227
19. A. H. Heuer, “Transformation toughening in ZrO2-containing ceramics,”J. Am. Ceram.
Soc., Vol. 70 [10], 689-698 (1987)
20. M. Filal, C. Petot, M. Mokchah, C. Chateau, and J.L. Carpentier, “Ionic conductivity of yttrium-doped zirconia and the “composite effect”,”Solid State Ionics, 80 (1995) 27-35. 21. I.R. Gibson, G.P. Dransfield, and J.T.S. Irvine, “Influence of yttria concentration upon
electrical properties and susceptibility to ageing of yttria-stabilized zirconias,”J. Europ.
Ceram. Soc., 18 (1998) 661-667.
22. C.-C. T. Yang, Processing and characterization of high temperature interfacial reactions
of electrolytic ceramics and electrodes of planar solid oxide fuel cell (SOFCs), Ph. D
Table 1 Formulation of YSZ precursors in this study
Chemicals
Sample No. ZrOCl(mole)28H2O YCl(mole)36H2O (mole)VP DI-water(mole)
4YSZ-05 0.480 0.040 0.50 50 4YSZ-11 1.056 0.088 1.10 50 4YSZ-14 1.344 0.112 1.40 50 4YSZ-15 1.440 0.120 1.50 50 6YSZ-11 1.034 0.132 1.10 50 8YSZ-11 1.012 0.176 1.10 50 10YSZ-11 0.990 0.220 1.10 50
Table 2 Property comparison of anode-supported substrates
Property This study* Current status [1, 3, 11, 12]
Composition 40 vol% Ni
Ni/YSZ cermet Ni/YSZ cermet
By process Tape Casting Tape Casting
or Die pressing
Porosity 31.5 vol% 20~40 vol%
CTE (cm/cmoC) 12.710-6 12.510-6
Conductivity 1321 S/cm (800oC) >100 S/cm
Table 3 Measured Y2O3 concentration and crystalline phases in the coated YSZ by
quantitative EDS and XRD methods
Sample No. Concentration of Y2O3(mol%) Crystalline phase
4YSZ 4.020.06 cubic, tetragonal,
monoclinic
6YSZ 6.160.11 cubic
8YSZ 7.950.01 cubic
Fig. 1 SEM micrographs of the top view of NiO/YSZ tapes, (a) as-sintered at 1300oC for 1
(a)
10 20 30 40 50 60 70 80 90 2 m c+t mc+t c+t+m c+t+m c+t c c c c c c c c c c 4YSZ 6YSZ 8YSZ 10YSZ
Fig. 2 XRD spectra of YSZ precursor powders with various Y2O3 concentrations after
calcined at 1300oC for 1 h. (c: cubic-phase zirconia, t: tetragonal-phase zirconia, and m: monoclinic-phase zirconia)
34 35 36 2 c(200) m(002) t(110) (a) 59 60 61 2 c(311) t(211) m(131) m(203) (b)
Fig. 3 XRD peaks of 4YSZ precursor powders at 34o~36oand 59o~61o.
Fig. 4 SEM micrographs of the cross-section of 4YZP-14 coating sample after sintering at
o
(a) (a)
(b)
Fig. 5 SEM micrographs of a 4YSZ-05 coating sample after sintering at 1300oC, (a) cross-section by SE image, (b) BSE image of the top area.
(a)
Fig. 6 SEM micrograph of one 4YZP-15 coating sample after heat treatment at 1300oC
Fig. 7 SEM micrographs of the top-view of various YSZ coating samples doped with different concentrations of yttria after heat treatment at 600oC, (a) 6YSZ-11, (b) 8YSZ-11, (c) 10YSZ-11 by one coating, and (d) 8YSZ-11 by three coatings.
.
(a)
(c)
(b)
0.0 0.5 1.0 1.5 2.0 2.5
Current Density (A/cm2)
0.0 0.2 0.4 0.6 0.8 1.0 1.2 C e ll V o lt a g e (V ) 0 100 200 300 400 500 600 700 P o w e r D e n s ity (m W /c m 2 ) 600oC 800oC 0.0 0.5 1.0 1.5 2.0 2.5
Current Density (A/cm2)
0.0 0.2 0.4 0.6 0.8 1.0 1.2 C e ll V o lt a g e (V ) 0 100 200 300 400 500 600 700 P o w e r D e n s ity (m W /c m 2 ) Electrolyte support Anode support
Fig. 8 I-V curves and associated power densities of 4YSZ-11 samples (a) testing at 600oC and 800oC, and (b) compared with an electrolyte-supported SOFC at 800oC. [22] .
(a)
![Table 2 Property comparison of anode-supported substrates Property This study* Current status [1, 3, 11, 12]](https://thumb-ap.123doks.com/thumbv2/9libinfo/8855888.243753/35.892.99.716.218.550/table-property-comparison-supported-substrates-property-current-status.webp)