On the Empirics of the Imbalance Effect
Petr Duczynski*
Department of Economics and Management, University of Hradec Králové, Czech Republic
Abstract
An important problem in the theory of economic growth is whether the growth of out-put per capita depends positively or negatively on the ratio of human to physical capital. This paper provides evidence that this dependence tends to be positive.
Key words: asymmetric imbalance effect; economic growth; human capital; physical capital JEL classification: O4
1. Introduction
One of the most important and interesting problems in the theory and empirics of economic growth is the dependence of the output growth on the ratio of human capital to physical capital. There is an imbalance effect between human and physical capital if the growth of output depends on the human-physical ratio. The imbalance effect is symmetric if it is represented by a symmetric U-shaped dependence: the growth is fast if the ratio of human to physical capital is significantly below or above its steady-state value. The imbalance effect is asymmetric if it is represented by an asymmetric U-shaped dependence or if the output growth depends uniformly positively or uniformly negatively on the human-physical ratio.
The theory of economic growth has ambiguous implications regarding the im-balance effect. Although there is no standard growth model in which the growth of output depends uniformly negatively on the human-physical ratio, one-sector en-dogenous growth models predict a U-shaped dependence of output growth on the ratio of human to physical capital (see Barro and Sala-i-Martin, 1995, p. 177). A similar prediction applies for the growth rate of output of physical goods in two-sector endogenous growth models (such as the Uzawa-Lucas model). However, for a broad concept of output (if the value of gross investment in human capital is added to the output of physical goods), the growth rate depends positively on the
Received August 22, 2002, accepted August 19, 2003.
*Correspondence to: Department of Economics and Management, Faculty of Informatics and
Manage-ment, University of Hradec Králové, Víta Nejedlého 573, 500 03 Hradec Králové, Czech Republic. E-mail: [email protected]. I would like to thank the Managing Editor and three anonymous referees for useful comments and suggestions.
ratio of human to physical capital (see Barro and Sala-i-Martin, 1995, p. 189). A similar asymmetric imbalance effect between human and physical capital can occur in a model with large adjustment costs for human-capital investment. The assump-tion of large adjustment costs for human capital is realistic—it is plausibly difficult to significantly speed up the process of learning. Elsewhere (Duczynski, 2002) I show that the growth rate of output depends positively on the ratio of human to physical capital in a one-sector open-economy model with large adjustment costs for changing human capital and small adjustment costs for changing physical capital. Models of technological diffusion (see Nelson and Phelps, 1966) are alternative models in which the growth rate of output depends positively on human capital. In these models, the speed of technology transfer is positively related to the techno-logical gap and the human-capital intensity.
From the empirical viewpoint, cross-country regression studies indicate that for a given level of output, economic growth increases with the human-capital level (see Barro and Sala-i-Martin, 1995, Chapter 12). These observations provide indirect evidence that growth depends positively on the ratio of human to physical capital. Additional inference can be made from case studies of economies with high or low human-physical ratios. This evidence is somewhat limited, but it is well known that postwar West Germany and Japan, which were left with high human-physical ratios, really grew rapidly. There also exists some evidence that growth was not fast in economies with low human-physical ratios (see Hirshleifer, 1987, Chapters 1 and 2, for a discussion of the Black Death).
This paper extends the existing evidence by examining the dependence of the per capita output growth between 1960 and 1990 on the initial human-physical ratio in a sample of 73 countries. As expected, the growth depends significantly positively on the initial human-physical ratio, hence furnishing supporting evidence of the asymmetry of the imbalance effect between human and physical capital.
The paper is organized as follows. Section 2 provides evidence for a positive dependence of economic growth on the initial ratio of human to physical capital. Section 3 examines the robustness of the asymmetric imbalance effect by using other explanatory variables. Section 4 focuses on three subperiods and the panel data. Section 5 concludes the paper.
2. The Key Empirical Evidence in a Cross Section
The analysis is focused on 73 countries for which I have data on real GDP per capita for 1960 and 1990, per capita human-capital estimates for 1960, and per cap-ita physical-capcap-ital estimates for 1960. The GDP data are taken from the Sum-mers-Heston data set, Mark 5.6 (see Summers and Heston, 1991, and the web site http://pwt.econ.upenn.edu/, RGDPCH variable). The estimates of human capital per capita are the total average years of schooling (in the population over 15 years), taken from the Barro-Lee data set (see Barro and Lee, 1996, and the web site http://www.worldbank.org/research/growth/ddbarle2.htm). Average years of school-ing are probably the best indicator of human capital, although they do not constitute
a perfect human-capital measure. The per capita physical-capital estimates are con-structed from the data collected by Nehru and Dhareshwar (see Nehru and Dhareshwar, 1993, and the web site http://www.worldbank.org/research/growth/ ddnehdha.htm). The Nehru-Dhareshwar data make it possible to compute the ratios of physical capital to output. I multiply these ratios by the RGDPCH variable from the Summers-Heston data set to obtain internationally comparable estimates of the physical capital stock per capita (expressed in 1985 U.S. dollars).
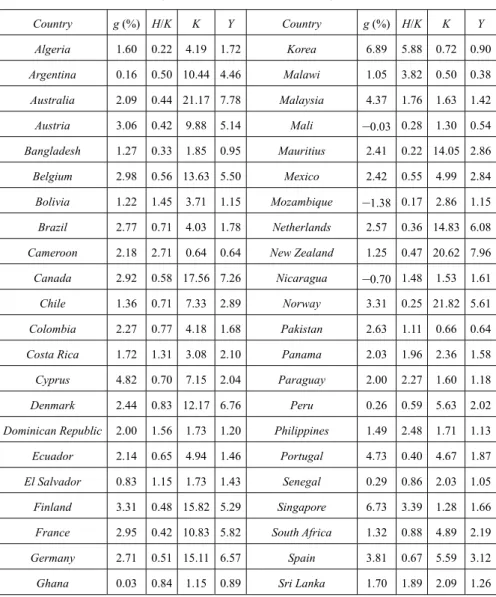
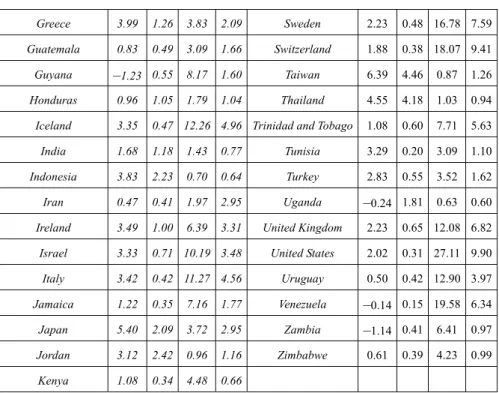
Table 1. The Average Annual Growth Rate of Output Per Capita between 1960 and 1990, the Initial Ratio of Average Years of Schooling to Physical Capital Per Capita (multiplied by 1000), the Initial Physical Capital Per Capita (in thousands of 1985 U.S. dollars), and the Initial Output Per Capita
(in thousands of 1985 U.S. dollars)
Country g (%) H/K K Y Country g (%) H/K K Y Algeria 1.60 0.22 4.19 1.72 Korea 6.89 5.88 0.72 0.90 Argentina 0.16 0.50 10.44 4.46 Malawi 1.05 3.82 0.50 0.38 Australia 2.09 0.44 21.17 7.78 Malaysia 4.37 1.76 1.63 1.42 Austria 3.06 0.42 9.88 5.14 Mali –0.03 0.28 1.30 0.54 Bangladesh 1.27 0.33 1.85 0.95 Mauritius 2.41 0.22 14.05 2.86 Belgium 2.98 0.56 13.63 5.50 Mexico 2.42 0.55 4.99 2.84 Bolivia 1.22 1.45 3.71 1.15 Mozambique –1.38 0.17 2.86 1.15 Brazil 2.77 0.71 4.03 1.78 Netherlands 2.57 0.36 14.83 6.08
Cameroon 2.18 2.71 0.64 0.64 New Zealand 1.25 0.47 20.62 7.96
Canada 2.92 0.58 17.56 7.26 Nicaragua –0.70 1.48 1.53 1.61
Chile 1.36 0.71 7.33 2.89 Norway 3.31 0.25 21.82 5.61
Colombia 2.27 0.77 4.18 1.68 Pakistan 2.63 1.11 0.66 0.64
Costa Rica 1.72 1.31 3.08 2.10 Panama 2.03 1.96 2.36 1.58
Cyprus 4.82 0.70 7.15 2.04 Paraguay 2.00 2.27 1.60 1.18
Denmark 2.44 0.83 12.17 6.76 Peru 0.26 0.59 5.63 2.02
Dominican Republic 2.00 1.56 1.73 1.20 Philippines 1.49 2.48 1.71 1.13
Ecuador 2.14 0.65 4.94 1.46 Portugal 4.73 0.40 4.67 1.87
El Salvador 0.83 1.15 1.73 1.43 Senegal 0.29 0.86 2.03 1.05
Finland 3.31 0.48 15.82 5.29 Singapore 6.73 3.39 1.28 1.66
France 2.95 0.42 10.83 5.82 South Africa 1.32 0.88 4.89 2.19
Germany 2.71 0.51 15.11 6.57 Spain 3.81 0.67 5.59 3.12
Greece 3.99 1.26 3.83 2.09 Sweden 2.23 0.48 16.78 7.59
Guatemala 0.83 0.49 3.09 1.66 Switzerland 1.88 0.38 18.07 9.41
Guyana –1.23 0.55 8.17 1.60 Taiwan 6.39 4.46 0.87 1.26
Honduras 0.96 1.05 1.79 1.04 Thailand 4.55 4.18 1.03 0.94
Iceland 3.35 0.47 12.26 4.96 Trinidad and Tobago 1.08 0.60 7.71 5.63
India 1.68 1.18 1.43 0.77 Tunisia 3.29 0.20 3.09 1.10
Indonesia 3.83 2.23 0.70 0.64 Turkey 2.83 0.55 3.52 1.62
Iran 0.47 0.41 1.97 2.95 Uganda –0.24 1.81 0.63 0.60
Ireland 3.49 1.00 6.39 3.31 United Kingdom 2.23 0.65 12.08 6.82
Israel 3.33 0.71 10.19 3.48 United States 2.02 0.31 27.11 9.90
Italy 3.42 0.42 11.27 4.56 Uruguay 0.50 0.42 12.90 3.97
Jamaica 1.22 0.35 7.16 1.77 Venezuela –0.14 0.15 19.58 6.34
Japan 5.40 2.09 3.72 2.95 Zambia –1.14 0.41 6.41 0.97
Jordan 3.12 2.42 0.96 1.16 Zimbabwe 0.61 0.39 4.23 0.99
Kenya 1.08 0.34 4.48 0.66
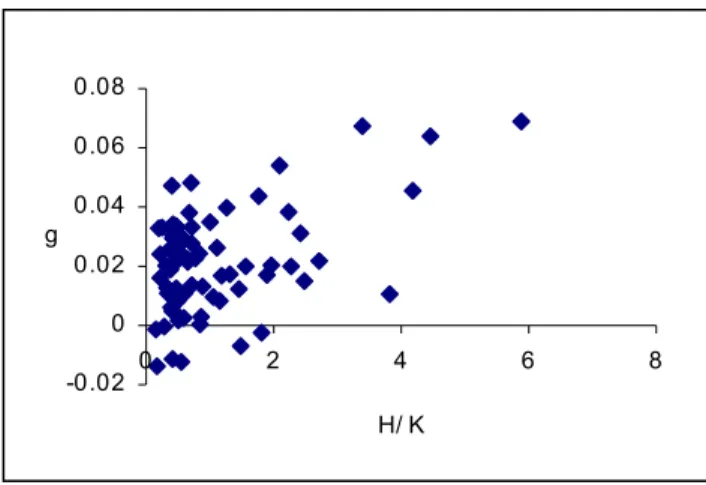
Table 1 presents the average annual per capita output growth rate between 1960 and 1990, g, the ratio of human to physical capital (multiplied by a factor of 1000) in 1960, H/K, the per capita physical capital stock in 1960, K (in thousands of 1985 U.S. dollars), and the output per capita in 1960, Y (in thousands of 1985 U.S. dollars). Figure 1 presents the dependence of g on H/K. The dependence is clearly positive, which can be seen from the following regression (t-statistics are in parentheses):
g = 1.34 + 0.75 H/K.
( 5.27) ( 4.57)
(1) The growth rate g is expressed in percentage terms, and the value of R2 equals 0.23. The Durbin-Watson statistic is 2.07 (the observations were ordered in increas-ing order of H/K), which indicates no autocorrelation. To check for heteroskedastic-ity, we use the Goldfeld-Quandt test (see Kmenta, 1997, p. 292) comparing the sum of squared residuals in the 30 observations with the lowest H/K and the 30 observa-tions with the highest H/K. The resulting F-statistic equals 1.24, which is clearly below the rejection value for homoskedasticity.
The sample average growth rate is 2.2 percent. The average growth rate of ten countries with the lowest H/K ratio is 1.3 percent. The average growth rate of ten countries with the highest H/K ratio is 3.8 percent. The positive dependence of g on
H/K reflects the fact that the H/K ratio in 1960 tended to be high in the fast-growing
Mauritius, Mozambique, Norway, Tunisia, and Venezuela. Except for Japan, the H/K ratio was below average in developed countries. The arithmetic average of H/K in the whole sample of 73 countries is 1.09 and the standard deviation equals 1.11. Figure 1. The Dependence of Per Capita Output Growth on the Ratio of Average Years of Schooling
to Physical Capital Per Capita
The dependence of g on H/K in Figure 1 is not U-shaped (although the growth rate is above the sample average for several countries with a low H/K ratio). This tendency is best seen if g is regressed on H/K in the sample of 36 countries with the lowest H/K ratio:
g = 1.10 + 1.46 H/K.
(1.26) (0.71)
(2) The dependence is positive but not significant. The value of R2 is 0.01. On the other hand, among the 37 countries with the highest H/K ratio, the dependence of g on H/K is significantly positive:
g = 1.22 + 0.79 H/K.
(2.61) (3.60)
(3) In this regression, the value of R2 equals 0.27.
3. Robustness Checks
One might want to examine whether the dependence of g on H/K is robust if conditioned on other explanatory variables. If conditioned on the initial per capita levels of H and K, the regression for the whole sample of 73 countries is
g = 0.39 + 0.78 H/K + 0.23 H – 0.00 K, (0.99) (3.89) (2.05) (–0.07) (4) -0.02 0 0.02 0.04 0.06 0.08 0 2 4 6 8 H/ K g
where K is measured in thousands of 1985 U.S. dollars. The value of R2 is 0.33 (ad-justed R2 = 0.30). The Durbin-Watson statistic is 2.16. The F-statistic in the Gold-feld-Quandt test is 1.03, which clearly indicates homoskedasticity. If conditioned on the initial level of output per capita (in thousands of 1985 U.S. dollars), the regres-sion takes the form
g = 0.45 + 0.95 H/K + 0.23 Y,
(1.17) (5.57) (2.91)
(5) where R2 is 0.31 (adjusted R2 = 0.29). The Durbin-Watson statistic is 2.10. The F-statistic in the Goldfeld-Quandt test is 1.10, clearly not rejecting homoskedasticity. If conditioned simultaneously on the initial levels of per capita human capital, physical capital, and output, the regression is
g = 0.38 + 0.79 H/K + 0.20 H – 0.03 K + 0.10 Y,
(0.95) (3.89) (1.61) (–0.40) (0.49)
(6) where R2 is 0.34 (adjusted R2 = 0.30). The Durbin-Watson statistic is 2.14. The F-statistic in the Goldfeld-Quandt test is 1.03, which is a clear symptom of ho-moskedasticity.
Also, one might want to worry about the quality of the physical-capital data. The correlation coefficient of per capita output and per capita capital in 1960 is 0.91, and the average capital-output ratio is 2.26 (with the standard deviation equal to 1.21), which is not unrealistic. Nevertheless, it may be useful to run regressions if physical capital is approximated by the level of output (82 observations):
g = 1.58 + 0.34 H/Y,
(5.11) (2.55)
(7) where R2 = 0.08. The dependence is less significant than that given by equation (1) primarily because the fast-growing Asian countries tended to have low ratios of physical capital to output in 1960. If conditioned on the initial per capita levels of H and Y (Y expressed in thousands of 1985 U.S. dollars), the dependence takes the form
g = 1.07 + 0.12 H/Y + 0.46 H – 0.32 Y,
(2.49) (0.70) (3.02) (–1.87)
(8) where R2 = 0.20 (adjusted R2 = 0.17). Since H/Y enters insignificantly in this regres-sion, one can conclude that the robustness of the positive dependence of g on H/K depends on the quality of the physical-capital data (in particular on the fact that the fast-growing Asian countries had low ratios of physical capital to output).
Another robustness check concerns the exclusion of outlying observations. We exclude the 5 observations with the highest H/K ratio (Korea, Malawi, Singapore, Taiwan, and Thailand). The dependence of g on H/K is then positive but insignificant:
g = 1.61 + 0.38 H/K,
(5.44) (1.37)
(9) where R2 is 0.03. Thus the significance of the positive dependence of g on H/K in equation (1) hinges critically on the performance of the countries with the highest
H/K (most of which are Asian tigers).
4. Shorter Periods and the Panel Data
It is of certain interest to examine the dependence of g on initial H/K for shorter time periods, such as 1960-1970, 1970-1980, and 1980-1990. For 1960-1970, the dependence takes the form
g = 2.52 + 0.45 H/K,
(7.81) (2.18)
(10) where R2 = 0.06. There are 77 observations. For 1970-1980, the dependence is
g = 1.75 + 0.78 H/K,
(3.88) (1.91)
(11) where R2 = 0.04. There are 80 observations. This dependence is only marginally significantly positive. For 1980-1990, the dependence is
g = 0.71 + 0.15 H/K,
(1.56) (0.27)
(12) where R2 is 0.001. There are 78 observations. The dependence is insignificant. The loss of the significant relationship is probably connected with the fact that H/K sub-stantially decreased over time in Asian tigers. In Korea, H/K was 5.88 in 1960, 2.52 in 1970, and 1.29 in 1980. In Singapore, H/K was 3.39 in 1960, 1.07 in 1970, and only 0.29 in 1980. In Taiwan, H/K was 4.46 in 1960, 2.17 in 1970, and 1.00 in 1980. In Thailand, H/K was 4.18 in 1960, 1.59 in 1970, and 0.90 in 1980.
Nevertheless, if we construct a panel by pooling the observations for 1960-1970, 1970-1980, and 1980-1990, we obtain a significant relationship:
g = 1.47 + 0.70 H/K,
(6.23) (3.58)
(13) where R2 is 0.05. As measured by the t-statistic, the dependence is relatively strongly significant due to the higher number of observations (235).
5. Concluding Remarks
Whether the growth rate of output depends positively or negatively on the ratio of human to physical capital is a fundamental problem in the theory of economic
growth. This paper provides evidence that this dependence tended to be positive in the sample of 73 countries between 1960 and 1990. The results are robust if human capital, physical capital, and output are included as additional explanatory variables. The paper underscores the role of the relative human-capital abundance in the fast-growing Asian economies (Indonesia, Japan, Korea, Singapore, Taiwan, and Thailand). The paper’s evidence is consistent with two-sector models of endogenous growth, models with large adjustment costs for changing human capital, and models of technological diffusion. Examining the direct relationship between the hu-man-physical ratio and the output growth seems to be superior to existing studies, which provide only indirect evidence for the imbalance effect.
References
Barro, R. J. and J. W. Lee, (1996), “International Measures of Schooling Years and Schooling Quality,” American Economic Review, Papers and Proceedings, 86, 218-223.
Barro, R. J. and X. Sala-i-Martin, (1995), Economic Growth, Boston, MA: McGraw-Hill.
Duczynski, P., (2002), “Adjustment Costs in a Two-Capital Growth Model,” Journal
of Economic Dynamics and Control, 26, 837-850.
Hirshleifer, J., (1987), Economic Behavior in Adversity, Chicago: University of Chi-cago Press.
Kmenta, J., (1997), Elements of Econometrics, Ann Arbor: University of Michigan Press.
Nehru, V. and A. Dhareshwar, (1993), “A New Database on Physical Capital Stock: Sources, Methodology, and Results,” Rivista de Analisis Economico, 8, 37-59. Nelson, R. R. and E. S. Phelps, (1966), “Investment in Humans, Technological
Dif-fusion, and Economic Growth,” American Economic Review, 56, 69-75. Summers, R. and A. Heston, (1991), “The Penn World Table (Mark 5): An Expanded
Set of International Comparisons, 1950-1988,” Quarterly Journal of Economics, 106, 327-368.