Examining Related Influential Factors for Dental Calculus Scaling Utilization among P eople with D isabilities in Taiwan, a Nationwide Population-based Study
Hsien-Tang Lai a,b,c, Pei-Tseng Kung d,#,Hsun-Pi Sue, Wen-Chen Tsai c,#* a. Dachien General Hospital, Miao Li ,Taiwan, R.O.C.
b. Department of Business Management, National United University, Miao Li ,Taiwan, R.O.C.
c. Department of Health Services Administration, China Medical University, Taichung, Taiwan, R.O.C.
d. Department of Healthcare Administration Asia University, Taichung, Taiwan, R.O.C.
e. Department of Dental Hygiene, China Medical University, Taichung, Taiwan, R.O.C.
# The authors contributed equally to this work * Corresponding author: Professor Wen-Chen Tsai Tel: 886-422073070 Fax: 886-422028895
Email:wtsai@mail.cmu.edu.tw
Abstract
Limited studies with large samples have been conducted on the utilization of dental calculus scaling among people with physical or mental disabilities. This study aimed to investigate the utilization of dental calculus scaling among the national disabled population. This study analyzed the utilization of dental calculus scaling among the disabled people, using the nationwide data between 2006 and 2008. Descriptive analysis and logistic regression were performed to analyze related influential factors for dental calculus scaling utilization.
The dental calculus scaling utilization rate among people with physical or mental disabilities was 16.39%, and the annual utilization frequency was 0.2 times.
Utilization rate was higher among the female and non-aboriginal samples. Utilization rate decreased with increased age and disability severity while utilization rate
increased with income, education level, urbanization of residential area and number of chronic illnesses. Related influential factors for dental calculus scaling utilization rate were gender, age, ethnicity (aboriginal or non aboriginal), education level,
urbanization of residence area, income, catastrophic illnesses, chronic illnesses, disability types, and disability severity significantly influenced the dental calculus scaling utilization rate.
improve dental calculus scaling utilization among disabled individuals in rural areas; (2) increasing awareness of disabled individuals and care givers can enhance their perception on the importance of oral health; (3) design customized dental scaling promotions according to the needs of individual target groups, including lower income population and people with disabilities; (4) provide regular dental scaling for severely disabled persons at institutions, or provide collection and drop-off services or home visit dental care for non-mobile disabled persons.
Keywords: dental calculus scaling; disability; dental prevention; calculus scaling utilization
Examining Related Influential Factors for Dental Calculus Scaling Utilization among P eople with D isabilities in Taiwan, a Nationwide Population-based Study
1. Introduction
Taiwan began implementing the Physically and Mentally Disabled Citizens Protection Act in 1990. The considerable improvement in welfare for the physically or mentally disabled has led to rapid increases in the number of registered citizens with physical or mental disabilities. By the end of 2012, the number of disabled citizen exceeded 1.1 million, showing an increase of 350 thousand in 10 years. People with disabilities accounted for 4.7% of the total population (Ministry of the Interior, 2012).
People with disabilities are restricted by difficulties in expression and mobility, and therefore have poorer oral health compared to that of the general public (Wright, 1991). A study from Hong Kong on people with mental or
physical disabilities found that no calculus was observed in 4 year-olds; however, 20.2% of 14 year-olds had calculus, as well as 56.3% of the 25 to 35 year-olds (Donnell, Sheiham, & Wai, 2002). Another study on people with intellectual disabilities showed that tooth loss increased rapidly with advancing age. Among these individuals, 90% required conservative treatment, 49% required dental scaling, and 34% required complex periodontal treatment (Pieper, Dirks, & Kessler, 1986).
and tooth loss if left untreated. Regular dental calculus scaling is important for preventing periodontal diseases, just as blood glucose management is important for diabetics. Therefore, the National Health Insurance (NHI) offers free dental calculus scaling once every 6 months for all insured people. The NHI covers 99.38% of Taiwan population. The dental calculus scaling might be less important than critical medical conditions such as internal medicine and surgery for the people with disabilities; however, it is a crucial indicator of oral health among these persons. Therefore, this study would like to investigate the utilization of dental calculus scaling among the national population with disabilities.
2. Method 2.1. Data source and processing
This study analyzed the utilization of dental calculus scaling among those with physical or mental disabilities, using the information of disabled individuals
registered in the 2008 Ministry of the Interior database and the NHI database between 2006 and 2008 published by National Health Research Institutes. Taiwan with about 23 million of population includes 25cities or counties. This study did not cover three cities (Kaohsiung city, Kaohsiung county and Taoyuan county) since the data were not accessible. The sample size was 83% of all disabled population in Taiwan and was nonetheless highly representative.
The Statistics Center of Ministry of Welfare and Health, Taiwan, helped us combine all data sets and then provided us the data including the necessary
information for this study. All personal identification information has been deleted, and personal privacy was under protection from using these data. This study has been approved by the research ethics committee in China Medical University and Hospital (IRB No. CMU-REC-101-012).
2.2. Relevant variables explanation
The Andersen model was used to analyze the utilization of dental calculus scaling. The independent variables included the following: (1) Predisposing
components, which included demographic characteristics (gender, age, marital status, and ethnicity [aboriginal or non aboriginal]) and social structure (education level). (2) Enabling components, which included personal or family resources (premium-based monthly salary ), community resources (urbanization of residential area); additionally, urbanization was categorized into 7 levels by referencing Liu (2006), which stratified the 359 townships in Taiwan into 7 levels, with Level 1 being the most urbanized and Level 7 as the least urbanized. (3) Need components, which involve disease clinical evaluation; this variable included catastrophic illnesses, number of chronic illnesses (between 0 and ≥7 types), and three disability types (mental, physical, and both types). Based on the Physically and Mentally Disabled Citizens Protection Act in
Taiwan (Ministry of the Interior, 2012), the disabled people were classified into17-disability categories. In this study, mental disabilities included intellectual
impairment, dementia, autism, chromosomal abnormalities, psychiatric disorders, and metabolic abnormalities, congenital defects. Physical disabilities encompassed visual impairment, hearing impairment, speech impediment, physical impediment, multiple impediments, severe organ dysfunction, facial injury, balance impediment, intractable epilepsy, and rare diseases. Severity is classified into 4 groups, profoundly, severe, moderate, and mild. Every level of disability severity had a detailed definition. For instance, mental retardation was classified into mild, moderate, severe, and profound. Mild mental retardation was defined as having an intelligence quotient (IQ) of at least two to three standard deviations below the mean; people with mild mental retardation were considered to be able to partially take care of themselves and perform or
partially perform simple technical tasks after special education and training. Moderate mental retardation was defined as having an IQ of at least three to four standard deviations below the mean; people with moderate mental retardation were considered to be able to partially take care of themselves and perform nontechnical tasks under supervision, but unable to earn a living independently. Severe mental retardation was defined as having an IQ of at least four to five standard deviations below the mean; people with severe mental retardation were considered to be unable to take care of
themselves independently or earn a living, and reliant on long-term care provided by others. Profound mental retardation was defined as having an IQ of at least five standard deviations below the mean; people with profound mental retardation were considered to lack the ability to take care of themselves or earn a living, and reliant on long-term care provided by others. The dependent variable was utilization of dental calculus scaling.
2.3. Statistical analysis
The SAS 9.1 software was used to perform the data analyses. Univariate analysis involved the descriptive analysis of the various variables to determine the sample number and percentages. The frequency and percentage of dental calculus scaling utilization were then analyzed (Table 1). Regarding bivariate analysis, the t test, one-way ANOVA, and the Chi squaretest were performed to determine statistical significance. The Chi square test was performed to compare the utilization of dental calculus scaling among people with disabilities. The variables with p < 0.05 from the Chi square test were further examined using multiple logistic regression analysis. Multiple logistic regression was employed to analyze related influential factors for dental calculus scaling utilization in people with physical or mental disabilities, and the significance level was p < 0.05. Table 2 presents the independent effect (i.e. adjusted odds ratio, OR) of the relevant variables when all other variables are
controlled in all disabled people, the mental disability, physical disability, and both disabilities groups, respectively.
3. Results
3.1. Basic characteristic analysis of people with physical or mental disabilities The research sample comprised data from 745,063 people with physical or mental disabilities, of whom 76.91% had physical disabilities, 21.00% had mental
disabilities, and 2.1% had both types of disabilities. Regarding the predisposing components, the demographic data showed that 57.95% of the sample population was male. The largest age group was of those aged 75 years or older (20.74%). Married individuals accounted for a significant proportion of the population (47.23%), of whom 52.97% had physical disabilities and 27.07% had mental disabilities. The people with mental disabilities were predominantly single. Concerning the education level of the social structure, those who were illiterate and those who did not study beyond elementary school accounted for a significant proportion (46.81%) of the sample population. People with physical disabilities and those with mental disabilities who were illiterate and had an elementary school education level accounted for 48.59% and 38.96% of the sample, respectively. Analyzing the income (premium-based monthly salary) variable of the enabling components indicated that 60.71% of the sample were in the ≤17280 income category or were dependent. Among these,
55.42% of those with physical disabilities and 77.77% of those with mental
disabilities were in the ≤17280 income category or were dependent. The results for the urbanization variable of the community resource showed that 80% of the sample resided in locations with urbanizations higher than Level 2. Regarding the need components, 32.96% of the study participants experienced catastrophic illnesses and 80% of the study participants experienced more than one chronic illness. In this study, 27% of the people with physical disabilities had comorbid catastrophic illnesses and 52.39% of the people with mental disabilities experienced comorbid catastrophic illnesses. Additionally, 81.71% and 77.69% of the people with physical disabilities and those with mental disabilities, respectively, had more than one comorbid chronic illnesses. Mild disability accounted for the largest proportion (37.91%); specifically, 41.68% of the people with physical disabilities and 27.89% of the people with mental disabilities had mild disability (Table 1).
3.2. Analysis of utilization rate and frequency of dental calculus scaling in people with physical or mental disabilities
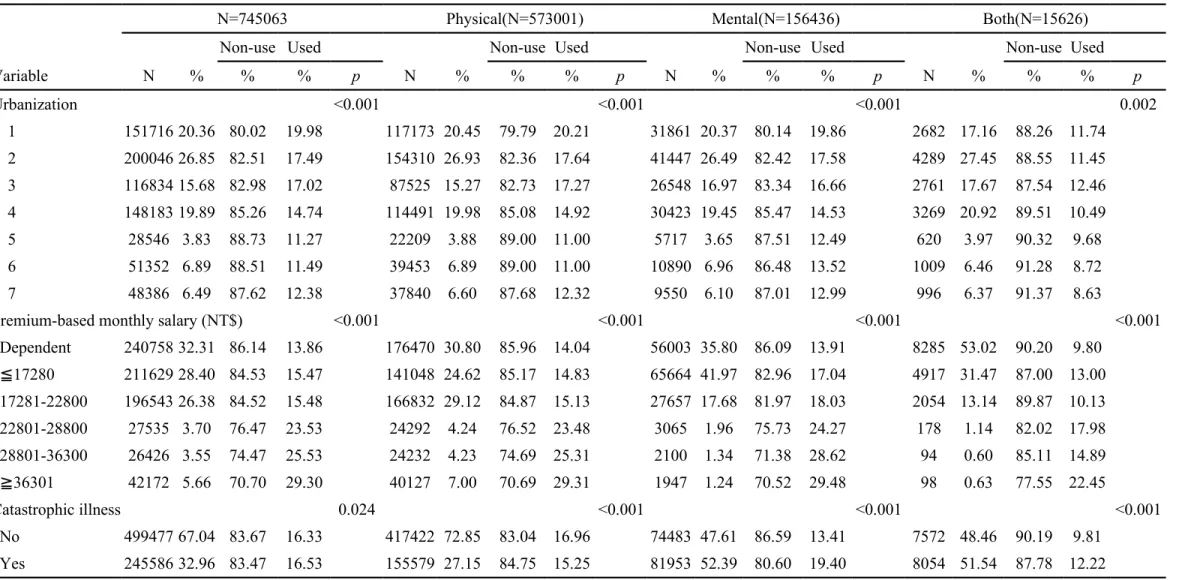
In Table 1, the utilization rate of dental scaling in people with physical or mental disabilities was 16.39%; the annual average utilization frequency was 0.2 times. The utilization rate of dental scaling was the lowest in the population with both physical
and mental disabilities (11.05%), with an annual average utilization frequency of 0.14 times. Utilization rate was higher among women (17.03%) than men (15.93%). The utilization rate was the highest among 20 to 29 year old disabled individuals
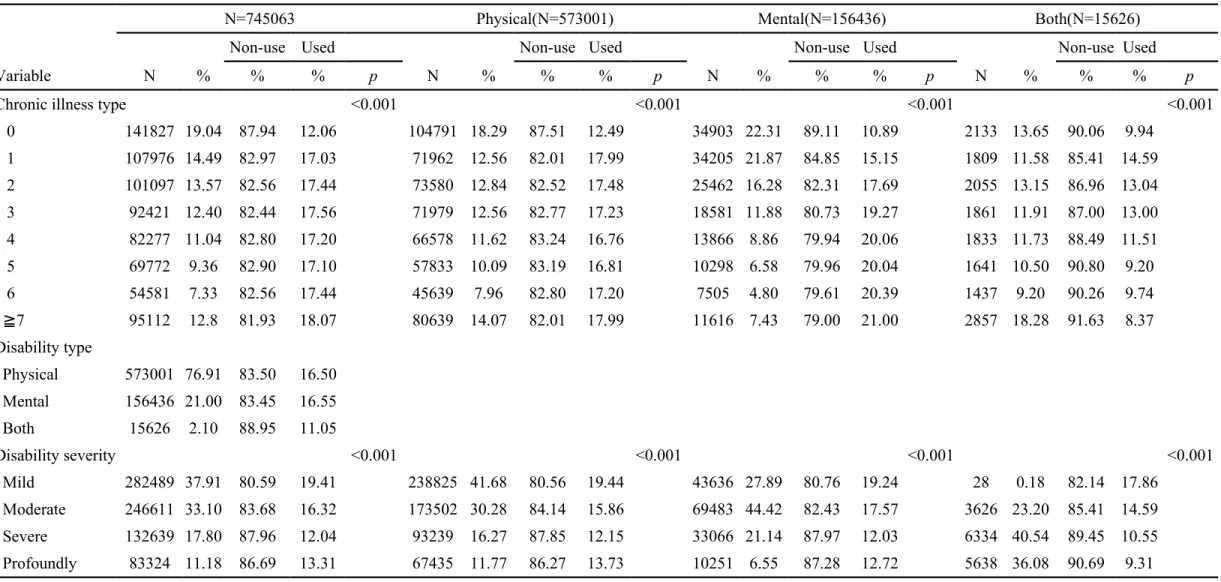
(23.65%). The utilization rate decreased with age increase, and the utilization rate among disabled individuals over 75 was 8.55%. The utilization rate significantly reduced in the aboriginal sample group (10.89%). Furthermore, the utilization rate increased with education level, with 28.83% among those with a junior college and university or above education. The dental calculus scaling utilization rate was the lowest in the dependent population group(13.86%) and the lowest income group (≦NT$17280)(15.47%),the dental calculus scaling utilization rate increased with the income group, the income group (≧36301),the utilization rate was 29.3% higher than the lowest income group. The utilization rate increased with the urbanization level of residential location. The utilization rates were 19.98% for the sample group residing in locations with an urbanization level of 1 and 12.38% for the sample group residing in locations with an urbanization level of 7. The utilization rate was significantly lower in the sample with physical disabilities who experienced catastrophic illnesses (15.25%) than in those without catastrophic illnesses (16.96%). The utilization rate was significantly higher in the sample with mental disabilities who experienced catastrophic illnesses (19.40%) than in those without catastrophic illnesses (13.41%).
Similarly, among the sample with both physical and mental disabilities, the utilization rate was significantly higher in those with catastrophic illnesses than in those without catastrophic illnesses. The utilization rate was higher in those with chronic illnesses than in those without chronic illnesses, and was the highest among the samples with ≥7 chronic illnesses. The utilization rate decreased with increased disability severity, and had the highest in the mildly disabled group (19.41%; Table 1).
3.3. Influential factors for dental calculus scaling utilization in people with physical or mental disabilities
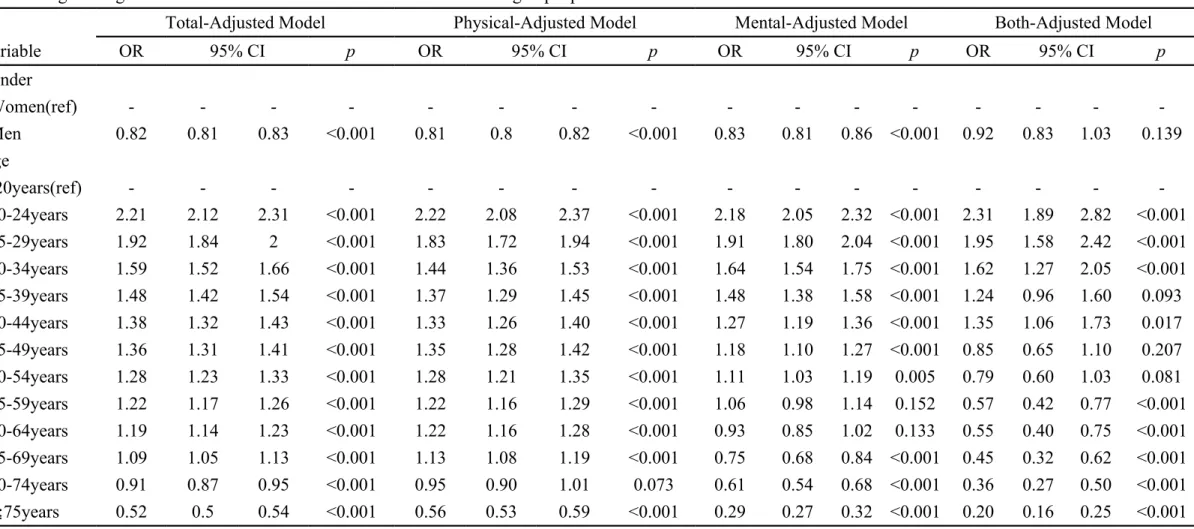
This study found that the utilization of dental calculus scaling in people with physical or mental disabilities is associated with various factors, including gender, age, education level, aboriginal status, salary (premium-based month),urbanization level of residential area, presence of catastrophic illnesses, presence of chronic illnesses, disability types, and disability severity (Table 2). The result of the adjusted model revealed the effects of individual variables when the other variables were controlled. The results of this study showed that the dental calculus scaling utilization rate in men was 0.82 times (95%CI: 0.81-0.83) lower than in women. The dental calculus scaling utilization rate in the 20 to 24 age group was 2.21 times (95% CI: 2.12-2.31) higher than in the <20 age group. However, in older sample age groups, utilization rate decreased with increased age. The utilization rate was the lowest in
senior sample, the ≧ 75 age group, which was 0.52 times (95% CI:0.50-0.54) lower than that of the < 20 age group. The dental calculus scaling utilization rate in the aboriginal group was 0.65 times (95% CI: 0.62-0.69) lower than in the non-aboriginal sample. The dental calculus scaling utilization rate in the junior college and university or above education level group was 1.98 times (95% CI: 1.93-2.03) higher than in the illiterate and elementary education level group. The dental calculus scaling utilization rate was the lowest in the dependent population group and the lowest income group (≦NT $17280), the dental calculus scaling utilization rate increased with the income group, the income group (≧36301),which was 1.58 times (95% CI:1.54-1.62) higher than the lowest income group. The dental calculus scaling utilization rate reduced with the decreased urbanization level of residential location. This study has found that the dental scaling utilization rate among residents in urbanization level 7 locations was 0.7 times (95% CI: 0.67-0.72) lower than among residents in urbanization level 1 locations.
The dental calculus scaling utilization rates were higher in the samples with catastrophic illnesses and with chronic illnesses than those without catastrophic illnesses and chronic illnesses. The dental calculus scaling utilization rate increased with the number of comorbid chronic illnesses. The utilization rate among those with ≥7 chronic illnesses was 2.64 times (95% CI: 2.58–2.71) higher than that of those
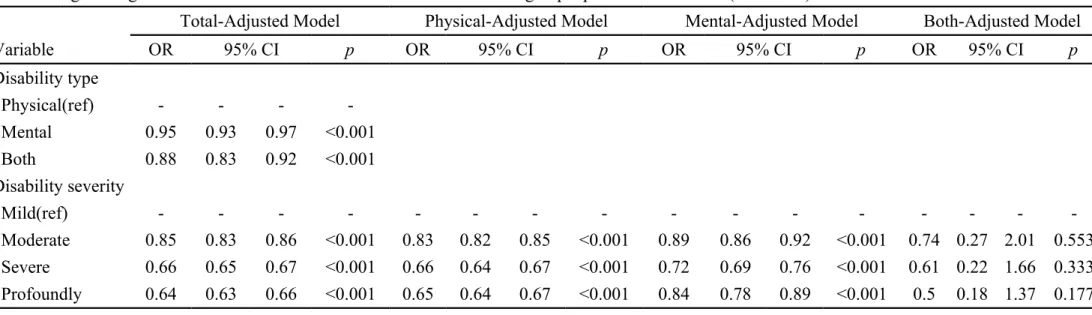
without chronic illnesses. Concerning disability types, the dental calculus scaling utilization rate in the mental disability type was 0.95 times (95% CI: 0.93–0.97) lower than that in the physical disability group. The dental calculus scaling utilization rate in the both disabilities group was 0.88 times (95% CI: 0.83–0.92) lower than that in the physical disability group.
Regarding physical or mental disability severity, the dental calculus scaling utilization rate decreased with increased disability severity. The utilization rate in the profoundly disabled group was 0.64 times (95% CI: 0.63-0.66) lower than that of the mildly disabled group (Table 2).
4. Discussion
Under the NHI coverage, this study identified a 16.39% dental calculus scaling utilization rate among physically or mentally disabled individuals and an average annual utilization frequency of 0.2 times. That the dental calculus scaling utilization rate was lower in the both disabilities group (11.05%) was also discovered, with an average annual utilization frequency of 0.14 times. The dental treatment most frequently used for disabled persons in Taiwan is dental extraction, followed by dental restoration and scaling (Tsai et al., 2004). The most frequently utilized dental procedure by the general public is dental restoration, followed by dental calculus scaling and then dental extraction (Tsai et al., 2004). In Taiwan, a vast discrepancy
exists in the dental treatment utilization rate between the disabled and the general public. The annual utilization rates among disabled individuals and the public are 1.31% and 36.05%, respectively (Tsai et al., 2004).
This study found that dental calculus scaling utilization increased with the education level and income of disabled persons. Correspondingly, a study indicated that the utilization rate for tooth fluoride varnish in children with disabilities increases with income (Weng et al., 2011). Education level (i.e., junior college and university or above) is positively correlated with dental service utilization rates (Tsai et al., 2007). Mildly disabled persons have the highest education level among those with
disabilities (Tsai et al., 2003; Tsai et al., 2007). A study in Mexico found that tooth brushing frequency in children increases with maternal education level (Vallejos et al., 2008). Dental caries rate is negatively correlated with maternal education level (Eronat & Koparal, 1997). This study found that 46.81% of those with disabilities are elementary or illiterate. As explained by using the Anderson model, the age and education variables of the predisposing components directly influenced the income and urbanization of residence variables of the enabling components, as well as on the need components (i.e., catastrophic illnesses, chronic illnesses, disability types, and disability severity), and ultimately affected the health service utilization among people with disabilities. The NHI in Taiwan provides free copayment dental calculus
scaling twice annually. However, dental calculus scaling utilization rates among low income populations and dependent people remain significantly low because they lack adequate oral health knowledge and are not aware of the availability of free dental calculus scaling services. Therefore, enhancing preventive health promotion and education is essential to mitigating the difficulties that populations with low socioeconomic statuses encounter when seeking medical treatment.
From the perspective of community resources, specifically that of the urbanization of residence area, this study found that the dental calculus scaling utilization rate among people with disabilities reduced as the residence urbanization level decreased. This study found that disabled individuals residing in less urbanized locations have lower dental calculus scaling utilization rates. Physician density and transportation convenience are higher in urbanized residential areas. Aboriginal disabled persons and residing in less urbanized areas must overcome the difficulties of accessing dental care. In contrast, aboriginal disabled persons and residing in less urbanized areas show high utilization rates for mammography, prenatal examination, adult preventive health care (Kung, Tsai, & Chiou, 2012; Kung, Tsai, & Li, 2012). This is primarily because of the government’s provisioning of preventive health services in mobile clinic vehicles for rural areas, which effectively addresses various issues of medical access for people with disabilities. The provisioning of dental services in mobile
clinic vehicles may enhance the utilization rate of dental calculus scaling in disabled individuals.
For the need components, this study identified higher dental calculus scaling utilization rates in disabled individuals with catastrophic illnesses or chronic illnesses. Disabled persons with chronic illnesses or catastrophic illnesses require regular medical consultations, and are therefore more likely to receive additional dental treatment recommendations during consultations. Specifically, physicians with different specialties can perform oral examinations and recommend referrals for further dental treatment. Lantz found higher utilization rates of preventive health services in patients receiving regular medical treatment (Lantz , Weigers &
House,1997), and according to Lerman, physicians’ recommendations are the primary contributor to patients receiving regular health examinations (Lerman et al.,1990). A study from Birmingham, the United Kingdom, indicated that disabled children receiving fewer medical treatments have significantly substandard oral hygiene and a higher prevalence of periodontitis (Shaw, Maclaurin, & Foster, 1986). Dental issues are not typically valued by people with disabilities and their primary care providers. Therefore, the oral health of disabled people can be enhanced by improving integrated care provided by physicians with other specialties.
Regarding disability types, surveys conducted on disabled persons in various disability categories in Taiwan revealed that impediments in accessing medical treatment are associated with disability characteristics. For instance, 62.2% of the intellectually impaired and 98.4% of autistic patients express their inability to independently complete the medical consultation registration procedure (Ministry of the Interior, 2002). Previous research has indicated an unmet need for oral care among people with disabilities. The key contributing factors that have been suggested are fear of treatment and the lack of awareness among care givers (Cumella et al., 2000). Furthermore, dentists’ treatment competency and willingness to provide care are critical determinants. During dental treatment for people with intellectual disabilities, behavior management procedures are required to ensure patient safety and treatment procedure efficiency. These methods include the use of restraints, medication, or anesthetics. Therefore, people with physical or mental disabilities frequently experience discrimination when seeking medical treatment. Dentists must improve their equipment and professional training before providing comprehensive dental care for disabled individuals (Tsai et al, 2007; Waldman, Perlman, & Swerdloff, 1998). This study found that people with mental disabilities have the least utilization rate of dental calculus scaling. To effectively reduce barriers to accessing medical care
experienced by people in various disability types, it is essential to customize dental treatment promotion to the needs of specific disabilities.
The dental calculus scaling utilization rate increases with decreased disability severity. Similar to our findings, the results of other studies have shown a decrease in children’s tooth fluoride varnish utilization rates with disability severity increase (Weng et al., 2011, Diab & Johnston, 2004). Mildly disabled persons have higher education levels (Tsai et al., 2004; Tsai et al., 2007), and thus earn higher incomes. These individuals are more likely to be married and have less physical and
environmental limitations. Therefore, they have higher utilization rates for dental calculus scaling. The findings of this study highlight the significance of identifying disability severity for disabled persons with difficulty accessing dental care, as well as the importance of proposing feasible improvement methods to meet the expectations of this population group. Furthermore, a study has found that prevalence of dental caries is lower in institutionalized children with several intellectual disabilities than in non-institutionalized children with severe intellectual disabilities (Forsberg et al., 1985). Previous research stated that institutionalized disabled individuals report higher satisfaction for dental treatment than do those who live at home (Tsai et al., 2003). This discrepancy may be explained by the regular provisioning of dental examination in institutions, as opposed to the inconvenience of obtaining medical
treatment for disabled individuals living at home. Therefore, methods for increasing dental calculus scaling utilization rates include providing dental treatment for severely or profoundly disabled persons in institutions, providing collection and drop-off services, or home-visit dental care for non-mobile disabled individuals.
5. Conclusions
The low dental calculus utilization rate among people with disabilities is a significant warning. The government should devise feasible policies to provide severely disabled people residing in rural areas who are poverty-stricken with an integrated dental care plan, in order to maintain the equity of access to healthcare services for people with disabilities.
6. Laminations
The information used in this study was sourced from a secondary database.
Therefore, some influential factors for service utilization were not established. These included precise income value and the health behaviors of study participants. The variables included in this study are therefore restricted.
Acknowledgments
This study was supported by grants (CMU99-ASIA-18, DOH100-TD-B-111-004) from China Medical University, Asia University, and the Department of Health. The preventive healthcare files were obtained from the Bureau of Health Promotion in
Taiwan. We are also grateful for the use of the National Health Insurance Research Database as provided by the Department of Health in Taiwan. The interpretations and conclusions contained herein do not represent those of the Bureau of Health
REFERENCES
Cumella ,S., Ransford, N., Lyons, J., & Burnham, H. (2000) . Needs for oral care among people with intellectual disability not in contact with Community Dental Services. Journal of intellectual disability research, 44, (Pt 1):45-52.
Diab, M. E., & Johnston, M. V. (2004). Relationships between level of disability and receipt of preventive health services . Archives of physical medicine and
rehabilitation , 85(5), 749–757.
Donnell , D. O., Sheiham , A., & Wai, Y. K. (2002). Dental findings in 4-,14-, and 25-to 35-year-old Hong Kong residents with mental and physical disabilities. Special care in dentistry , 22(6), 231-234.
Eronat ,N., & Koparal, E. (1997) . Dental caries prevalence, dietary habits ,tooth-brushing, and mother's education in 500 urban Turkish children. Journal of Marmara University Dental Faculty, 2(4), 599-604.
Forsberg, H., Quick-Nilsson, I., Gustavson, K.H., & Jagell, S. (1985) . Dental health and dental care in severely mentally retarded children . Swedish dental journal , 9 (1), 15-28.
Kung, P. T., Tsai, W. C., & Chiou, S. J. (2012). The assessment of the likelihood of mammography usage with relevant factors among women with disability .
Research in developmental disabilities , 33(1), 136-143.
Preventive Health Services among Adults with Disability in Taiwan . Research in developmental disabilities , 33(1), 205-213.
Lantz, P. M., Weigers, M. E., & House, J.S. (1997) . Education and income
differentials in breast and cervical cancer screening . Policy implications for rural women . Medical care , 35(3), 219-236.
Lerman, C., Rimer, B., Trock, B., Balshem, A. & Engstrom P. F. (1990) . Factors associated with repeat adherence to breast cancer screening. Preventive Medicine , 19(3), 279-90.
Liu,C.Y., Hung,Y.T., Chuang,Y.L., Chen,Y.J., Weng,W.S., Liu,J.S. & Liang,K.Y. (2006).Incorporating Development Stratification of Taiwan Townships into Sampling Design of Large Scale Health Interview Survey. Journal of Health Management,4 (1),1-22.
Ministry of the Interior . (2012) . Statistical report of interior . R.O.C. Taipei Taiwan .
Ministry of the Interior . (2002).Report on physically and mentally disabled citizens living demand survey 2001 R.O.C. Taipei Taiwan: Ministry of the Interior.
Tsai, W. C., Kung, P. T., & Chang , W. C. (2007). Influences of market competition on dental care utilization under the global budget payment system . Community Dentistry and Oral Epidemiology, 35(6), 459-464.
Pieper, K., Dirks, B., & Kessler P . (1986). Caries, oral hygiene and periodontal disease in handicapped adults . Community dentistry and oral epidemiology , 14(1), 28-30.
Shaw, L., Maclaurin, E. T., & Foster, T. D. (1986). Dental study of handicapped children attending special schools in Birmingham , UK. Community Dentistry and Oral Epidemiology, 14(1), 24-27.
Tsai, W. C., Kung , P. T., Chiang, H. H., & Chang, W. C. (2003). Disabled people’s utilization of dental care and associated factors. The final report of grant sponsored by Taiwan, ROC: National Science Council.
Tsai, W. C., Kung, P.T., Chiang, H.H., & Chang, W. C. (2007) . Changes and factors associated with dentists’ willingness to treat patients with severe disability. Health Policy, 83(2-3),363-374.
Tsai, W. C., Kung, P. T., Chiang, H. H., & Chang ,W. C. (2004). Disabled people’s utilization of dental care and associated factors. The final report of grant sponsored by Taiwan, ROC: National Science Council.
Vallejos-Sánchez , A. A., Medina-Solís, C. E., Maupomé, G., Casanova-Rosado, J. F., Minaya-Sánchez, M., Villalobos-Rodelo, J. J., Pontigo-Loyola, A. P. (2008). Weng, R. H., Kung, P. T., Tsai, W. C., Chiang, H. H., & Chiu, L. T. (2011). The use
Taiwan. Research in developmental disabilities, 32(2):583-592.
Waldman , H. B., Perlman, S. P., Swerdloff, M . (1998). Dental care for children with mental retardation: thoughts about the Americans with Disability Act. ASDC Journal of Dentistry for Children, 65(6) , 487-91.
Table 1 The utilization rate of dental calculus scaling in people with disabilities and bivariate analysis
Total(N=745063) Physical(N=573001) Mental(N=156436) Both(N=15626)
Non-use Used Non-use Used Non-use Used Non-use Used
Variable N % % % p N % % % p N % % % p N % % % p Utilization frequency(times) 0.2 0.2 0.2 0.14 Utilization rate 83.61 16.39 83.50 16.50 83.45 16.55 88.95 11.05 Gender <0.001 <0.001 <0.001 0.002 Women 313301 42.05 82.97 17.03 235488 41.10 82.96 17.04 70680 45.18 82.33 17.67 7133 45.65 89.79 10.21 Men 431762 57.95 84.07 15.93 337513 58.90 83.88 16.12 85756 54.82 84.38 15.62 8493 54.35 88.24 11.76 Age <0.001 <0.001 <0.001 <0.001 <20years 48310 6.48 88.85 11.15 20983 3.66 88.97 11.03 23990 15.34 88.88 11.12 3337 21.36 87.92 12.08 20-24years 22302 2.99 76.35 23.65 9654 1.68 74.82 25.18 11840 7.57 77.63 22.37 808 5.17 75.99 24.01 25-29years 30556 4.10 76.95 23.05 15777 2.75 75.51 24.49 13995 8.95 78.47 21.53 784 5.02 78.70 21.30 30-34years 31316 4.20 78.72 21.28 17368 3.03 78.41 21.59 13297 8.50 79.08 20.92 651 4.17 79.57 20.43 35-39years 37474 5.03 79.14 20.86 22915 4.00 78.84 21.16 13922 8.90 79.49 20.51 637 4.08 82.57 17.43 40-44years 51464 6.91 79.80 20.20 35775 6.24 79.21 20.79 15028 9.61 81.14 18.86 661 4.23 80.79 19.21 45-49years 69419 9.32 79.32 20.68 53728 9.38 78.57 21.43 14950 9.56 81.71 18.29 741 4.74 85.83 14.17 50-54years 68575 9.20 80.04 19.96 55806 9.74 79.48 20.52 12069 7.71 82.27 17.73 700 4.48 86.86 13.14 55-59years 63540 8.53 81.28 18.72 53433 9.33 80.86 19.14 9455 6.04 83.01 16.99 652 4.17 90.03 9.97 60-64years 50993 6.84 82.25 17.75 44895 7.84 81.79 18.21 5474 3.50 85.07 14.93 624 3.99 90.54 9.46 65-69years 58054 7.79 83.95 16.05 52953 9.24 83.55 16.45 4435 2.84 87.42 12.58 666 4.26 92.34 7.66 70-74years 58571 7.86 86.26 13.74 53649 9.36 85.90 14.10 4006 2.56 89.42 10.58 916 5.86 93.67 6.33 ≧75years 154489 20.74 91.45 8.55 136065 23.75 91.00 9.00 13975 8.93 94.25 5.75 4449 28.47 96.36 3.64 (Mean±SD) 54.87 20.93 21.38 17.96 <0.001a 58.7 19.13 19.44 16.84 <0.001a 41.34 20.69 21.46 16.04 <0.001 a 28.31 21.74 <0.001 a
Table 1 The utilization rate of dental calculus scaling in people with disabilities and bivariate analysis (continued)
N=745063 Physical(N=573001) Mental(N=156436) Both(N=15626)
Non-use Used Non-use Used Non-use Used Non-use Used
Variable N % % % p N % % % p N % % % p N % % % p
Education level <0.001 <0.001 <0.001 <0.001
Elementary or illiterate
348788 46.81 87.50 12.50 278408 48.59 87.29 12.71 60940 38.96 88.00 12.00 9440 60.41 90.31 9.69 Junior high school 116575 15.65 82.01 17.99 82128 14.33 81.70 18.30 32638 20.86 82.58 17.42 1809 11.58 85.85 14.15 Senior (vocational)
high school
115839 15.55 77.36 22.64 83401 14.56 77.29 22.71 30943 19.78 77.31 22.69 1495 9.57 82.41 17.59 Junior college and
university or above 50358 6.76 71.17 28.83 41093 7.17 70.93 29.07 8801 5.63 71.53 28.47 464 2.97 86.21 13.79 Unknown 113503 15.23 85.18 14.82 87971 15.35 84.96 15.04 23114 14.78 85.47 14.53 2418 15.47 90.53 9.47 Marital status <0.001 <0.001 <0.001 <0.001 Single 164655 22.10 83.25 16.75 95394 16.65 82.94 17.06 63549 40.62 83.55 16.45 5712 36.55 84.94 15.06 Married 351913 47.23 84.28 15.72 303513 52.97 84.08 15.92 42342 27.07 84.54 15.46 6058 38.77 92.32 7.68 Divorce or widow 17785 2.39 88.83 11.17 14298 2.50 89.29 10.71 3150 2.01 86.51 13.49 337 2.16 91.10 8.90 Unknown 210710 28.28 82.33 17.67 159796 27.89 82.22 17.78 47395 30.30 82.15 17.85 3519 22.52 89.43 10.57 Aboriginal <0.001 <0.001 <0.001 0.002 No 727518 97.65 83.47 16.53 559186 97.59 83.37 16.63 153080 97.85 83.33 16.67 15252 97.61 88.82 11.18 Yes 17545 2.35 89.11 10.89 13815 2.41 88.95 11.05 3356 2.15 89.21 10.79 374 2.39 94.12 5.88
Table 1 The utilization rate of dental calculus scaling in people with disabilities and bivariate analysis (continued)
N=745063 Physical(N=573001) Mental(N=156436) Both(N=15626)
Non-use Used Non-use Used Non-use Used Non-use Used
Variable N % % % p N % % % p N % % % p N % % % p Urbanization <0.001 <0.001 <0.001 0.002 1 151716 20.36 80.02 19.98 117173 20.45 79.79 20.21 31861 20.37 80.14 19.86 2682 17.16 88.26 11.74 2 200046 26.85 82.51 17.49 154310 26.93 82.36 17.64 41447 26.49 82.42 17.58 4289 27.45 88.55 11.45 3 116834 15.68 82.98 17.02 87525 15.27 82.73 17.27 26548 16.97 83.34 16.66 2761 17.67 87.54 12.46 4 148183 19.89 85.26 14.74 114491 19.98 85.08 14.92 30423 19.45 85.47 14.53 3269 20.92 89.51 10.49 5 28546 3.83 88.73 11.27 22209 3.88 89.00 11.00 5717 3.65 87.51 12.49 620 3.97 90.32 9.68 6 51352 6.89 88.51 11.49 39453 6.89 89.00 11.00 10890 6.96 86.48 13.52 1009 6.46 91.28 8.72 7 48386 6.49 87.62 12.38 37840 6.60 87.68 12.32 9550 6.10 87.01 12.99 996 6.37 91.37 8.63
Premium-based monthly salary (NT$) <0.001 <0.001 <0.001 <0.001
Dependent 240758 32.31 86.14 13.86 176470 30.80 85.96 14.04 56003 35.80 86.09 13.91 8285 53.02 90.20 9.80 ≦17280 211629 28.40 84.53 15.47 141048 24.62 85.17 14.83 65664 41.97 82.96 17.04 4917 31.47 87.00 13.00 17281-22800 196543 26.38 84.52 15.48 166832 29.12 84.87 15.13 27657 17.68 81.97 18.03 2054 13.14 89.87 10.13 22801-28800 27535 3.70 76.47 23.53 24292 4.24 76.52 23.48 3065 1.96 75.73 24.27 178 1.14 82.02 17.98 28801-36300 26426 3.55 74.47 25.53 24232 4.23 74.69 25.31 2100 1.34 71.38 28.62 94 0.60 85.11 14.89 ≧36301 42172 5.66 70.70 29.30 40127 7.00 70.69 29.31 1947 1.24 70.52 29.48 98 0.63 77.55 22.45 Catastrophic illness 0.024 <0.001 <0.001 <0.001 No 499477 67.04 83.67 16.33 417422 72.85 83.04 16.96 74483 47.61 86.59 13.41 7572 48.46 90.19 9.81 Yes 245586 32.96 83.47 16.53 155579 27.15 84.75 15.25 81953 52.39 80.60 19.40 8054 51.54 87.78 12.22
Table 1 The utilization rate of dental calculus scaling in people with disabilities and bivariate analysis (continued)
N=745063 Physical(N=573001) Mental(N=156436) Both(N=15626)
Non-use Used Non-use Used Non-use Used Non-use Used
Variable N % % % p N % % % p N % % % p N % % % p
Chronic illness type <0.001 <0.001 <0.001 <0.001
0 141827 19.04 87.94 12.06 104791 18.29 87.51 12.49 34903 22.31 89.11 10.89 2133 13.65 90.06 9.94 1 107976 14.49 82.97 17.03 71962 12.56 82.01 17.99 34205 21.87 84.85 15.15 1809 11.58 85.41 14.59 2 101097 13.57 82.56 17.44 73580 12.84 82.52 17.48 25462 16.28 82.31 17.69 2055 13.15 86.96 13.04 3 92421 12.40 82.44 17.56 71979 12.56 82.77 17.23 18581 11.88 80.73 19.27 1861 11.91 87.00 13.00 4 82277 11.04 82.80 17.20 66578 11.62 83.24 16.76 13866 8.86 79.94 20.06 1833 11.73 88.49 11.51 5 69772 9.36 82.90 17.10 57833 10.09 83.19 16.81 10298 6.58 79.96 20.04 1641 10.50 90.80 9.20 6 54581 7.33 82.56 17.44 45639 7.96 82.80 17.20 7505 4.80 79.61 20.39 1437 9.20 90.26 9.74 ≧7 95112 12.8 81.93 18.07 80639 14.07 82.01 17.99 11616 7.43 79.00 21.00 2857 18.28 91.63 8.37 Disability type Physical 573001 76.91 83.50 16.50 Mental 156436 21.00 83.45 16.55 Both 15626 2.10 88.95 11.05 Disability severity <0.001 <0.001 <0.001 <0.001 Mild 282489 37.91 80.59 19.41 238825 41.68 80.56 19.44 43636 27.89 80.76 19.24 28 0.18 82.14 17.86 Moderate 246611 33.10 83.68 16.32 173502 30.28 84.14 15.86 69483 44.42 82.43 17.57 3626 23.20 85.41 14.59 Severe 132639 17.80 87.96 12.04 93239 16.27 87.85 12.15 33066 21.14 87.97 12.03 6334 40.54 89.45 10.55 Profoundly 83324 11.18 86.69 13.31 67435 11.77 86.27 13.73 10251 6.55 87.28 12.72 5638 36.08 90.69 9.31 a. t-test
Table 2 Logistic regression models for utilization of dental calculus scaling in people with disabilities
Total-Adjusted Model Physical-Adjusted Model Mental-Adjusted Model Both-Adjusted Model
Variable OR 95% CI p OR 95% CI p OR 95% CI p OR 95% CI p Gender Women(ref) - - - Men 0.82 0.81 0.83 <0.001 0.81 0.8 0.82 <0.001 0.83 0.81 0.86 <0.001 0.92 0.83 1.03 0.139 Age <20years(ref) - - - 20-24years 2.21 2.12 2.31 <0.001 2.22 2.08 2.37 <0.001 2.18 2.05 2.32 <0.001 2.31 1.89 2.82 <0.001 25-29years 1.92 1.84 2 <0.001 1.83 1.72 1.94 <0.001 1.91 1.80 2.04 <0.001 1.95 1.58 2.42 <0.001 30-34years 1.59 1.52 1.66 <0.001 1.44 1.36 1.53 <0.001 1.64 1.54 1.75 <0.001 1.62 1.27 2.05 <0.001 35-39years 1.48 1.42 1.54 <0.001 1.37 1.29 1.45 <0.001 1.48 1.38 1.58 <0.001 1.24 0.96 1.60 0.093 40-44years 1.38 1.32 1.43 <0.001 1.33 1.26 1.40 <0.001 1.27 1.19 1.36 <0.001 1.35 1.06 1.73 0.017 45-49years 1.36 1.31 1.41 <0.001 1.35 1.28 1.42 <0.001 1.18 1.10 1.27 <0.001 0.85 0.65 1.10 0.207 50-54years 1.28 1.23 1.33 <0.001 1.28 1.21 1.35 <0.001 1.11 1.03 1.19 0.005 0.79 0.60 1.03 0.081 55-59years 1.22 1.17 1.26 <0.001 1.22 1.16 1.29 <0.001 1.06 0.98 1.14 0.152 0.57 0.42 0.77 <0.001 60-64years 1.19 1.14 1.23 <0.001 1.22 1.16 1.28 <0.001 0.93 0.85 1.02 0.133 0.55 0.40 0.75 <0.001 65-69years 1.09 1.05 1.13 <0.001 1.13 1.08 1.19 <0.001 0.75 0.68 0.84 <0.001 0.45 0.32 0.62 <0.001 70-74years 0.91 0.87 0.95 <0.001 0.95 0.90 1.01 0.073 0.61 0.54 0.68 <0.001 0.36 0.27 0.50 <0.001 ≧75years 0.52 0.5 0.54 <0.001 0.56 0.53 0.59 <0.001 0.29 0.27 0.32 <0.001 0.20 0.16 0.25 <0.001
Total-Adjusted Model Physical-Adjusted Model Mental-Adjusted Model Both-Adjusted Model
Variable OR 95% CI p OR 95% CI p OR 95% CI p OR 95% CI p
Education level
Elementary or - - -
Junior high school 1.20 1.18 1.23 <0.001 1.24 1.21 1.27 <0.001 1.12 1.08 1.17 <0.001 0.89 0.76 1.05 0.17 Senior (vocational) 1.49 1.46 1.52 <0.001 1.54 1.51 1.58 <0.001 1.39 1.34 1.45 <0.001 1.15 0.98 1.36 0.092 Junior college and 1.98 1.93 2.03 <0.001 2.05 2.00 2.11 <0.001 1.80 1.70 1.91 <0.001 1.31 0.97 1.76 0.076
Unknown 1.11 1.09 1.13 <0.001 1.13 1.10 1.16 <0.001 1.07 1.02 1.12 0.006 0.81 0.69 0.95 0.012 Marital status Single(ref) - - - Married 1.03 1.01 1.05 0.002 1.05 1.02 1.07 <0.001 1.03 0.99 1.07 0.118 0.93 0.81 1.08 0.33 Divorce or widow 0.72 0.68 0.76 <0.001 0.71 0.67 0.76 <0.001 0.77 0.69 0.86 <0.001 1.00 0.67 1.51 0.985 Unknown 0.99 0.98 1.01 0.541 1.01 0.98 1.03 0.619 0.99 0.96 1.03 0.666 0.95 0.82 1.10 0.469 Aboriginal No(ref) - - - Yes 0.65 0.62 0.69 <0.001 0.67 0.64 0.71 <0.001 0.63 0.56 0.7 <0.001 0.37 0.24 0.58 <0.001 Urbanization 1(ref) - - - -2 0.86 0.85 0.88 <0.001 0.86 0.84 0.88 <0.001 0.86 0.83 0.9 <0.001 0.86 0.73 1.01 0.068 3 0.91 0.89 0.93 <0.001 0.91 0.89 0.93 <0.001 0.89 0.85 0.93 <0.001 0.97 0.81 1.15 0.717 4 0.79 0.77 0.81 <0.001 0.79 0.77 0.81 <0.001 0.76 0.73 0.8 <0.001 0.83 0.70 0.99 0.04 5 0.64 0.61 0.66 <0.001 0.62 0.59 0.65 <0.001 0.67 0.62 0.74 <0.001 0.83 0.61 1.13 0.239 6 0.64 0.62 0.66 <0.001 0.61 0.58 0.63 <0.001 0.75 0.70 0.80 <0.001 0.74 0.57 0.97 0.027 7 0.7 0.67 0.72 <0.001 0.69 0.66 0.71 <0.001 0.72 0.67 0.77 <0.001 0.75 0.58 0.98 0.037
Total-Adjusted Model Physical-Adjusted Model Mental-Adjusted Model Both-Adjusted Model
Variable OR 95% CI p OR 95% CI p OR 95% CI p OR 95% CI p
Premium-based monthly salary (NT$)
≦17280(ref) - - - Dependent 0.98 0.96 1.00 0.027 1.00 0.97 1.02 0.677 0.96 0.92 0.99 0.018 0.79 0.69 0.90 0.001 17281-22800 1.10 1.08 1.12 <0.001 1.11 1.09 1.13 <0.001 1.10 1.06 1.14 <0.001 1.05 0.88 1.25 0.607 22801-28800 1.26 1.23 1.31 <0.001 1.29 1.25 1.34 <0.001 1.24 1.14 1.35 <0.001 1.14 0.76 1.72 0.525 28801-36300 1.38 1.34 1.42 <0.001 1.39 1.34 1.44 <0.001 1.53 1.38 1.69 <0.001 0.91 0.51 1.64 0.763 ≧36301 1.58 1.54 1.62 <0.001 1.6 1.56 1.65 <0.001 1.58 1.42 1.75 <0.001 1.77 1.07 2.92 0.025 Catastrophic illness No(ref) - - - Yes 0.95 0.94 0.96 <0.001 0.9 0.88 0.91 <0.001 1.11 1.07 1.15 <0.001 1.03 0.92 1.16 0.58 Chronic illness type
0(ref) - - - -1 1.45 1.42 1.49 <0.001 1.48 1.44 1.52 <0.001 1.36 1.30 1.43 <0.001 1.70 1.39 2.08 <0.001 2 1.63 1.60 1.67 <0.001 1.59 1.55 1.63 <0.001 1.68 1.60 1.77 <0.001 1.70 1.39 2.07 <0.001 3 1.81 1.77 1.86 <0.001 1.73 1.68 1.78 <0.001 1.98 1.88 2.09 <0.001 1.96 1.60 2.42 <0.001 4 1.93 1.88 1.98 <0.001 1.81 1.76 1.87 <0.001 2.26 2.13 2.40 <0.001 2.04 1.64 2.53 <0.001 5 2.07 2.02 2.13 <0.001 1.96 1.90 2.02 <0.001 2.48 2.33 2.65 <0.001 1.90 1.50 2.41 <0.001 6 2.28 2.21 2.35 <0.001 2.15 2.08 2.23 <0.001 2.79 2.59 3.00 <0.001 2.34 1.82 2.99 <0.001 ≧7 2.64 2.58 2.71 <0.001 2.51 2.44 2.59 <0.001 3.34 3.13 3.56 <0.001 2.42 1.92 3.03 <0.001
Table 2 Logistic regression models for utilization of dental calculus scaling in people with disabilities (continued)
Total-Adjusted Model Physical-Adjusted Model Mental-Adjusted Model Both-Adjusted Model
Variable OR 95% CI p OR 95% CI p OR 95% CI p OR 95% CI p Disability type Physical(ref) - - - Mental 0.95 0.93 0.97 <0.001 Both 0.88 0.83 0.92 <0.001 Disability severity Mild(ref) - - - Moderate 0.85 0.83 0.86 <0.001 0.83 0.82 0.85 <0.001 0.89 0.86 0.92 <0.001 0.74 0.27 2.01 0.553 Severe 0.66 0.65 0.67 <0.001 0.66 0.64 0.67 <0.001 0.72 0.69 0.76 <0.001 0.61 0.22 1.66 0.333 Profoundly 0.64 0.63 0.66 <0.001 0.65 0.64 0.67 <0.001 0.84 0.78 0.89 <0.001 0.5 0.18 1.37 0.177