Abstract
The influencing factors of the landslides were evaluated by comparing the occurrence of landslides in Lawnon River basin prior to and after the rainfall and earthquake events in recent 5 years (2005 ~ 2009). The landslide ratio in the study area was low (less than 4%) before 2007 and it significantly increased in the event of typhoon Morakot in 2009. The enormous accumulative rainfall is the major triggering factor. In addition, a major seismic activity in March 4 2008 is also vital to landslide occurrence. No evidential coseismic landslides were found in March 4 earthquake, 2008, however, the influence on slope stability has been observed from the apparent growth of landslide ratio in the four rainfall events followed by the quake. In addition, the existed landslide areas are more sensitive to landslide enlargement/development. The failure ratios of enlarged landslides is larger than those of new landslides, which indicates as a landslide occurs, it will be more easily to initiate subsequent failure nearby.
Keywords: Lawnon River, landslide, rainfall, earthquake.
1 Introduction
Taiwan is an island with abundant rainfall. The torrential rainfall accompanied with typhoons frequently causes slope failures such as landslides and debris flows. Moreover, as located in the Circum-Pacific Seismic Belt, an active mountain-building region, there are frequent earthquakes on the island. The dynamic effects caused by earthquakes also degrade the slope stability. Therefore, slopeland disasters are major natural hazards and threat to both human lives and environmental ecology in Taiwan. The Lawnon River basin in southern Taiwan, which is one of the
Paper 213
Evaluation of the Influence Factors on
Landslides in the Lawnon Basin, Taiwan
M.C. Weng, M.H. Wu, C.W. Yen and S.K. Ning
Department of Civil and Environmental Engineering
National University of Kaohsiung, Taiwan
©Civil-Comp Press, 2011
Proceedings of the Thirteenth International Conference on Civil, Structural and Environmental Engineering Computing, B.H.V. Topping and Y. Tsompanakis, (Editors),
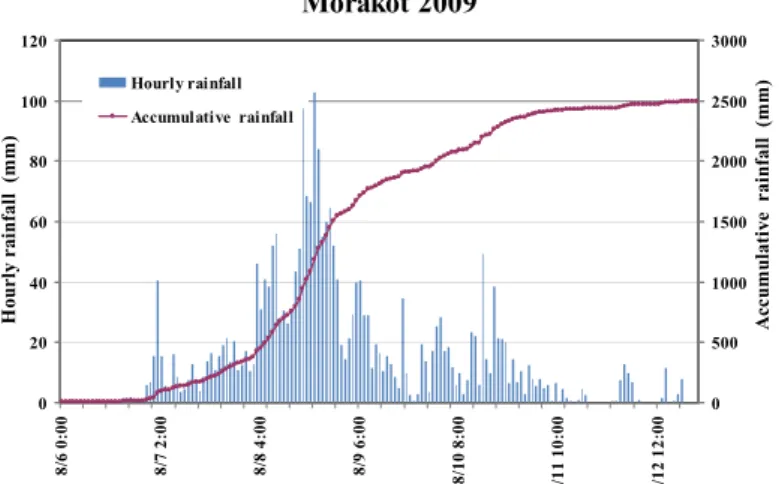
most important watersheds on the island, was selected for study in this study. Previous studies have rarely shown this basin is susceptible to landslides and debris flows. In early August of 2009, Typhoon Morakot attacked Taiwan, and caused significant loss of lives and property in Taiwan. 675 identified deaths and 24 persons missing were reported by the administration system. An economic loss of over US $5 billion has been incurred [1]. Accompanied with the typhoon movement, the southwest monsoon brought torrential rains primarily concentrated in the southern Taiwan. The accumulative rainfall in Lawnon River basin was up to 2500 mm, as shown in Fig. 1. Morakot was the most damaging typhoon to make rainfall in southern Taiwan in half a century. As one of the largest river basins in southern Taiwan, it suffered from the severest slope disasters during this event [2]. About 1218 landslides occurred and the cumulative landslide area exceeded 133.7 km2, which accounted for 6.6% of the entire basin’s area and led to various types of damage to the infrastructures and transportation systems. However, before typhoon Morakot, rare large scale landslides ware observed in this area. The potential and triggering factors of landslides in Lawnon River basin have seldom been studied and emphasized.
According to the previous studies [3-7], rainfall and earthquake are two of the principal mechanisms that induce landslides. For rainfall triggered landslides, precipitation data, such as accumulative precipitation and rainfall intensity, are usually applied to establish the thresholds of rainfall induced landslides [8-11]. On the other hand, as to earthquake triggered landslides, lots of studies have been focused on the characteristics of coseismic landslides, particularly those caused by large-scale earthquakes [3, 12-15]. Coseismic landslides may not be frequently found in the quakes, especially for those with limited scales. Nevertheless, after some seismic activities, the stability of slopes would be influenced for a long period of time. In recent years, more and more researchers paid attention on the subsequent landslides triggered by heavy rainfalls for a region that has suffered a catastrophic earthquake [16-19]. In addition to the triggering factors of landslides, it has been generally accepted that slope failures are related to causative factors such as geomorphology, lithology, geological structure and land cover [20-24]. Quantitative analysis of landslide record with triggering and causative factors is most fundamental in the digital investigation of landslide hazards. Introduction of the Geographical Information System (GIS) into landslide research has greatly enhanced the ability in collecting and analyzing the landslide data [23, 25]. Investigation of the relationship between landslides and the various factors causing landslides not only provides an insight into our understanding of landslide mechanisms, but can also form a basis for predicting future landslides and assessing the landslide hazard.
This paper aims to clarify the effects of rainfall and earthquake on landslide occurrence variation and the lithology, topography to slope failures. The Lawnon River basin, one of the largest river basins in southern Taiwan, is selected as the study area. Landslides identified from sixteen satellite images that cover the period 2005–2009 are used to differentiate the variations of landslide occurrence prior to and after the 10 typhoon and storm events.
Morakot 2009 0 20 40 60 80 100 120 8/ 6 0: 00 8/ 7 2: 00 8/ 8 4: 00 8/ 9 6: 00 8/ 10 8: 00 8/ 11 10: 00 8/ 12 12: 00 0 500 1000 1500 2000 2500 3000 Hourly rainfall Accumulative rainfall H ou rly r ain fa ll ( mm) A cc umu la tiv e ra in fa ll (mm)
(a) Hourly rainfall records at study area
(b) Isohyets of accumulative rainfall
2 Study Area
2.1 Preparation
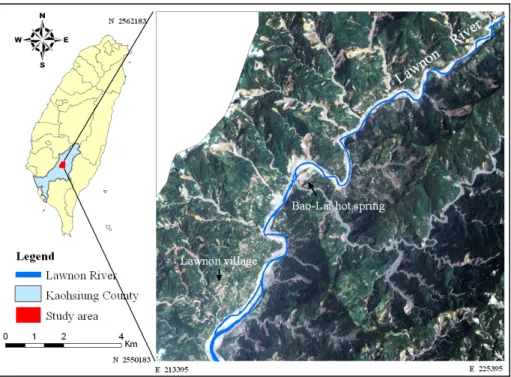
The Lawnon River basin with river length of 137 km and basin area of 1373 km2. The upstream of Lawnon River is typical valley topography, and it was formed along the Lawnon Fault, a major thrust fault in southern Taiwan. The downward and lateral incision resulted in the riverbank scouring and bank collapse as well as valley widening and riverbank retreating. The topographic characteristics of this section include river terraces, alluvial fans and steep riverbank slopes.
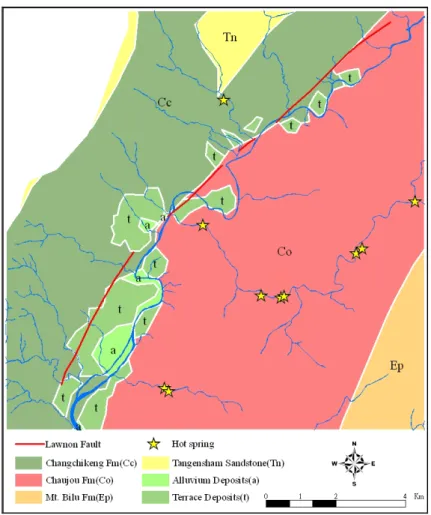
Figure 2 illustrates the study area in this research, which is located in the upstream of Lawnon River Basin, around the Bao-Lai hot spring area with ambit of 130.4 km2. Bao-Lai hot spring region, the most populous area in the neighborhood, suffered severe landslides and flood in Typhoon Morakot. For the geology in the study area, it contains four rock formations, including Tangenshan Sandstone (Tn), Changchikeng Fm.(Cc), Chaujou Fm.(Co), and Mt. Bilu Fm.(Ep). Among them, Tangenshan Sandstone (Tn) and Changchikeng Fm.(Cc) belong to sedimentary rock areas, and Chaujou Fm.(Co) and Mt. Bilu Fm.(Ep) belong to metamorphic rock areas. The geological formations of study area are shown in Fig. 3. In addition, there are 11 hot spring sites within the study area, mostly located in Chaujou Fm.(Co). The geological ages, lithologies and rock compressive strengths corresponding to the geological formations are shown in Table 1.
Formation Geological age Lithology UCS (MPa) Tangenshan (Tn)
Miocene-Pliocene Thick-bedded to massive graywacke 65.2 Changchikeng (Cc) Miocene Light gray fine-grained
sandstone with intercalations of shale
41.3
Chaujou (Co) Miocene Black argillite with occasional inter-beds of sandstone
29.9
Mt. Bilu (Ep) Eocene Black slate and phyllite with occasional inter-beds of sandstone
33.1
Table 1 Lithological characteristics of the rock in the study area
3 Methodology
3.1 Data sources and database
3.1.1 Rainfall
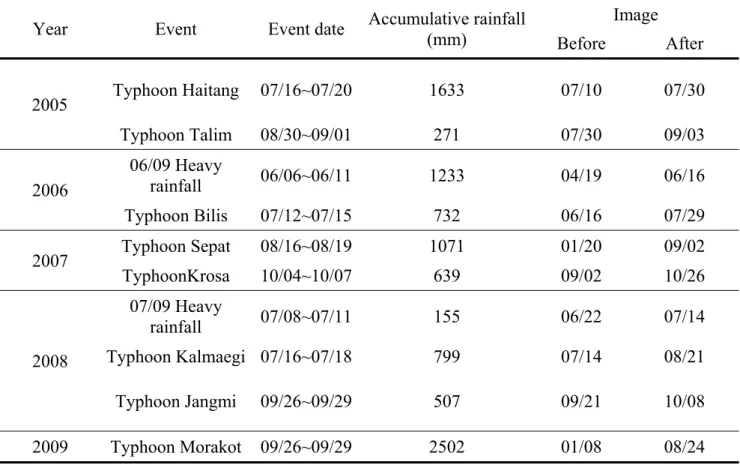
The hourly rainfall data for 12 rain observation stations (auto-gauges) in the study area neighborhood were supplied by the Water Resource Agency (WRA) and Central Weather Bureau (CWB) in Taiwan in digital files. The extremely heavy rainfall data from 2005 to 2009 were collected to evaluate the precipitation effects on landslides. The definition of extremely heavy rainfall events by CWB are those with 24- hour accumulative rainfall over 130 mm in depth, and the data were collected from the rainfall observation stations within 15 kilometers of Bao-Lai area. Through pre-analysis of the rainfall data, 10 remarkable typhoon and storm events with extreme heavy rainfall from 2005 to 2009 were selected for this study, as listed in Table 2, and the corresponding rainfall data were collected for further statistical and spatial isohyet analyses.
Year Event Event date Accumulative rainfall (mm) Image Before After 2005 Typhoon Haitang 07/16~07/20 1633 07/10 07/30 Typhoon Talim 08/30~09/01 271 07/30 09/03 2006 06/09 Heavy rainfall 06/06~06/11 1233 04/19 06/16 Typhoon Bilis 07/12~07/15 732 06/16 07/29 2007 Typhoon Sepat 08/16~08/19 1071 01/20 09/02 TyphoonKrosa 10/04~10/07 639 09/02 10/26 2008 07/09 Heavy rainfall 07/08~07/11 155 06/22 07/14 Typhoon Kalmaegi 07/16~07/18 799 07/14 08/21 Typhoon Jangmi 09/26~09/29 507 09/21 10/08 2009 Typhoon Morakot 09/26~09/29 2502 01/08 08/24
3.1.2 Satellite images
In this study, 16 images from FORMOSAT-II satellite, listed in Table 2, were selected based on the point in time before and after the 10 significant typhoon and storm events from 2005 to 2009. FORMOSAT-II satellite is a sun-synchronous satellite with the orbit height of 891 km. It has high-resolution and daily revisit imagery and four bands with 8-m resolution color mode and 2-m resolution panchromatic mode. Colorful image includes blue, green, red and near infrared bands corresponding to the wavelength of 0.45~0.52m, 0.52~0.60m, 0.63~0.69m and 0.76~ 0.90m, respectively. Since the images were used to recognize the landslide areas in our study domain, the selected images were required to be cloud-free. Following the selection of satellite images, the preprocessing tasks including geometric correction and radiometric correction were carried out before the analysis of the images.
3.1.3 Earthquakes
The records of seismic activities from 2005 to 2009 were collected from Jiasian seismic station (maintained by CWB), which is the closest seismic monitoring station to the study area. There were 10 events with detected seismic intensity larger than 2 (larger than 8 gals) selected. The magnitudes and induced peak ground accelerations at the study area were analyzed.
3.1.4 Geological and Topographical data
Geological and Topographical data were collected from 1:25,000 paper maps published by the Central Geological Survey (CGS) in Taiwan. The data were stored in vector format within the Arc/info GIS software through manual digitization. A digital elevation model (DEM) of 40×40 m was constructed from the topographical dataset, and maps of slope inclination angle and aspect distribution were then derived from the DEM. River networks, roads, and other basic geographical data were also digitized from the basic topographic maps.
3.2 Data digitization and mapping
The accumulative rainfall of each rain observation station was calculated through summing up the hourly records within the whole storm event. The accumulative rainfall data of 12 observation stations distributed within the study area was processed to create the isohyets for 10 typhoon and storm events. The spatial analyst function of the GIS was adopted to conduct this work.
The landslides were recognized from the satellite images and the sliding areas were manually digitized with the Arc/info GIS software. The territory of digitization is the study area in this research, which is 130.4 km2 around the Bao-Lai area. Reconnaissance works and in-situ observations have been executed in the domain to understand the geological and topographical conditions which could not be shown in
the satellite images. Since this study is focused on the landslide areas, debris flows were not taken into consideration. In order to separate transportation and deposition segments of debris flows from the study area, this study took only slopeland with gradient larger than 25 degrees into account for later analysis [26]. In addition, the aforementioned geological and topographical maps and hot spring sites were also digitized on the GIS platform.
3.3 Landslide categorization
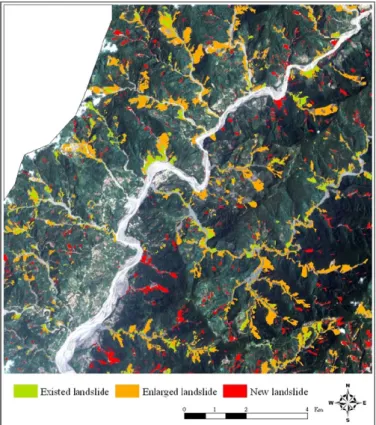
To better determine the characteristics of landslides in different satellite images, landslides recognized in each image were firstly classified into existed landslides and incremental landslides. The incremental landslides stand for the difference in landslide images before and after a storm event. Therefore, the incremental landslides indicate the landslides induced by a specific event between two images. The existed landslides represent the overlap landslides in landslide images before and after the storm event. In order to assess how many landslides are expanded from existed landslides, incremental landslides are further classified into new landslides and enlarged landslides. New landslides are landslides that can only be observed in the new image, and enlarged landslides are landslides expanded from existed landslides in the previous image. Figure 4 illustrates the distributions of existed landslides, enlarged landslides and new landslides caused by rainfall of typhoon Morakot.
3.4 Attribute assignment and combined database of landslides
Assignment of the various kinds of attributes to individual digitized landslides is critical to a quantitative analysis of the relationship between landslides and their causative factors. It is known that gathering and handling of the various attributes of landslides is an effort-consuming task, and abundance of field reconnaissance work is usually required. The use of GIS makes the management of digital databases more and more quickly and accurately to users. Connecting the landslide database with other internal/external databases is an efficient way of assigning causative factor values to individual landslides.
3.5 Spatial relationship of landslides and their triggering &
causative factors
In this study, to understand the relationship between landslides and triggering factors (rainfall and earthquake) and causative factors (lithology, geological structure, topography and hot spring sites), the spatial overlay function of the GIS was adopted to carry out the task. For example, overlaying lithology coverage with landslide coverage through the Union operator in Arc/Info will tag each landslide with a lithology index. The combined database includes not only the basic items stored in the landslide coverage, but also the new items such as lithology type from the lithology coverage. It provided a substantial basis for further analysis of the relationship between landslides and their causative factors.
4 Analysis results
4.1 Influence of rainfall on landslides
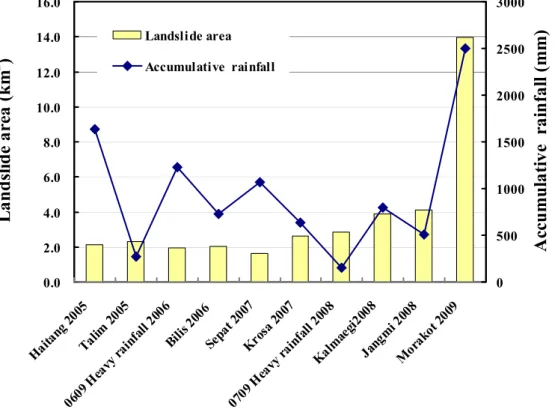
Rainfall, especially in the form of rainstorm, is the dominant factor that induces landslides. In this study, the accumulative rainfall of each event analyzed calculated from the hourly gauge data of 12 gauge stations were used. With the combination of accumulative rainfall data and landslide area of each storm event in Fig. 5, it is observed that landslide regions of the study area are growing in recent 5 years, even though some small recovery appeared between two consecutive events. The occurrence of landslides has close relation to rainfall amounts. As seen in Fig. 5, before 2008, the variation of rainfall within the study area was not obvious, so that the variation of landslide areas was not significant. The extreme rainfall brought by Typhoon Morakot in 2009 remarkably increased the scale of landslides. It is evident that rainfall dominates the scale of landslides. In comparison of rainfall data among the events, typhoon Morakot has the highest accumulative precipitation (2502 mm in average), followed by typhoon Haitang (1882 mm in average). However, the average landslide area induced by typhoon Haitang was only 2.1 km2, much less than those induced by typhoon Jangmi and Kalmaegi in 2008, which is worth further exploring.
0.0 2.0 4.0 6.0 8.0 10.0 12.0 14.0 16.0 Haita ng 20 05 Talim 2005 0609 Heavy rain fall 2 006 Bilis 2006 Sepa t 2007 Kros a 2007 0709 Hea vy rai nfall 2008 Kalm aegi2 008 Jang mi 20 08 Mora kot 20 09 L an d sl id e a rea ( k m 2 ) 0 500 1000 1500 2000 2500 3000 A cc u m u la ti ve r ain fa ll ( m m ) Landslide area Accumulative rainfall
Figure 5 Variation of landslide area in different rainfall events.
4.2 Influence of lithology on landslides
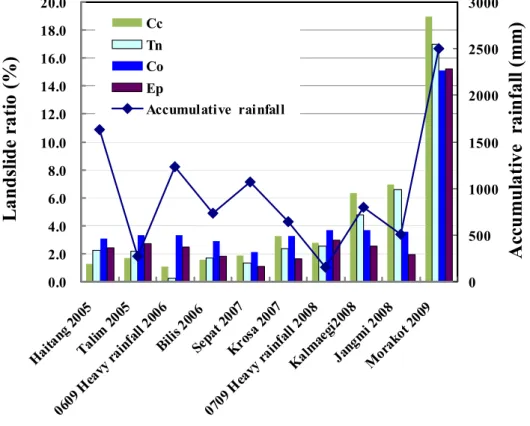
Figure 6 shows the variations of landslide ratio with respect to each geological zone, and the corresponded accumulative precipitation record is also plotted. Landslide ratio is defined as the percentage of sum of landslide area divided by total area within a specific geological zone. It is observed that landslide ratio of each geological zone remained below 4% generally before 2008. From 2008, landslide ratios began to increase obviously, especially for sedimentary rock (Formations Cc and Tn). Similar to the observation in section 4.1, the average landslide ratio induced by typhoon Haitang was only 2%, much less than those induced by typhoon Jangmi and Kalmaegi in 2008. Furthermore, it was recognized that before 0709 rainstorm in 2008, the landslide ratios of metamorphic rock areas (Co and Ep) were higher than those of sedimentary rock areas (Tn and Cc). After then, the situations reversed-the sedimentary rock areas became less stable compared to the metamorphic rock areas, which implies the condition of slope stability in the study area was disturbed in 2008.
0.0 2.0 4.0 6.0 8.0 10.0 12.0 14.0 16.0 18.0 20.0 Haitan g 200 5 Talim 2005 0609 Heav y rai nfall 2006 Bilis 2006 Sepa t 200 7 Kros a 200 7 0709 Heav y rai nfall 2 008 Kalma egi20 08 Jang mi 20 08 Morak ot 20 09 L ands lide r at io ( % ) 0 500 1000 1500 2000 2500 3000 Ac cu m u la ti ve r ai n fal l (m m ) Cc Tn Co Ep Accumulative rainfall
Figure 6 Variation of landslide ratios with respect to different geological formations.
Figure 7 shows the variations of failure ratios for three terms of landslides (existed, enlarged, and new landslides) with respect to different geological formations. It shows that the landslide ratio is positively correlated to accumulative rainfall. It is also found that as accumulative rainfall increases, the ratio of enlarged landslides is higher than that of new slides. The landslides induced by extreme rainfall mostly belong to enlarged slides.
Tn 0.0 2.0 4.0 6.0 8.0 10.0 12.0 14.0 16.0 0 500 1000 1500 2000 2500 3000 Accumulative rainfall (mm) L ands lid e r ati o (% ) Enlarged landslide New landslide Incremental landslide Cc 0.0 2.0 4.0 6.0 8.0 10.0 12.0 14.0 16.0 0 500 1000 1500 2000 2500 3000 Accumulative rainfall (mm) L and sl id e r ati o (% ) Enlarged landslide New landslide Incremental landslide
Co 0.0 2.0 4.0 6.0 8.0 10.0 12.0 14.0 16.0 0 500 1000 1500 2000 2500 3000 Accumulative rainfall (mm) L an d sl id e r ati o (% ) Enlarged landslide New landslide Incremental landslide Ep 0.0 2.0 4.0 6.0 8.0 10.0 12.0 14.0 16.0 0 500 1000 1500 2000 2500 3000 Accumulative rainfall (mm) La n d sl id e r at io ( % ) Enlarged landslide New landslide Incremental landslide
(c) Chaujou (Co) formation (d) Mt. Bilu (Ep) formation Figure 7 Relationship between landslide ratio (enlarged, new and incremental landslides) and accumulative rainfall.
4.3 Influence of seismic activities on landslides
Though the higher accumulative rainfall leads to the increase of landslide ratios in general, it is noticed that two significant singular records with accumulative rainfalls of 500 mm and 730 mm do not conform to the pattern (Fig. 7). In order to investigate the influence of other landslide-triggering factors, a further examination is placed on the seismic events around the study area.
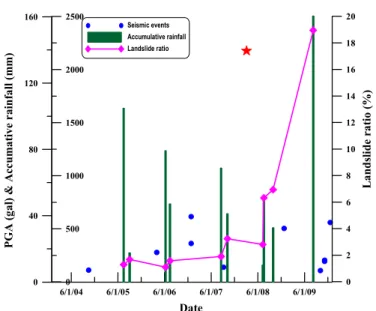
The records of seismic activities were collected from Jiasian seismic station. From 2005 to 2009, there were 10 earthquake events with detected seismic intensity larger than 2 (PGA ≧ 8 gals) were selected. The peak ground acceleration of each event is plotted in Fig. 8. Observed from Fig. 8, a remarkable earthquake with PGA close to 140 gals occurred on March 4, 2008, which is much larger than the other quakes. By looking back at Fig. 5, we can see that the landslide ratio increases apparently since 2008. The seismic event might play an important role in this transition. Therefore, to evaluate the influence of the earthquake, the relationship between accumulative rainfall and landslide ratio prior to and after March 4 earthquake in 2008 is shown in Fig. 9. Before the earthquake, the landslide ratios under various accumulative rainfall conditions fell below 2% in all geological zones. After the earthquake, the landslide ratios increases remarkably, especially in terms of enlarged landslides. Figure 10 illustrates the variations of landslide ratios within the four rock formations. It is observed that before the earthquake in 2008, the landslides frequently occurred in formation Co, however, after the earthquake the landslide ratios of sedimentary formations (Cc and Tn) surpassed those of metamorphic rock areas (Co and Ep). Note that the effects of locations for seismic events as well as and intensity distributions were not considered in the analyses.
6/1/04 6/1/05 6/1/06 6/1/07 6/1/08 6/1/09 Date 0 40 80 120 160 PG A (g al) & Acc u ma tive r ain fa ll ( m m ) 0 2 4 6 8 10 12 14 16 18 20 La nd sli d e ra ti o ( % ) 0 500 1000 1500 2000 2500 Seismic events Accumulative rainfall Landslide ratio
Figure 8 Measured peak ground accelerations (PGA) from 2005 to 2009.
Tn R2 = 0.997 R2 = 0.424 0.0 2.0 4.0 6.0 8.0 10.0 12.0 14.0 0 500 1000 1500 2000 2500 3000 Accumulative rainfall (mm) L ands lid e r ati o (% ) Enlarged landslide New landslide Enlarged landslide after 2008 New landslide after 2008
Cc R2 = 0.999 R2 =0.999 0.0 2.0 4.0 6.0 8.0 10.0 12.0 14.0 0 500 1000 1500 2000 2500 3000 Accumulative rainfall (mm) L ands lide r ati o (% ) Enlarged landslide New landslide Enlarged landslide after 2008 New landslide after 2008
(e) Tangenshan (Tn) formation (f) Changchikeng (Cc) formation
Co R2 = 0.985 R2 = 0.969 0.0 2.0 4.0 6.0 8.0 10.0 0 500 1000 1500 2000 2500 3000 Accumulative rainfall (mm) L an d sl id e ra ti o ( % ) Enlarged landslide New landslide Enlarged landslide after 2008 New landslide after 2008
Ep R2 = 0.971 R2 = 0.992 0.0 2.0 4.0 6.0 8.0 10.0 0 500 1000 1500 2000 2500 3000 Accumulative rainfall (mm) L an d sl id e r ati o (% ) Enlarged landslide New landslide Enlarged landslide after 2008 New landslide after 2008
(g) Chaujou (Co) formation (h) Mt. Bilu (Ep) formation Figure 9 Relationships between accumulative rainfall and landslide ratio before and
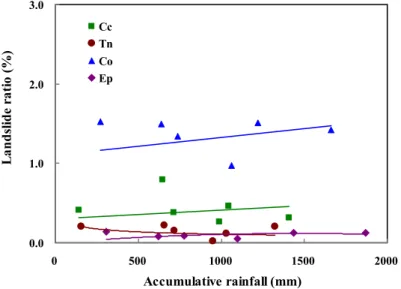
0.0 1.0 2.0 3.0 0 500 1000 1500 2000 Accumulative rainfall (mm) L an d sl id e ra ti o ( % ) Cc Tn Co Ep
(a) Incremental landslide before 2008
0.0 2.0 4.0 6.0 8.0 10.0 12.0 14.0 16.0 18.0 0 500 1000 1500 2000 2500 3000 Accumulative rainfall (mm) L an d sl id e ra ti o ( % ) Cc Tn Co Ep
(b) Incremental landslide after 2008
Figure 10 Comparison of incremental landslide ratio with respect to different geological formations.
5 Conclusion
The present study investigates the triggering and causative factors of the storm event-induced landslides in Lawnon River basin from 2005 to 2009. The analysis results led to the following conclusions:
1. From 2005 to 2009, the landslide events and scales increased year by year and reached the peak value at the storm event of typhoon Morakot 2009, which arouse people's attention on the landslide behavior in this area. Undoubtedly,
rainfall is one of the primary triggering factors to cause the slides. However, in comparison of rainfall data among the events except typhoon Morakot, typhoon Haitang in 2005 had higher accumulative rainfall (1882 mm in average) than the other storm events, but its landslide area is smaller than those of most storm events. The patterns of landslide scale variation and rainfall record seem to be identical after 2008, which implies the existence of other factor(s) to trigger the transition of landslide sensitivity.
2. Earthquake is another primary triggering mechanism to induce landslides. Different from the landslide behavior observed in central Taiwan during 1999 Chi-Chi earthquake (ML=7.3), co-seismic landslides are not frequently found in
Lawnon River basin during the quakes from 2005 to 2009, which is possibly due to the limited seismic intensities. Nevertheless, it is well accepted that after an earthquake, the stability of slopes would be influenced for a long time [16-19]. In this study, March 4 earthquake in 2008 with PGA close to 140 gals is inferred to disturb the slope stability so as to result in the apparent increment of landslide ratios in the 4 rainfall events since July, 2008. Note that the critical seismic intensity leading to the transition of slope stability is not determined in this study.
3. The lithological effect on landslide sensitivity is unobvious before the March 4 earthquake in 2008. After the quake, the sedimentary formations (Cc and Tn) is more prone to the increment of landslide ratios compared to metamorphic rock areas (Co and Ep).
4. It is observed that the existed landslide areas are more sensitive to landslide enlargement/development. The failure ratios of enlarged landslides is larger than those of new landslides, which indicates as a landslide occurs, it will be more easily to initiate subsequent failure nearby. As a result, the soil and water conservation works should be taken up soon to prevent further development of failure slopes.
Acknowledgement
The research is supported by the National Science Council of Taiwan, Grant No. NSC 99-2218-E-002 -033 and China Engineering Consultants, Inc., Plan No. 99925.
References
[1] H.I. Ling, F.Y. Menq, M.H. Wu, Y.C. Huang, C.W. Hsu, “Reconnaissance report of the august 8, 2009 typhoon morakot; Taiwan”, GEER Association Report No. GEER-018, New York, 2009.
[2] T.C. Chen, C.C. Wu, M.C. Weng, K.H. Hsieh, C.C. Wang, “Slope failure of Lawnon basin induced by Typhoon Morakot”, Sino-Geotechnics, 122, 13–20, 2009. (in Chinese)
[3] D.K. Keefer, “Landslides caused by earthquakes”, Bulletin of Geological Society of America 95, 406–421, 1984.
[4] R.L. Schuster, A.S. Nieto, T.D. O'ouke, E. Crespo, G. Plaza-Nieto, “Mass wasting triggered by the 5 March 1987 Ecuador earthquakes”, Engineering Geology 42, 1–23, 1996.
[5] G.B. Crosta, “Introduction to the special issue on rainfall triggered landslides and debris flows”, Engineering Geology 73, 191–192, 2004.
[6] C.T. Lee, C.C. Huang, J.F. Lee, K.L. Pan, M.L. Lin, J.J. Dong, “Statistical approach to earthquake-induced landslide susceptibility”, Engineering Geology 100(1-2), 43–58, 2008.
[7] C.T. Lee, C.C. Huang, J.F. Lee, K.L. Pan, M.L. Lin, J.J. Dong, “Statistical approach to storm event-induced landslide susceptibility”, Natural Hazard and Earth System Sciences, 8, 941-960, 2008.
[8] N. Caine, “The rainfall intensity-during control of shallow landslides and debris flows”, Geografiska Annaler, 62, 23–27, 1980.
[9] D.F. Vandine, “Debris flows and debris torrents in the Southern Canadian Cordillera”, Canada Geotechnique Journal 22, 44–68, 1985.
[10] D.K. Keefer, R.C. Wilson, R.K. Mark, E.E. Brabb, W.M. Brown III, S.D. Ellen, E.L. Harp, G.F. Wieczorek, C.S. Alger, R.S. Zatkin, “Real-time landslide warning during heavy rainfall”, Science, 238, 921–925, 1987.
[11] C.Y. Chen, T.C. Chen, F.C. Yu, W.H. Yu, C.C. Tseng, “Rainfall duration and debris-flow initiated studies for real-time monitoring”, Environmental Geology, 47, 715–724, 2005.
[12] E.L. Harp, K. Schmidt, R. Wilson, D.K. Keefer, R.W. Jipson, “Effects of landslides coseismic fractures triggered by the 17 October 1989 Loma Prieta, California Earthquake”, Landslide News 5, 18–22, 1991.
[13] R.W. Jibson, C.S. Prentice, B.A. Borissoff, E.A. Rogozhin, C.L. Langer, “Some observations of landslides triggered by the 29 April 1991 Racha earthquake, Republic of Georgia”, Bulletin of the Seismological Society of America 84, 964–973, 1994.
[14] E.L.Harp, R.W. Jibson, “Landslides triggered by the 1994 Northridge, California earthquake”, Bulletin of the Seismological Society of America 86, 319–332, 1996.
[15] B. Khazai, N. Sitar, “Evaluation of factors controlling earthquake-induced landslides caused by Chi-Chi earthquake and comparison with the Northridge and Loma Prieta events”, Engineering Geology 71, 79–95, 2004.
[16] C.W. Lin, C.L. Shieh, B.D. Yuan, Y.C. Shieh, S.H. Liu, S.Y. Lee, “Impact of Chi-Chi earthquake on the occurrence of landslides and debris flows: example from the Chenyulan River watershed, Nantou, Taiwan”, Engineering Geology 71, 49–61, 2004.
[17] C.W. Lin, S.H. Liu, S.Y. Lee, C.C. Liu, “Impacts of the Chi-Chi earthquake on subsequent rainfall-induced landslides in central Taiwan”, Engineering Geology 86, 87–101, 2006.
[18] S.J. Chiou, C.T. Cheng, S.M. Hsu, Y.H. Lin, S.Y. Chi, “Evaluating landslides andsediment yields induced by the Chi-Chi Earthquake and following heavy rainfalls along the Ta-Chia River”, Journal of GeoEngineering 2, 73–82, 2007. [19] C.Y. Chen, “Sedimentary impacts from landslides in the Tachia River Basin,
[20] D.H. Radbruch-Hall, D.J. Varnes, W.Z. Savge, “Gravitational speeding of steep-sided ridges (“sacking”) in Western United States”, Bull. Int. Assoc. Eng. Geol. 14, 23–35, 1976.
[21] A. Carrara, “Multivariate models for landslide hazard evaluation”, Math. Geol. 153, 403–427, 1983.
[22] D.J. Varnes, “Landslide hazard zonation: a review of principles and practice”, UNESCO, Paris, 63, 1984.
[23] A. Hansen, “Engineering geomorphology: the application of an evolutionary model of Hong Kong's terrain”, Z. Geomorphol., Suppl. 51, 39–50, 1984. [24] D.M. Cruden, “A simple definition of a landslide”, Bull. Assoc. Eng. Geol. 43,
27–29, 1993.
[25] F.C. Dai, C.F. Lee, “Landslide characteristics and slope instability modeling using GIS, Lantau Island, Hong Kong”, Geomorphology 42, 213–228, 2002. [26] C.C. Huang, Y.L. Lee, J.F. Lee, T.M. Huang, Z.J. Kao, Y.P. Wang, “The
characteristics and distributions of landslides and debris flows in watershed areas”, Proceedings, 2009 Conference of watershed geology and slopeland disaster, 2009. (in Chinese)