中國大陸各區域之有效率的能源與廢棄物減量目標
82
0
0
全文
(2) 國立交通大學 經營管理研究所 博 士 論 文 No.117. 中國大陸各區域之有效率的能源與廢棄物減量目標. Efficient Energy Savings and Waste Abatements for Regions in Mainland China. 研 究 生:李曜純 研究指導委員會:丁. 承. 教授. 胡均立. 教授. 許和鈞. 教授. 指導教授:胡均立. 教授. 中 華 民 國 九十六 年 四 月 i.
(3) 中國大陸各區域之有效率的能源與廢棄物減量目標 Efficient Energy Savings and Waste Abatements for Regions in Mainland China. 研 究 生:李曜純. Student:Yao-Chun Lee. 指導教授:胡均立. Advisor:Jin-Li Hu. 國 立 交 通 大 學 經 營 管 理 研 究 所 博 士 論 文. A Dissertation Submitted to Institute of Business and Management College of Management National Chiao Tung University in Partial Fulfillment of the Requirements for the Degree of Doctor of Philosophy in Business and Management April 2007 Taipei, Taiwan, Republic of China 中華民國九十六年四月. ii.
(4) 中國大陸各區域之有效率的能源與廢棄物減量目標. 研究生:李曜純. 指導教授:胡均立. 國立交通大學經營管理研究所博士班. 中文摘要. 能源的改變與轉換使得任何事情都有可能發生。我們買能源、出 售能源,吃能源、浪費能源、儲存能源,更為能源而戰。能源是經濟 活動的動力,它包含所有經過轉換而被使用的自然資源。但是過度地 使用能源將引起能源短缺、能源危機、能源價格上漲及環境污染等問 題。這些環境污染更將透過食物鏈而間接危害所有生物的健康和生命。 中國大陸目前正從一個耗能、低效率且嚴重污染的經濟發展模式 過渡成一個節能、高效率且少污染的經濟發展模式。在新燃料及替代 能源具可行性及經濟性以前,為維持經濟發展的需要,節能與減廢便 成為中國大陸在制定環境政策上的兩大主軸。 本研究主要在計算2000-2003年期間中國大陸27個地區其三種主 要能源與三種主要工業廢棄物之有效率的減量。本研究以單一產出項 (實質國內生產毛額) 與五個投入項 (勞動、實質資本存量、耗煤量、 耗汽油量及耗電量) 透過資料包絡分析法計算出每年每個地區之每種 能源的目標消耗量。相同的,本研究也以單一產出項 (實質國內生產. iii.
(5) 毛額) 與五個投入項 (勞動、實質資本存量、固體廢棄物產量、廢水量 及廢氣量) 透過相同的方法計算出每年每個地區之每種廢棄物的目標 廢棄量。 有別於傳統著重於效率的DEA模型,本研究的主要貢獻在於建立 一個投入項的減量指標,透過目標消耗量 (廢棄量) 與實際消耗量 (實 際廢棄量) 計算出每年每個地區在每一種能源 (廢棄物) 上之有效率 的減量比率。本研究主要發現如下︰1. 在2000-2003年間,東部地區每 一年都最有效率於三種能源與三種廢棄物上。2. 上海與廣東皆處於生 產的效率前緣並成為中國大陸所有地區的標竿。3. 陝西和甘肅擁有最 高的三種能源減量比率與三種廢棄物減量比率,代表此兩者是全中國 大陸最無效率的兩個地區。4. 在三種能源減量與三種廢棄物減量中, 煤耗減量與固體廢棄物減量是中國大陸當前最緊急的任務。. 關鍵詞:永續發展、空氣污染、資料包絡分析法、煤、汽油、電、固 體廢棄物、廢水、廢氣. iv.
(6) Efficient Energy Savings and Waste Abatements for Regions in Mainland China. Student:Yao-Chun Lee. Advisor:Dr. Jin-Li Hu. Institute of Business and Management National Chiao Tung University. ABSTRACT Energy changes and transformations make things happen.. We buy energy, sell. energy, eat energy, waste energy, talk a little about conserving energy, and fight over energy.. Energy, a motive force of the economic activity, includes all natural resources. that can be used after changing. However, overusing energy will cause the energy shortage, energy crisis, the price of energy going up, and environment pollution. In particular, environment pollution will endanger the organism’s health and life through the food chain indirectly. Mainland China is in a transition period from a highly energy-consuming, low-efficiency, and heavily polluting economic development pattern to an energy saving, high-efficiency, and less polluting economic development pattern.. Before new. and alternative fuels become available, improving energy saving and waste reducing are two necessities for mainland China to design national environmental policy while remaining its economic development possibilities. This thesis’s main contribution is to create an input abatement index which different from the traditional DEA model. v. This thesis computes the efficient.
(7) abatements of three major types of energy and three major types of industrial waste for twenty-seven regions in mainland China during the period 2000-2003.. The data. envelopment analysis (DEA) with a single output (real GDP) and five inputs (labor, real capital stock, coal consumption, gasoline consumption, and electricity consumption) is used to compute the target energy inputs of each region for each year.. Besides, a. single output (real GDP) and five inputs (labor, real capital stock, solid wastes, waste water, and waste gas) is used to compute the target waste inputs of each region for each year by the same method. The efficient abatements ratios of each region in each year then are obtained by comparing the target inputs to the actual inputs. Our major findings are as follows:. 1.. East area contains most of the efficient regions with respect to three major types of energy and three major types of waste in every year during the research period. 2. Shanghai and Guangdong are producing outputs efficiently with respect to the Chinese production frontier and to be the benchmark for regions in mainland China.. 3. Shaanxi. and Gansu have the high target abatements ratios of all energy and all waste, implying that the two regions are most inefficient in mainland China. 4. Comparing to the three major types of energy and three major types of waste, coal consumption saving and solid waste reduction is mainland China’s most urgent task.. Keywords:. sustainable development, air pollution abatement, data envelopment analysis, coal, gasoline, electricity, solid wastes, waste water, waste gas. vi.
(8) 謝. 誌. 盼了整整六年,終於等到這光榮的一刻。回顧這六年來,交雜著 無數次的歡笑與淚水,更曾因數度被退稿而感到深深的痛苦與無力。 然而,正因為這一切是如此的得來不易,讓我倍加珍惜這甜美的果實。 這一路上,我最要感謝的人就是我的指導教授胡均立博士,他總 是不厭其煩的給予我許多的指導與協助。在我感到痛苦無助時,他即 時的鼓勵使我化悲憤為力量,有了持續研究的動力。從他身上我學習 到如何為人師表的典範,這給了同樣身為人師的我一個很大的啟示。 同時我也要感謝博士論文指導委員會的師長丁承教授與許和鈞教 授,以及論文計畫書口試委員許鉅秉教授的指導及建議。更要感謝博 士口試委員邱永和教授、邱俊榮教授、廖森貴教授及陳照明教授的寶 貴建議,使得論文內容及結構得以更為完善及充實。 還要感謝所上的蕭慧娟小姐、林育萍小姐、張子溥學弟與葉芳瑜 學妹給予許多的幫忙協助。而與我同屆的博士班同學們更是經常與我 分享生活中的大小事、傾聽我的苦水、給我加油打氣,你們的友誼我 這一輩子都不會忘記。此外,所有在我論文寫作期間曾經鼓勵及協助 我的朋友們實在太多,無法一一列舉,謹在此獻上我最誠摯的感謝。 最後,我要將博士學位的成果獻給我最敬愛的父母親與最親愛的 老公與兒子,感謝父母親的養育及栽培、感謝老公的包容與支持、感 謝可愛的兒子總是讓我的人生充滿快樂與欣慰。正因為有你們,才有 今天的我,所以我要將這份榮耀與你們分享。. 李曜純 謹致 中華民國 96 年 4 月 17 日 vii.
(9) Table of Contents 中文摘要……………………………………………………………………………... i. ABSTRACT…………………………………………………………………………. iii. 誌. 謝……………………………………………………………………………... v. Table of Contents…………………………………………………………………… vi List of Tables……………………………………………………………………….. viii List of Figures……………………………………………………………………….. x. List of Abbreviations………………………………………………………………... xi. Chapter 1 Introduction……………………………………………………………... 1. 1.1 Research motivation……………………………………………………….... 1. 1.2 Research purpose……………………………………………………………. 3. 1.3 Organization of the dissertation…………………………………………….. 4. Chapter 2 Energy and Waste in Mainland China……………………………….... 7. 2.1 Three major Types of Energy……………………………………………….. 7. 2.1.1 Coal Consumption…………………………...………………………. 7. 2.1.2 Oil Consumption………………………………………..………….... 8. 2.1.3 Electricity Consumption……………….……………………………. 10 2.2 Three Major Types of Waste……………………………………………….. 12 2.2.1 Solid Wastes Produced……………………………………...……..... 12 2.2.2 Waste Water Discharged……………………………………………. 14 2.2.3 Waste Gas Emission……………………………………….………... 17 Chapter 3 Research Design………………………………………………………... 20 3.1. Methodology of Data Envelopment Analysis (DEA)……………………... 20 3.2 Abatement Evaluation………….................................................................... 21 2.3 Data Sources…………………………………………………...…………… 24 3.4 Descriptive Statistics……………………………………………………….. 26 4. Empirical Analysis……………………………………………………………….. 29 4.1 Energy of Mainland China …………............................................................ 29 4.1.1 Regional Savings Ratios for Three Major Types of Energy…….... 29. 4.1.1.1 Savings Ratios for Coal Consumption…………………….. 29. viii.
(10) 4.1.1.2 Savings Ratios for Gasoline Consumption………………... 32. 4.1.1.3 Savings Ratios for Electricity Consumption………………. 36. 4.1.2 Benchmark for Three Types of Energy Savings Ratios…………. 39. 4.1.3 General Comments on Three Types of Energy Savings…………. 40. 4.2 Waste of Mainland China…………………………………………………... 43 4.2.1 Regional Abatements Ratios for Three Industrial Wastes………….. 43 4.2.1.1 Abatements Ratios for Solid Wastes Produced………………. 43 4.2.1.2 Abatements Ratios for Waste Water Discharged…………….. 46 4.2.1.3 Abatements Ratios for Waste Gas Emission…………………. 50 4.2.2 Benchmark for Three Industrial Wastes Abatements Ratios………. 54. 4.2.3 General Comments on Three Industrial Wastes Abatements……….. 54 Chapter 5 Concluding Remarks…………………………………………………... 58 References…………………………………………………………………………... 62 Curriculum Vitae…………………………………………………………………... 68. ix.
(11) List of Tables Table 1. Coal consumption by sector…………………………………………………. 8. Table 2. Oil consumption by sector…………………………………………………... 9. Table 3. Electricity consumption by sector…………………………………………... 11. Table 4. Industrial Solid wastes produced by sector…………………………………. 13. Table 5. Industrial waste water discharged by sector………………………………... 16. Table 6. Industrial waste gas emission by sector…………………………………….. 18. Table 7. Summary statistics of inputs and outputs by year…………………………... 26. Table 8. Summary statistics of inputs and outputs by area…………………………... 27. Table 9. Correlation coefficients between inputs and the output…………………….. 28. Table 10. Actual consumption and target savings ratios of coal for regions in 30 mainland China during 2000-2003………………………………………….. Table 11. Mann-Whitney test on target coal savings ratios for three major areas….... Table 12. Actual consumption and target savings ratios of gasoline for regions in 34 mainland China during 2000-2003………………………………………….. Table 13. Mann-Whitney test on target gasoline savings ratios for three major areas. Table 14. Actual consumption and target savings ratios of electricity for regions in 37 mainland China during 2000-2003………………………………………….. Table 15. Mann-Whitney test on target electricity savings ratios for three major 39 areas…………………………………………………………………………. Table 16. Average overall technical efficiency for regions in mainland China during 41 2000-2003……………………........................................................................ Table 17. Average annual target savings ratios for regions in mainland China during 42 2000-2003………………………………………………………………….... Table 18. Actual produced and target abatements ratios of industrial solid wastes for 44 regions in mainland China during 2000-2003………………………………. Table 19. Mann-Whitney test on target solid waste abatements ratios for three major 46 areas………………………………………………………………………..... Table 20. Actual discharged and target abatements ratios of industrial waste water for regions in mainland China during 2000-2003………………………………. 32. 35. 48. Table 21. Mann-Whitney test on target waste water abatements ratios for three major 49 areas…………………………………………………………………………. Table 22. Actual emissions and target abatements ratios of industrial waste gas for 51 regions in mainland China during 2000-2003………………………………. Table 23. Mann-Whitney test on target waste gas abatements ratios for three major 53 areas………………………………………………………………………… x.
(12) Table 24. Average overall technical efficiency for regions in mainland China during 55 2000-2003………………………………………………………………….... Table 25. Average annual target abatements ratios for regions in mainland China 56 during 2000-2003………………………………………….……………….... Table 26. Summary of the target abatements for regions in mainland 60 China……………………………………………………………………….... xi.
(13) List of Figures Figure 1. Research flow chart……………………………………………………….... Figure 2. Production model for evaluating efficient abatements…………................. 22. Figure 3. The average target of coal savings ratios in the three major areas of 31 mainland China…………………………………………………………….. Figure 4. The average target of gasoline savings ratios in the three major areas of 36 mainland China…………………………………………………………….. Figure 5. The average target of electricity savings ratios in the three major areas of 38 mainland China…………………………………………………………….. Figure 6. The average target solid waste abatements ratios in the three major areas 45 of mainland China………………………………………………………..... Figure 7. The average target waste water discharged abatements ratios in the three 50 major areas of mainland China…………………………………………….. Figure 8. The average target waste gas emission abatements ratios in the three 52 major areas of mainland China…………………………………………….. xii. 6.
(14) List of Abbreviations. C. Central area. CO2. C arbon dioxide. CXHY. Hydrocarbon. CRS. Constant Returns to Scale. DEA. Data Envelopment Analysis. DMU. Decision Making Unit. E. East Area. GDP. Gross domestic product. KWH. Kilowatt Hour. NO2. Nitrogen Oxygen. O3. Ozone. OTE. Overall Technical Efficiency. PTE. Pure Technical Efficiency. SE. Scale Efficiency. SO2. Sulfur Dioxide. VRS. Variable Returns to Scale. W. West Area. RMB. Renminbi. xiii.
(15) Chapter 1 Introduction. 1.1 Research motivation Energy changes and transformations make things happen.. We buy energy, sell. energy, eat energy, waste energy, talk a little about conserving energy, and fight over energy.. Energy, a motive force of the economic activity, includes all natural resources. that can be used after changing.. The International Energy Outlook (2002) predicts that. world energy consumption will increase by 60 % from 1999 to 2020. Energy demand in developing Asia is projected to more than double between by 2020. However, overusing energy will cause the energy shortage, energy crisis, the price of energy going up, and environment pollution. which raises manufacturing costs.. The production costs of energy rise,. For the consumer, the price of energy rises, leading. to reduced consumer confidence and spending, higher transportation costs and general price rises. In particular, environment pollution will endanger the organism’s health and life through the food chain indirectly. issue for sustainable development.. Therefore, energy saving has been a crucial. Before new and substitute fuels become available,. energy saving is a must in order to make economic growth possible. The causes of rapid Asian economic growth and its sustainability have generated considerable debates since the early 1990s (e.g., World Bank, 1993; Krugman, 1994; Kim and Lau, 1994, 1995; Young, 1994, 1995; Chen, 1997; Drysdale and Huang, 1997; Krüger et al., 2000; Chang and Luh, 2000).. China, India, and other developing. countries are considered the largest energy consumers that are also the largest emitters of greenhouse gases should be involved in the efforts to solve these global problems (Isakov, 2006). China has abundant energy mine, the per capita usable volume of energy is relatively low.. Kambara (1992) and Dorian (1994) showed that the aggregate demand. 1.
(16) for the energy increased correspondingly, but the aggregate supply of energy was relatively insufficient. The energy used inefficiency result from the uneven mineral distribution, unbalanced region development, and the infrastructure insufficient. In order to satisfy the economic sustainable development, social advancement, population growth, and energy demand increased, the energy supply must suffice the energy demand.. Therefore, how to guarantee the steady energy sources form the energy. topics in safe, diplomacy, and trade (U.S.-China Economic and Security Review Commission, 2004). However, China’s energy consumption accounts for approximately 58% of East Asia’s (excluding Japan) total energy consumption.. All forms of energy will increase,. for energy demand and use will increase, as well as GDP.. In fact, GDP will increase. at 7% annually, a rate higher than the 4.7% per year increase of total energy consumption in China. Of the 39.7 quadrillion Btu of total primary energy consumed in China in 2001, 63.4% was coal, 25.8% was oil, 6.9% hydroelectricity, and 3.1% natural gas (EIA, 2003). By 2020 projections indicate that China will be responsible for approximately 16.1% of world energy consumption.. Therefore, the energy crisis becomes a great. challenge of economic development of China. Energy efficiency improvement is the key to sustainable energy management. Hu and Kao (2007) use the DEA approach to construct environmental-energy efficiency indicators for APEC economies. Hu et al. (Forthcoming) find total-factor water efficiency of regions in China by the DEA.. Hu. and Wang (2006) also indicate that China can improve its energy efficiency in various regions without reducing its potential economic growth. Besides, China is in a transition period from a highly energy-consuming, low-efficiency, and heavily polluting economic development pattern to an energy saving, high-efficiency, and less polluting economic development pattern (WSSD, China Country profile 2002).. Solid wastes in China produced from industry and 2.
(17) consumption amounted to 1,004 million tons and 148 million tons during 2003, respectively.. Waste water discharged from industry and consumption totaled up to. 21,200 million tons and 24,700 million tons, respectively. SO2 emitted from industry and consumption was 17 million tons and 3.67 million tons, respectively (China Statistical Yearbook 2003).. These numbers show that China has to deal with huge. amounts of waste while pursuing its economic growth.. It is now an urgent task for. China to simultaneously deal with these pollution while keeping its high economic growth rates.. 1.2 Research purpose The main interest of this study is to address the issues related to the analysis of targets of energy saving and waste reducing and the potential application and strengths of DEA for regions in mainland China.. Different from the traditional DEA model. which emphasized efficiency, this thesis creates an input abatement index. contribution of this thesis too.. It is main. This study can provide additional suggestions for. energy and environmental policies of mainland China. The first purpose of this study is to calculate relative overall technical efficiency (OTE) for regions in mainland China from period 2000-2003 based on DEA model. Through the DEA model, efficient regions and inefficient regions are shown when considering inputs and outputs. The second purpose is to analyze the target abatement of individual input. These inputs include three types of energy and three types of waste. Generally speaking, coal, oil, and electricity are the three main types of energy; and solid waste, waste water, and waste gas are the three major types of pollution as energy transformed.. The difference. between actual input and target input is the abatement target. Therefore, we can know the efficient abatement target of three types of energy and three types of waste for. 3.
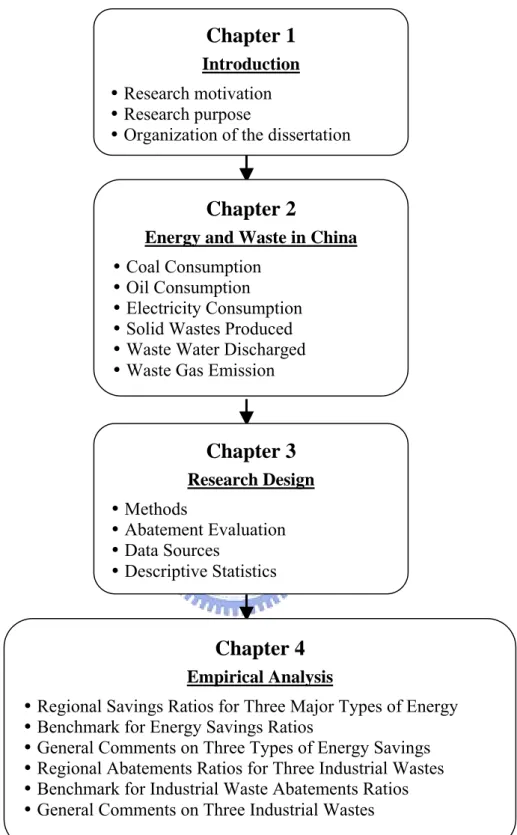
(18) regions in mainland China. The third purpose is to establish abatement ratio by comparing the target input to the actual input.. The abatements ratios present the possible energy savings and. waste abatements without reducing the maximum potential economic outputs. Moreover, this result provides some suggestions about the environmental improvement for regions in mainland China without reducing real economic growth. Energy savings and waste abatements are influenced by industrialization and economic income level.. Therefore, the fourth purpose concerns the relation. between the average abatements ratios and three areas in mainland China. Three areas include east, central, and west.. We can find which area is significant. efficiency on which one input more than other areas. The fifth purpose is to find the benchmark for regions in mainland China according above-mentioned methods.. The regions with most abatements ratios can. learn and transfer the experts and technologies from the benchmark regions to improve their efficiency on energy and waste. This study use panel data approach to analyze the energy savings and waste abatements. The results will provide policy suggestions for regions in mainland China to evaluate and identify their policies and programs according their income level, and to improve their overall technical efficiency by adjusting their energy and waste.. 1.3 Organization of the dissertation This dissertation is organized as follows and shown as Figure 1: Chapter 1 presents the motives and purposes of the study, and introduces the structure of this study.. Chapter 2 discusses the current energy and waste situations and prior. literatures related this study. Chapter 3 proposes a research design that includes. 4.
(19) the explanation how to construct the abatements ratios based on DEA model. Abatements ratios include energy savings ratios and waste abatements ratios. Summary statistics of the empirical data also are shown in this chapter. Chapter 4 presents and discusses the empirical results. Finally, Chapter 5 concludes this dissertation.. 5.
(20) Chapter 1 Introduction Research motivation Research purpose Organization of the dissertation. Chapter 2 Energy and Waste in China Coal Consumption Oil Consumption Electricity Consumption Solid Wastes Produced Waste Water Discharged Waste Gas Emission. Chapter 3 Research Design Methods Abatement Evaluation Data Sources Descriptive Statistics. Chapter 4 Empirical Analysis Regional Savings Ratios for Three Major Types of Energy Benchmark for Energy Savings Ratios General Comments on Three Types of Energy Savings Regional Abatements Ratios for Three Industrial Wastes Benchmark for Industrial Waste Abatements Ratios General Comments on Three Industrial Wastes. Chapter 5 Concluding Remarks. Figure 1 Research flow chart. 6.
(21) Chapter 2 Energy and Waste in Mainland China. 2.1 Three major Types of Energy For people to live on our planet, we need energy. light, and for transportation.. When it’s cold, we need energy for heat. When it’s. dark, we need energy for light. transportation.. We need energy for heat, for. When we want to travel, we need energy for. We need energy to run our factories and cars for example.. Therefore,. this part presents the three main types of energy: coal, oil, and electricity.. 2.1.1 Coal Consumption Coal use steadily increased in China until 1995, then declined for a few years and now continues to rise. Coal consumption in China makes up 70% of energy use and is the biggest consumer and producer of coal in the world.. The development and. production of the coal industry provides stability in China’s economic growth.. Since. 1949, China has suffered mostly from a shortage of coal. China’s coal consumption in 2003 was 1.64 billion tons, but total coal available for consumption was 1.58 billion tons.. A shortage of coal has limited the growth of the steel industry in China.. Therefore, China’s coal import is up to 11.09 million tons in 2003. Table 1 shows the coal consumption by sector, and industry is the biggest department of coal consumption. However, major pollutants generated from coal burning are carbon dioxide and sulfur dioxide.. These pollutants cause acid rain and global warming, and health. deterioration in China’s population. China’s coal use discharges 19 million tones of sulphur dioxide into the atmosphere annually and affects 30 percent of the economy’s territory with acid rain. problems.. China is not the only country suffering from acid rain. Other Asian countries, such as Japan, Taiwan, S. Korea, and the Philippines. have all reported acid rain problems originating from China’s coal burning pollution.. 7.
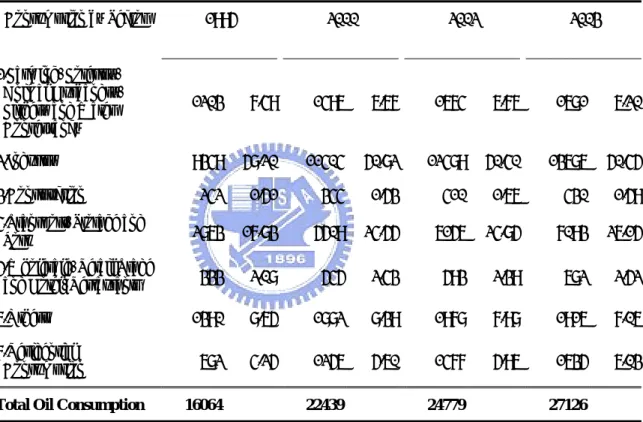
(22) Table 1 Coal consumption by sector Consumption by Sector. unit: 10,000tons. 1995. 2000. 2002. % 1.Farming, Forestry, Animal Husbandry, Fishery and Water Conservancy. %. 2003 %. %. 1856. 1.35. 1647. 1.32. 1622. 1.19. 1683. 1.03. 117570. 85.40. 111730. 89.72. 124195. 90.92. 150568. 91.96. 439. 0.32. 536. 0.43. 553. 0.41. 577. 0.35. 1315. 0.96. 1139. 0.92. 1055. 0.77. 1067. 0.65. 977. 0.71. 814. 0.65. 809. 0.59. 860. 0.53. 1986. 1.44. 761. 0.61. 767. 0.56. 800. 0.49. 7.Residential Consumption. 13530. 9.83. 7907. 6.35. 7602. 5.57. 8174. 4.99. Total Coal Consumption. 137676. 2.Industry 3.Construction 4.Transport, Storage and Post 5.Wholesale, Retail Trade and Hotel, Restaurants 6.Others. 124537. 136605. 163732. Data source: China Statistical Yearbook 2005.. In summary, coal burning in China is having a significant impact on the physical environment, as well as the population in China, and the overall world atmosphere. Due to the rapid increase of health problems, government actions are being taken to reduce the burning of coal and move toward cleaner technologies and renewable energies. Zhijun and Kuby (1997) enhanced the model by adding investment variables for improving efficiency on coal and electricity.. They found that these energy. demands in the year 2000 can be satisfied with less cost and pollution than in the supply-side-only results.. 2.1.2 Oil Consumption China is the world’s second largest oil consumer, behind the U.S, but its oil consumption grows by 7.5% per year, seven times faster than the U.S.’.. 8. Growth in.
(23) Chinese oil consumption has accelerated mainly because of a large-scale transition away from bicycles and mass transit toward private automobiles. Consequently, by year 2010 China is expected to have 90 times more cars than in 1990.. With. automobile numbers growing at 19% a year, projections show that China could surpass the total number of cars in the U.S. by 2030. As Table 2, oil consumption of industry is decreasing, but oil consumption of transport is creasing rapidly.. Table 2 Oil consumption by sector Consumption by Sector. unit: 10,000 tons. 1995. 2000 %. 2002 %. 2003 %. %. 1.Farming, Forestry, Animal Husbandry, Fishery and Water Conservancy. 1203. 7.49. 1496. 6.67. 1674. 6.76. 1681. 6.20. 2.Industry. 9349. 58.20. 11404. 50.82. 12489. 50.40. 13686. 50.45. 242. 1.51. 344. 1.53. 410. 1.66. 430. 1.59. 4.Transport, Storage and Post. 2863. 17.83. 5509. 24.55. 6156. 24.85. 7093. 26.15. 5.Wholesale, Retail Trade and Hotel, Restaurants. 333. 2.08. 545. 2.43. 593. 2.39. 682. 2.52. 1390. 8.65. 1882. 8.39. 1978. 7.98. 1916. 7.06. 682. 4.25. 1256. 5.60. 1477. 5.96. 1635. 6.03. 3.Construction. 6.Others 7.Residential Consumption Total Oil Consumption. 16064. 22439. 24779. 27126. Data source: China Statistical Yearbook 2005.. Another contributor to the sharp increase in automobile sales is the very low price of gasoline in China.. Chinese gasoline prices now rank among the lowest in the world. for oil-importing countries, and are a third of retail prices in Europe and Japan, where steep taxes are imposed to discourage gasoline use (Luft, 2006). At current production rates they are likely to last for less than two decades.. In. order to deal with more and more oil demands, China imported up to 95.80 million tons of crude oil in the first eight months in 2006, up 15.3 percent over the same period of 9.
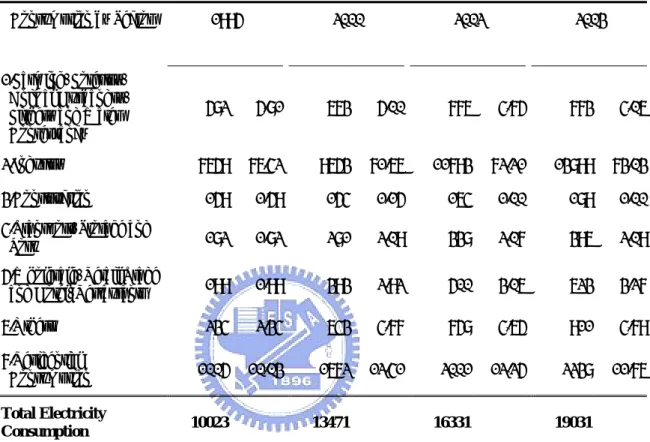
(24) last year (NDRC, 2006). Moreover, this problem has put a strain on the world’s current oil contracts, and the issue has become so serious that Chinese president took a trip to Gabon to secure a deal with Total Gabon for oil. China’s new energy plan reflects Beijing’s concern about the rising cost of energy and the country’s growing dependence on imported oil (Oster, 2006). China’s expectation of growing future dependence on oil imports has brought it to acquire interests in exploration and production in places like Kazakhstan, Russia, Venezuela, Sudan, West Africa, Iran, Saudi Arabia and Canada.. But despite its efforts. to diversify its sources, China has become increasingly dependent on Middle East oil. 58% of China’s oil imports come from the region. By 2015, the share of Middle East oil will stand on 70%.. 2.1.3 Electricity Consumption Total electricity consumption in China has also increased due to an increasing economy and population.. China’s electrical power demands have increased, and the. areas affected by blackouts will be larger than in 2003.. China’s electricity. consumption in 2003 was 1903.16 billion kilowatt hours (KWH), and total oil available for consumption was 1903.22 billion KWH.. Table 3 shows the electricity. consumption by sector, and industry is still the biggest department of coal consumption. Increasing power demand as the country continues its modernization drive has put immense pressure on power grids in some areas, especially in the relatively developed coastal regions like Shanghai and Guangdong (NDRC, 2003). Meanwhile, increased industrial output, lower prices and demand for high power-consuming appliances such as air-conditioners are causing power shortages in 16 provinces. Moreover, the situation has become so serious that east China will have electrical power shortages the year round, instead of just in the summer.. 10. To cope with.
(25) the problem of power supply, China launched a west-to-east power transmission project in 2000, making it one of China’s major strategies in energy development and an important step for developing the west regions. Table 3 Electricity consumption by sector Consumption by Sector. unit: 100 million KWH. 1995. 2000 %. 1.Farming, Forestry, Animal Husbandry, Fishery and Water Conservancy. 2002 %. 2003 %. %. 582. 5.81. 673. 5.00. 776. 4.75. 773. 4.06. 7659. 76.42. 9653. 71.66. 11793. 72.21. 13899. 73.03. 3.Construction. 159. 1.59. 154. 1.15. 164. 1.00. 189. 1.00. 4.Transport, Storage and Post. 182. 1.82. 281. 2.09. 338. 2.07. 396. 2.09. 5.Wholesale, Retail Trade and Hotel, Restaurants. 199. 1.99. 393. 2.92. 500. 3.06. 623. 3.27. 6.Others. 234. 2.34. 643. 4.77. 758. 4.65. 911. 4.79. 1005. 10.03. 1672. 12.41. 2001. 12.25. 2238. 11.76. 2.Industry. 7.Residential Consumption Total Electricity Consumption. 10023. 13471. 16331. 19031. Data source: China Statistical Yearbook 2005.. Steenhof (2006) presents analysis of the effect of changes in the industrial sector on electricity demand, an important economic sector contributing to these above patterns as it consumes nearly 70% of the electricity generated in China.. He found. that both increased industrial activity and fuel shifts helped increase industrial sector electricity demand between 1998 and 2002 by using decomposition analysis. Edvardsen and Førsund (2003) and Jamasb and Pollitt (2003) analyzed the benchmarking of the electricity industry in Europe and Northern Europe at the plant level.. 11.
(26) 2.2 Three Major Types of Waste China has seen the fruit of its rapid economic growth over the past two decades, but severe environmental problems have accompanied this. Issues of environment pollution and resources consumption had endangered China’s fast economic growth and become the most critical situation in the world. About 70-80% of rivers and 90% of supply water in major cities are seriously polluted.. According to 2001 data, 16 out of. 20 the most polluted cities in the world are located in China; acid rain covers 1/3 of land in China; and 5 billion tons of soil tons is eroded every year. Natural resources have been the edge of extinction, and 14 kinds of important mineral are estimated to exhaust in next 20 years.. However, solid wastes, waste water, and waste gas are the most. common pollutants, called three wastes, caused earth pollution, water pollution, air pollution, mutual pollution, even global pollution. Therefore, this part presents the China’s three major types of waste: solid wastes, waste water, and waste gas.. 2.2.1 Solid Wastes Produced With the development of chemical industry in China, the poisonous and harmful solid wastes also increase.. There are 1200 million tons solid wastes in China during. 2004, and 9.95 million tons among them are hazardous wastes.. ‘Solid wastes’ means. the waste in solid or semi-solid state generated in the production and construction, daily life and other activities, which might pollute the environment. Solid wastes have not passed strict security treatment, and have already become serious pollutants. Solid wastes not only influence the view of the city, but also pollute water, gas, and soil greatly.. These pollutions cause the harmful substance, and accumulate in the crops.. Which enter the human body through the food chain, then cause various kinds of diseases, and harm human’s health finally. In 2006, Russian scientists test water quality for Songhua River in northeast of China, they find poisonous offal, such as chlorine phenol, wasted papers, and cellulose. 12.
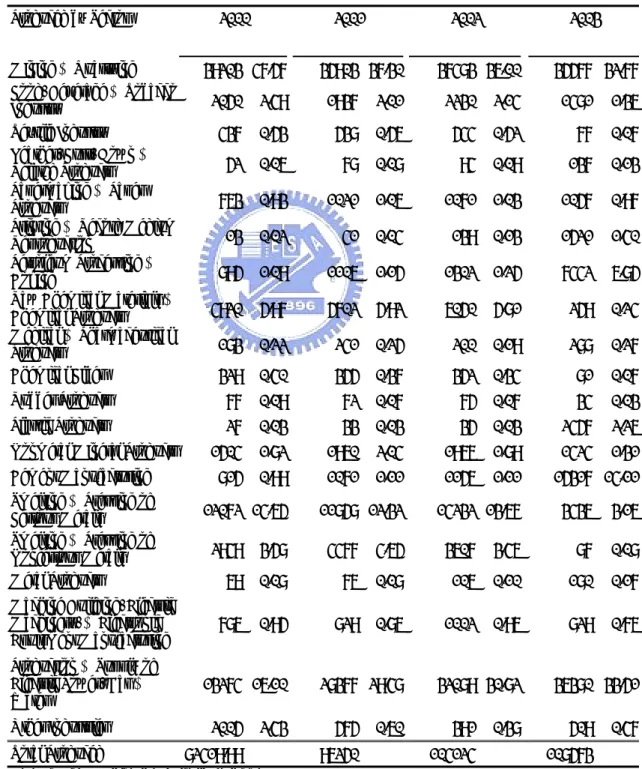
(27) The consistency of poisonous offal has already exceeded 50 times acceptable level (Songhua River News 2006). sector during 2000-2003.. Table 4 shows the industrial solid wastes produced by. The sector of mining & quarrying produces the biggest solid. wastes, and the sector of production & supply of electric power, gas & water is the second.. Table 4 Industrial Solid wastes produced by sector Produced by Sector Mining & Quarrying Food, Beverage & Tobacco Industry. 2000. unit: 10,000 tons. 2001. 2002. 2003. %. %. %. %. 39203 47.57. 35903 37.30. 37483 36.00. 35577 32.77. 2050. 2.49. 1937. 2.01. 2230. 2.14. 1481. 1.36. 437. 0.53. 538. 0.56. 544. 0.52. 77. 0.07. 52. 0.06. 78. 0.08. 94. 0.09. 137. 0.13. 763. 0.93. 1021. 1.06. 1071. 1.03. 1057. 0.97. 13. 0.02. 41. 0.04. 139. 0.13. 1521. 1.40. 895. 1.09. 1106. 1.15. 1302. 1.25. 7442. 6.85. 4920. 5.97. 5702. 5.92. 6050. 5.81. 259. 0.24. 183. 0.22. 241. 0.25. 200. 0.19. 288. 0.27. 329. 0.40. 355. 0.37. 352. 0.34. 81. 0.07. Rubber Products. 77. 0.09. 72. 0.07. 75. 0.07. 34. 0.03. Plastic Products. 27. 0.03. 33. 0.03. 35. 0.03. 2457. 2.26. 1504. 1.82. 1960. 2.04. 1966. 1.89. 1424. 1.31. 815. 0.99. 1071. 1.11. 1156. 1.11. Textile Industry Leather, Furs, Down & Related Products Papermaking & Paper Products Printing & Record Medium Reproduction Petroleum Processing & Coking Raw Chemical Materials & Chemical Products Medical & Pharmaceutical Products Chemical Fiber. Nonmetal Mineral Products Cement Manufacturing Smelting & Pressing of Ferrous Metals Smelting & Pressing of Nonferrous Metals Metal Products Machine Building, Electric Machinery, & Electronic Equipment Manufacturing Production & Supply of Electric Power, Gas & Water Other Industries Total Produced. 12072 14.65. 11858 12.32. 14232 13.67. 15317 14.11 3436. 3.16. 2949. 3.58. 4477. 4.65. 3607. 3.46. 87. 0.08. 69. 0.08. 76. 0.08. 106. 0.10. 180. 0.17. 786. 0.95. 829. 0.86. 1002. 0.96. 829. 0.76. 13274 16.10 2005 82419.99. 28377 29.48. 2.43. 575 96250. Data source: China Statistical Yearbook 2001-2004.. 13. 0.60. 32089 30.82 391 104124. 0.38. 36380 33.51 509 108573. 0.47.
(28) Industrial solid waste is divided into two parts:. recycle and un-recycle.. Recycle means that the industry converts the solid waste into resources, energy, and other raw materials by retrieving, processing, and exchanging. At present, China is the largest importer of solid waste in the world.. Many solid wastes are sold from the U.S.. to China every year and become the raw materials of paper mills, steel mills, and other factories. Some solid wastes are made into products by workers with very low salaries, for example, parts for cars and toys, which are then sold back to the U.S.. The ratios of. industrial solid wastes utilized are 45.6%, 45.9%, 52.1%, 51.9%, and 54.8% during the 1999-2003 period (China Statistical Yearbook 2003).. However, a large number of. renewable resources are not recycled and lead to economic losses of up to US$30 billion per year (SoE 2000). There are many examples of industrial solid waste management from several countries that have recently become interested in industrial solid wastes.. For case. studies of industrial solid wastes and recycling, Casares et al. (2005) investigated Asegra in Spain and Donnelly (2002) researched the United States and Germany. Moreover, Hogland and Stenis (2000) described a method of organization for an industrial solid waste management system in Sweden, which is characterized by an energy recovery and material recovery system. Other countries such as Finland, Australia, Austria, Canada (Raymond and Cohen-Rosenthal 1998), and the United States (Deppe et al. 2000) refer to the concept of an ‘eco-industrial park’, which integrates business, environmental excellence, and community relations to create economic opportunities and improved ecosystems.. 2.2.2 Waste Water Discharged In 2005 a chemical firm of Jilin in China exploded, resulting in 100 tons of benzene flowing into Songhua River causing the water supply system of Harbin to be. 14.
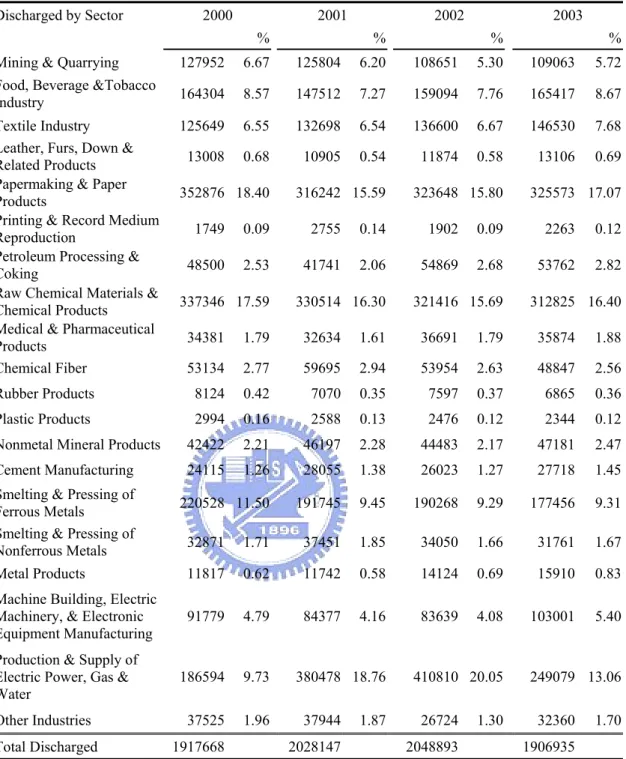
(29) shut down (Chen 2006).. Currently, there are 400 medium and small-sized cities in. China, discharging 10 billion tons of waste water every year (ACCA21).. Table 5. shows the industrial waste water discharged by sector during 2000-2003. The sectors of papermaking & paper products and raw chemical materials & chemical products discharges the biggest waste water, and the sector of production & supply of electric power, gas & water is still the second. Most of the chemical pollutants that industrial plants discharge are heavy metals, particularly cadmium, zinc, organic-metallic compounds, phosphates, nitrates, and potassium, which have caused many deaths of fishes, plants, and animals.. Waste. water pollution has affected the ocean’s ecosystem, rivers, estuaries, lakes, and groundwater, such as increased temperature and decreased oxygen within the water, and cause the respiration and metabolism of aquatic plants and animals (Benarde 1989). Moreover, many waterborne diseases have affected China for the past several years through groundwater contamination.. Most of these municipal pollutants. contribute to the increase in disease transmissions of waterborne diseases. Moreover, waterborne diseases are commonly contracted when bathing in fecal- and urine-polluted streams and canals or can be transmitted by the bite of an insect vector that breeds in polluted waters.. Several examples of waterborne diseases are cholera, typhoid, and. dysentery, which occur at a higher rate in developing countries such as China. Pesticides in drinking water have also been a problem to the health of a community (Vighi and Funari 1995).. Not only do pesticides affect humans, but also. the environment in terms of groundwater contamination which can affect the natural hydrologic cycle.. From an environmental analysis, the disruption of the environment. and the ecosystem is altering the natural capital of China.. 15.
(30) Table 5 Industrial waste water discharged by sector Discharged by Sector. 2000. unit: 10,000 tons. 2001 %. 2002 %. 2003 %. %. Mining & Quarrying. 127952. 6.67. 125804. 6.20. 108651. 5.30. 109063. 5.72. Food, Beverage &Tobacco Industry. 164304. 8.57. 147512. 7.27. 159094. 7.76. 165417. 8.67. 125649. 6.55. 132698. 6.54. 136600. 6.67. 146530. 7.68. 13008. 0.68. 10905. 0.54. 11874. 0.58. 13106. 0.69. Textile Industry Leather, Furs, Down & Related Products Papermaking & Paper Products Printing & Record Medium Reproduction Petroleum Processing & Coking Raw Chemical Materials & Chemical Products Medical & Pharmaceutical Products Chemical Fiber. 352876 18.40. 316242 15.59. 323648 15.80. 325573 17.07. 1749. 0.09. 2755. 0.14. 1902. 0.09. 2263. 0.12. 48500. 2.53. 41741. 2.06. 54869. 2.68. 53762. 2.82. 337346 17.59. 330514 16.30. 321416 15.69. 312825 16.40. 34381. 1.79. 32634. 1.61. 36691. 1.79. 35874. 1.88. 53134. 2.77. 59695. 2.94. 53954. 2.63. 48847. 2.56. Rubber Products. 8124. 0.42. 7070. 0.35. 7597. 0.37. 6865. 0.36. Plastic Products. 2994. 0.16. 2588. 0.13. 2476. 0.12. 2344. 0.12. Nonmetal Mineral Products. 42422. 2.21. 46197. 2.28. 44483. 2.17. 47181. 2.47. Cement Manufacturing. 24115. 1.26. 28055. 1.38. 26023. 1.27. 27718. 1.45. 220528 11.50. 191745. 9.45. 190268. 9.29. 177456. 9.31. Smelting & Pressing of Ferrous Metals Smelting & Pressing of Nonferrous Metals. 32871. 1.71. 37451. 1.85. 34050. 1.66. 31761. 1.67. Metal Products. 11817. 0.62. 11742. 0.58. 14124. 0.69. 15910. 0.83. Machine Building, Electric Machinery, & Electronic Equipment Manufacturing. 91779. 4.79. 84377. 4.16. 83639. 4.08. 103001. 5.40. 186594. 9.73. 37525. 1.96. Production & Supply of Electric Power, Gas & Water Other Industries Total Discharged. 1917668. 380478 18.76 37944 2028147. 1.87. 410810 20.05 26724 2048893. 1.30. 249079 13.06 32360. 1.70. 1906935. Data source: China Statistical Yearbook 2001-2004.. Considering the social, environmental, economical, and technical aspects concerning the waste water treatment projects, several projects have been proposed within China to deal with the waste water pollution problem.. The projects include the. analysis and recommendations for financial, social, environmental, and technical issues to help improve China’s waste water management practices.. 16. With the waste water.
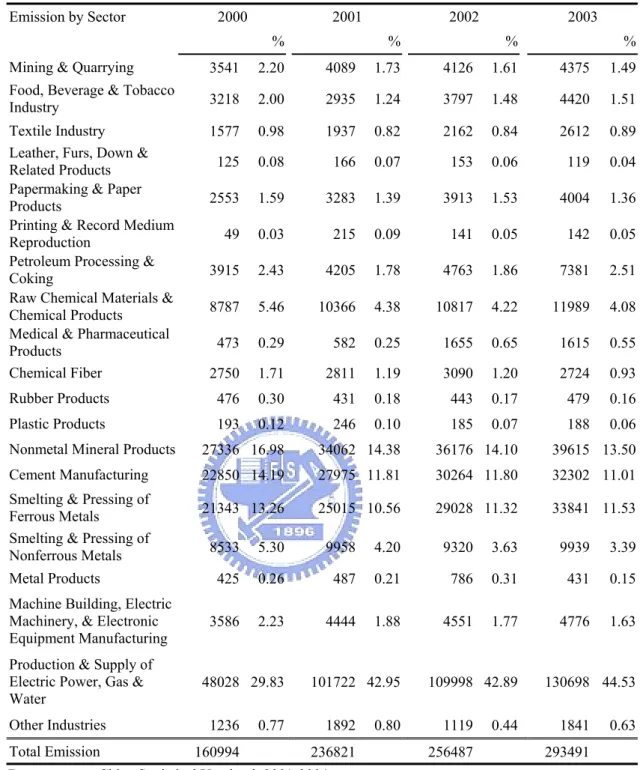
(31) treatment plants proposed in China, its environment, population, agriculture, and economy can all improve dramatically.. 2.2.3 Waste Gas Emission Air pollution alone contributes to the premature deaths of more than a quarter of a million people each year (World Bank 1997).. One of the main sources of air. pollution is industrial waste gas emission. The main source of industrial waste gas emission includes heavy carbon monoxide (CO2), sulfur dioxide (SO2), hydrocarbon (CXHY), ozone (O3), nitrogen oxygen (NO2), etc., in the air. China is currently third largest acid rain belt in the world. During the last ten years, because SO2 missions have increased day by day, China is now only behind Europe and North America.. The dangers from acid rain upon the environment include:. degradation of forests, lakes become acidic, fish die, farmland and soil turn acidic, poisonous heavy metal pollution increases, and vegetables and fruits drop in production on a large scale. Table 6 shows the industrial waste gas emission by sector during 2000-2003. The sector of production & supply of electric power, gas & water emissions the biggest waste gas, and the sectors of nonmetal mineral products, cement manufacturing, and smelting & pressing of ferrous metals juxtapose the second. Dangers from waste gas emission to mankind are: and allergies of the eyes, nose, and throat.. asthma, coughing, headaches,. Most of the existing analyses of air. pollution abatement focus on its benefit evaluation (Kumar and Rao, 2001), its possible impacts on economic activities (Xie, 2000; Resosudarmo, 2003), or strategies to achieve it (Vlek et al. 2004).. Economically efficient air pollution abatement receives relatively. much less attention (Hu, 2006).. 17.
(32) Table 6 Industrial waste gas emission by sector Emission by Sector. 2000. unit: 100 million m3. 2001 %. 2002 %. 2003 %. %. Mining & Quarrying. 3541. 2.20. 4089. 1.73. 4126. 1.61. 4375. 1.49. Food, Beverage & Tobacco Industry. 3218. 2.00. 2935. 1.24. 3797. 1.48. 4420. 1.51. 1577. 0.98. 1937. 0.82. 2162. 0.84. 2612. 0.89. 125. 0.08. 166. 0.07. 153. 0.06. 119. 0.04. 2553. 1.59. 3283. 1.39. 3913. 1.53. 4004. 1.36. 49. 0.03. 215. 0.09. 141. 0.05. 142. 0.05. 3915. 2.43. 4205. 1.78. 4763. 1.86. 7381. 2.51. 8787. 5.46. 10366. 4.38. 10817. 4.22. 11989. 4.08. 473. 0.29. 582. 0.25. 1655. 0.65. 1615. 0.55. 2750. 1.71. 2811. 1.19. 3090. 1.20. 2724. 0.93. Rubber Products. 476. 0.30. 431. 0.18. 443. 0.17. 479. 0.16. Plastic Products. 193. 0.12. 246. 0.10. 185. 0.07. 188. 0.06. Textile Industry Leather, Furs, Down & Related Products Papermaking & Paper Products Printing & Record Medium Reproduction Petroleum Processing & Coking Raw Chemical Materials & Chemical Products Medical & Pharmaceutical Products Chemical Fiber. Nonmetal Mineral Products. 27336 16.98. 34062 14.38. 36176 14.10. 39615 13.50. Cement Manufacturing. 22850 14.19. 27975 11.81. 30264 11.80. 32302 11.01. 21343 13.26. 25015 10.56. 29028 11.32. 33841 11.53. Smelting & Pressing of Ferrous Metals Smelting & Pressing of Nonferrous Metals Metal Products Machine Building, Electric Machinery, & Electronic Equipment Manufacturing Production & Supply of Electric Power, Gas & Water Other Industries Total Emission. 8533. 5.30. 9958. 4.20. 9320. 3.63. 9939. 3.39. 425. 0.26. 487. 0.21. 786. 0.31. 431. 0.15. 3586. 2.23. 4444. 1.88. 4551. 1.77. 4776. 1.63. 48028 29.83 1236 160994. 0.77. 101722 42.95 1892 236821. 0.80. 109998 42.89 1119 256487. 0.44. 130698 44.53 1841. 0.63. 293491. Data source: China Statistical Yearbook 2001-2004.. An economy’s macroeconomic policies generally have two objectives:. the. creation of wealth and good living conditions for citizens. Gross domestic product (GDP) is commonly used in assessing an economy’s wealth, but it does not constitute a measure of wealth without dealing with environmental issues adequately. Although. 18.
(33) the energy savings and waste abatements are mutually beneficial to China and the rest of the world, people may worry that a drastic reduction in the three wastes will hamper economic growth.. Therefore, given the limited availability of economically viable. alternative energy sources, reducing total domestic energy use and waste produces without sacrificing economic growth is an important issue for economies all over the world (de Nooij et al., 2003).. Moreover, this concept is also called ‘green GDP.’. Green GDP is derived from GDP through a deduction of negative environmental and social impacts. The future will involve conflicts between environmental protection and economic growth. Therefore, energy saving and waste reducing are hence important for all economies.. This thesis tries to find out the efficient regional target energy savings. ratios and target waste abatements ratios with respect to China’s own production frontier.. Efficient abatements not only are feasible under China’s current best. technology, but they also will not reduce the maximum potential economic output.. 19.
(34) Chapter 3 Research Design 3.1. Methodology of Data Envelopment Analysis (DEA) DEA is known as a mathematical programming method for assessing the comparative efficiencies of a decision-making unit (DMU). In our study a region is counted as a DMU.. DEA is a non-parametric method using linear programming to. construct a non-parametric piecewise frontier over the data for an efficiency measurement.. DEA does not need to specify either the production functional form or. weights on different inputs and outputs.. Comprehensive reviews of the development. of an efficiency measurement can be found in Lovell (1993).. There are K inputs and. M outputs for each of these N DMUs. The envelopment of the i-th DMU can be derived from the following linear programming problem: θ. Min θ, λ s.t.. -yi + Yλ ≥ 0, θ xi - Xλ ≥ 0, λ ≥ 0,. (1). where θ is a scalar representing the efficiency score for the i-th DMU; λ is an N×1 vector of constants; yi is an M×1 output vector of DMU i; Y is an M×N output matrix constituted by all output vectors of these N DMUs; xi is a K×1 input vector of DMU i; and X is a K×N input matrix constituted by all input vectors of these N DMUs.. The. efficiency score will satisfy 0 ≤ θ ≤ 1, with a value of 1 indicating a point on the frontier and hence a technically efficient DMU (Coelli et al. 1998).. The above procedure. constructs a piecewise linear approximation to the frontier by minimizing the quantities of the K inputs required to meet the output levels of the i-th DMU. The weight λ serves to form a convex combination of observed inputs and outputs. input-orientated measurement of efficiency. 20. It is an.
(35) Equation (1) is known as the constant returns to scale (CRS) DEA model (Charnes et al. 1978). This model finds the overall technical efficiency (OTE) of each DMU.. The variable returns to scale (VRS) DEA model (Banker et al. 1984) further. decomposes the overall technical efficiency into pure technical efficiency (PTE) and scale efficiency (SE):. OTE = PTE × SE.. In order to pursue overall technical. efficiency with energy and waste, this study adopts the CRS DEA model.. Furthermore,. both output-oriented and input-oriented CRS DEA models generate exactly the same efficiency scores, target inputs, and target outputs. However, the results of a VRS DEA model can be drastically changed by shifting from an output orientation to an input orientation.. 3.2 Abatement Evaluation Labor and capital are two major inputs in production. nation’s overall output, GDP is commonly used.. When measuring a. For example, Färe et al. (1994). analyzed the productivity growth of OECD countries, by considering labor and capital as inputs and GDP as an output. Chang and Luh (2000) adopted similar inputs and outputs to analyze the productivity growth of ten Asian economies. The change in income, energy, and waste is a three-way relation:. First,. increasing income deteriorates the environmental condition directly, because waste is generally a by-product of the energy consumption and is costly to dispose. Conversely, the growth of income is accompanied by the public increasing its demand for better environmental quality through driving forces such as control measures, technological progress, and the structural change of consumption.. GDP, waste, and energy should be. both taken into account in order to correct a nation’s output.. Therefore, in the. following analytical process, energy and waste are considered respectively as inputs in order to find the target input levels by the DEA approach.. 21.
(36) However, the crude oil can be divided into liquefied petroleum gas, gasoline, light oil, diesel oil, heavy oil, and pitch, etc. after distilling.. Besides petrol, the others can. be used for generating electricity. In order to avoid repeated calculation on energy consumption, this thesis selects gasoline as an input variable. Therefore, this thesis takes the economic production function that is constructed by data envelopment analysis to analyze regional efficiencies in China. First, three major types of energy (coal, gasoline, and electricity) are considered in conjunction with the inputs of labor and capital stock (that are normally used in economic efficiency and productivity analysis) as the total inputs in order to produce economic output (GDP).. Second, this. thesis treats three kinds of waste (solid wastes, waste water, and waste gas) as proxies for the cost of environmental goods used for production. Oates and Schwab (1988), López (1994), Smulders (1999), de Bruyn (2000), and Hu et al. (2005) treated the pollution as a proxy for the cost of environmental goods.. Three kinds of waste. therefore are considered in conjunction with the inputs of labor and capital stock as the total inputs in order to produce economic output (GDP).. Figure 2 shows the. production model for evaluating efficient abatements. Outputs. Input Factors Real Capital Labor Coal Consumption Gasoline Consumption Electricity Consumption. Production Process. Outputs. Input Factors Real Capital Labor Solid Wastes Produced Waste Water Discharged Waste Gas Emission. Real GDP. Production Process. Real GDP. Figure 2 Production model for evaluating efficient abatements. 22.
(37) The target inputs and outputs for a DMU to be efficient can be computed by the DEA approach.. The efficiency frontier can shift from year to year. DEA calculates. the year-specific frontier with regional output and input (cross-sectional) data in each year.. The target inputs of a DMU for a year are found by comparing its actual inputs. to the efficiency frontier in that year.. By this method, each region’s target amounts of. coal consumption, gasoline consumption, electricity consumption, solid wastes produced, waste water discharged, and waste gas emission in each year can be found by comparing their actual consumption to the total-factor efficiency frontier of that year that is, the efficiency frontier in each year represents the feasible and best performance of China in that year. Therefore, an imposition of an arbitrary abatement target with a developed economy’s standard is avoided herein. Hu (2006) constructed a total-factor air pollution abatement ratio index to compute how far away a region’s air pollution emission is from the efficient level. The higher the abatement ratio is, the lower the total-factor efficiency will be.. The. target input (energy or waste) abatements ratios of the regions are then computed from dividing the target input amount by the actual input amount:. Target Input Abatement Ratio k (i, t) = 1 - Target Input k (i, t) / Actual Input k (i, t),. where it is in the i-th region and the t-th year for k-th input.. (2). Different from the. traditional DEA model which emphasized efficiency, this thesis creates an input abatement index.. It is main contribution of this thesis too. As equation (2) shows,. the abatement ratio represents how far away a region’s three major types of energy or waste are from the efficient levels. Therefore, the efficient target energy savings ratios for each region in each year are then obtained by dividing the target energy consumption by the actual energy consumption; and the efficient target waste abatements ratios for each region in each year are then obtained by dividing the target. 23.
(38) waste and by the actual waste. The actual value is always larger than or equal to the target value such that the abatements ratios will always be between zero and unity. The DEA approach was originally intended for use in microeconomic environments to measure the performance of schools, hospitals, and the like, and it is also ideally suited to macroeconomic performance analysis.. However, to the best our. knowledge, the existing literature of efficient energy target savings ratios and efficient waste target abatements ratios do not simultaneously incorporate the various energy and waste.. For example, Hu (2006) uses three air emissions as inputs to compute the. efficient air pollution abatement ratios in China.. Hu and Lee (Forthcoming) find the. target waste abatement of the three wastes for twenty-seven regions in China through the DEA. Färe et al. (2004) used DEA to construct an environmental performance index focusing on pollution.. 3.3 Data Sources The data of regional labor employment are established from the China Statistical Yearbook.. Data of GDP output in each region are collected respectively as stated. previously. Real capital stocks in 1996 prices are constructed based on Li’s method (Li 2003).1. Monetary inputs and outputs such as GDP and capital stock are deflated to. 1996 values. From the perspective of China’s development and political factors, its provinces, autonomous regions, and municipalities are usually divided into three major areas:. the. east area (abbreviated as ‘E’), the central area (abbreviated as ‘C’), and the west area (abbreviated as ‘W’). 1. There is an apparently economic disparity between the coastal. The capital stock data are not available in the China Statistical Yearbook. In this study, every. regional capital stock in a specific year is calculated by the authors according to this formula:. capital. stock in the previous year + capital formation in the current year − capital depreciation in the current year. All the nominal values are deflated in 1995 prices before summations and deductions. the initial capital stock (capital stock data in 1995) from the research of Li (2003). 24. This thesis finds.
(39) and inland areas.. Regional economic disparities are due to greater access to world. markets, better infrastructure, a higher-educated labor force, and the government's preferential policies on foreign investment for the east area (World Bank 1997). From China Energy Statistical Yearbook, we establish the three types of energy dataset for 27 regions in mainland China (24 provinces and 3 municipalities) during 2000 to 2003.. There are Beijing (E), Tianjin (E), Hebei (E), Shanxi (C), Inner. Mongolia (C), Liaoning (E), Jilin (C), Heilongjiang (C), Shanghai (E), Jiangsu (E), Zhejiang (E), Anhui (C), Fujian (E), Jiangxi (C), Shandong (E), Hennan (C), Hubei (C), Hunan (C), Guangdong (E), Guangxi (E), Sichuan (W), Guizhou (W), Yunnan (W), Shaanxi (W), Gansu (W), Qinghai (W), and Xinjiang (W).. From China Statistical. Yearbook, we establish the three types of waste dataset for 27 regions in mainland China (24 provinces and 3 municipalities) during 2000 to 2003.. Note that Chongqing. became a municipality out of Sichuan in 1997 and in this study its outputs and inputs are included in Sichuan. There are five inputs and one output in the DEA model to calculate the target energy savings.. In order to avoid repeated calculation, this paper only regarded final. consumptions as energy inputs.. The five inputs are capital stock, number of employed. persons, coal consumption, gasoline consumption, and electricity consumption.. There. are also five inputs and one output in the DEA model to calculate the target waste abatements.. The five inputs are capital stock, number of employed persons, industrial. solid wastes produced, industrial waste water discharged, and industrial waste gas emission.. The only one output is GDP of a specific region.. aggregated input and output proxies.. These include. Three inputs of energy and three inputs of waste. are treated as the cost of production, and they are China’s three types of most important energy and waste. The values of monetary inputs and outputs such as GDP and capital are in 1996 prices. This thesis uses the software Deap 2.1, kindly provided by Coelli (1996), for computing the target inputs and outputs of each region in each year. 25.
(40) 3.4 Descriptive Statistics Summary statistics of these inputs and output ordered by year and area are shown in Tables 7 and 8, respectively. Table 7 Summary statistics of inputs and outputs by year 2000. 2001. 2002. 2003. Output Gross Domestic Product. Mean. 2623. 2687. 2728. 2848. (100 million RMB). Std. Dev.. 1833. 1889. 1935. 2055. 11647. 12366. 13105. 13943. Common Inputs Capital Stock. Mean. (100 million RMB). Std. Dev.. 8607. 8979. 9376. 9853. Number of Employed Persons. Mean. 2305. 2291. 2334. 2374. (10,000 persons). Std. Dev.. 1535. 1536. 1522. 1540. Volume of Coal Consumption. Mean. 5396. 5624. 6166. 7077. (10,000 tons). Std. Dev.. 3311. 3487. 4077. 4588. Volume of Gasoline Consumption. Mean. 125. 136. 144. 158. (10,000 tons). Std. Dev.. 64. 76. 81. 93. Volume of Electricity Consumption. Mean. 501. 565. 611. 699. (100 million KWH). Std. Dev.. 296. 366. 377. 448. Energy Inputs. Waste Inputs Volume of Industrial Solid Wastes Produced. Mean. 3001. 3271. 3479. 3687. (10,000 tons). Std. Dev.. 2090. 2253. 2326. 2439. Volume of Industrial Waste Water Discharged Mean (10,000 tons) Std. Dev.. 71237. 74350. 76004. 77926. 53685. 61966. 62891. 62839. 5046. 5890. 6411. 7283. Volume of Industrial Waste Gas Emission. Mean. (100 million m3). 2892 3597 3830 4395 Std. Dev. Notes: (1) The monetary values are in 1996 prices. (2) Data source: China Energy Statistical Yearbook 2004-2005, and China Statistical Yearbook 2001-2004. 26.
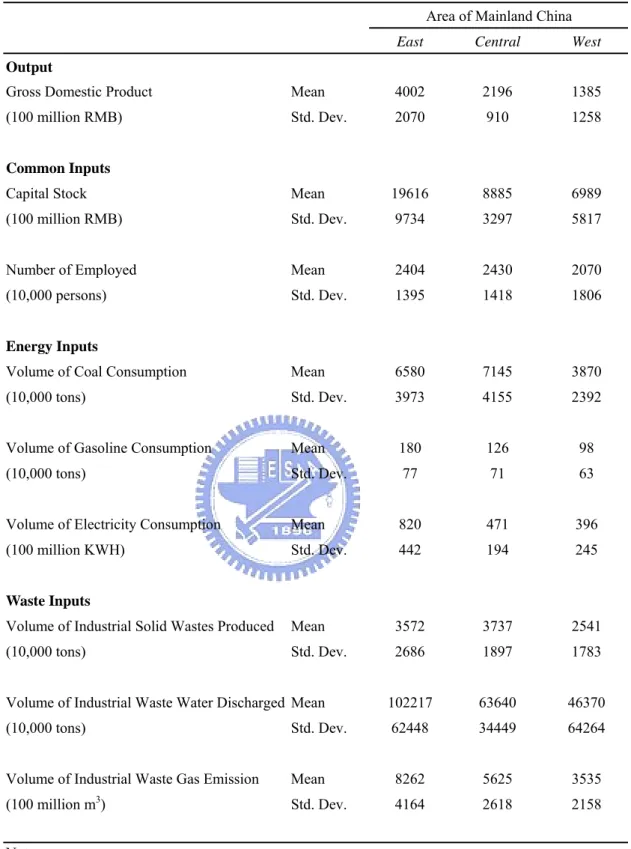
(41) Table 8 Summary statistics of inputs and outputs by area Area of Mainland China East. Central. West. Output Gross Domestic Product. Mean. 4002. 2196. 1385. (100 million RMB). Std. Dev.. 2070. 910. 1258. Capital Stock. Mean. 19616. 8885. 6989. (100 million RMB). Std. Dev.. 9734. 3297. 5817. Number of Employed. Mean. 2404. 2430. 2070. (10,000 persons). Std. Dev.. 1395. 1418. 1806. Volume of Coal Consumption. Mean. 6580. 7145. 3870. (10,000 tons). Std. Dev.. 3973. 4155. 2392. Volume of Gasoline Consumption. Mean. 180. 126. 98. (10,000 tons). Std. Dev.. 77. 71. 63. Volume of Electricity Consumption. Mean. 820. 471. 396. (100 million KWH). Std. Dev.. 442. 194. 245. Volume of Industrial Solid Wastes Produced. Mean. 3572. 3737. 2541. (10,000 tons). Std. Dev.. 2686. 1897. 1783. Volume of Industrial Waste Water Discharged Mean. 102217. 63640. 46370. (10,000 tons). Std. Dev.. 62448. 34449. 64264. Volume of Industrial Waste Gas Emission. Mean. 8262. 5625. 3535. (100 million m3). Std. Dev.. 4164. 2618. 2158. Common Inputs. Energy Inputs. Waste Inputs. Notes: (1) The monetary values are in 1996 prices. (2) Data source: China Energy Statistical Yearbook 2004-2005, and China Statistical Yearbook 2001-2004.. 27.
(42) The east area has the highest GDP, capital stock, gasoline consumption, electricity consumption, and. the most waste water discharged and waste gas emission. The. central area has the largest number of employed people, the highest coal consumption, and the most solid wastes. As shown in Table 9, all inputs have positive correlation coefficients with the output - that is, all inputs satisfy the isotonicity property with the output. Table 9 Correlation coefficients between inputs and the output Part I: Single output, Common inputs, and energy inputs. Real GDP. Real Capital Stock. Labor. Coal. Gasoline. Electricity. 0.81. 0.68. 0.47. 0.81. 0.93. Labor. Solid Wastes. Waste Water. Waste Gas. 0.68. 0.82. 0.79. 0.29. Part II: Single output, Common inputs, and waste inputs Real Capital Stock Real GDP. 0.81. 28.
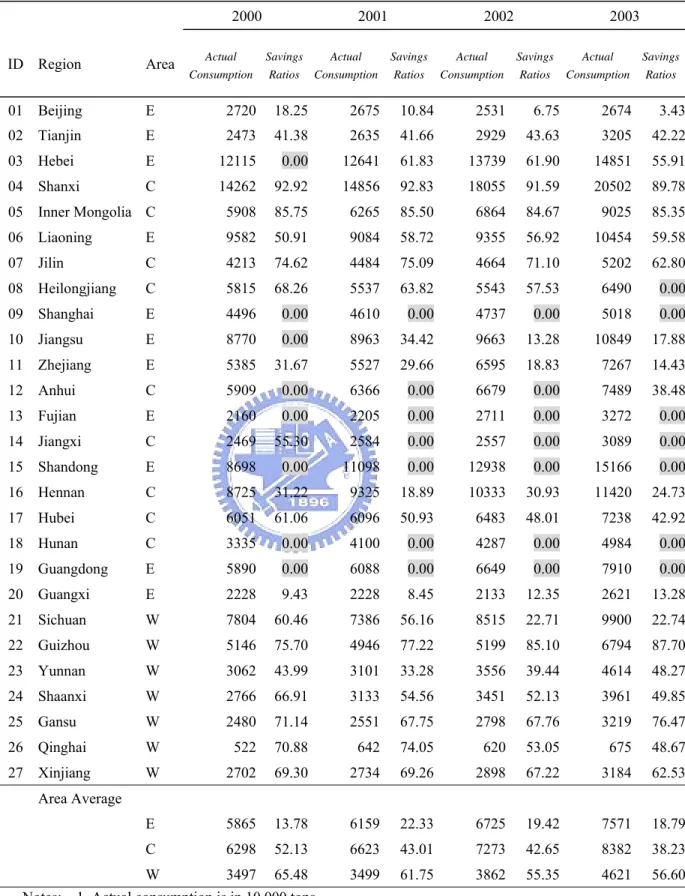
(43) 4. Empirical Analysis. This section is divided into two parts:. Part 4.1 presents empirical results of. mainland China’s energy; and part 4.2 shows the empirical results of mainland China’s waste.. 4.1 Energy of Mainland China. 4.1.1 Regional Savings Ratios for Three Major Types of Energy After the DEA computation, this part shows the regional target savings ratios of coal consumption, gasoline, and electricity consumption during 2000-2003, and the average regional target savings ratios of coal, gasoline, and electricity during 2000-2003. Figures show the trends of regional target savings ratios in the three major areas of mainland China.. 4.1.1.1 Savings Ratios for Coal Consumption As Table 10, the east area has two regions with coal consumption savings ratios always higher than 30% throughout the research period: Tianjin (02) and Liaoning (06).. The central area has six regions with coal consumption target savings ratios. always higher than 30%:. Shanxi (04), Inner Mongolia (05), Jilin (07), Heilongjiang. (08) and Hubei (17), especially Shanxi (04) and Inner Mongolia (05) with target savings ratios higher than 80%. The west area has five regions with coal consumption target savings ratios always higher than 30%: Guizhou (22), Yunnan (23), Shaanxi (24), Gansu (25), Qinghai (26), and Xinjiang (27), especially Guizhou (22) and Gansu (25) with target savings ratios higher than 60%.. 29.
(44) Table 10 Actual consumption and target savings ratios of coal for regions in Mainland China during 2000-2003 2000. 2001. 2002. 2003. Actual. Savings. Actual. Savings. Actual. Savings. Actual. Savings. Consumption. Ratios. Consumption. Ratios. Consumption. Ratios. Consumption. Ratios. ID Region. Area. 01 Beijing. E. 2720. 18.25. 2675. 10.84. 2531. 6.75. 2674. 3.43. 02 Tianjin. E. 2473. 41.38. 2635. 41.66. 2929. 43.63. 3205. 42.22. 03 Hebei. E. 12115. 0.00. 12641. 61.83. 13739. 61.90. 14851. 55.91. 04 Shanxi. C. 14262. 92.92. 14856. 92.83. 18055. 91.59. 20502. 89.78. 05 Inner Mongolia C. 5908. 85.75. 6265. 85.50. 6864. 84.67. 9025. 85.35. 06 Liaoning. E. 9582. 50.91. 9084. 58.72. 9355. 56.92. 10454. 59.58. 07 Jilin. C. 4213. 74.62. 4484. 75.09. 4664. 71.10. 5202. 62.80. 08 Heilongjiang. C. 5815. 68.26. 5537. 63.82. 5543. 57.53. 6490. 0.00. 09 Shanghai. E. 4496. 0.00. 4610. 0.00. 4737. 0.00. 5018. 0.00. 10 Jiangsu. E. 8770. 0.00. 8963. 34.42. 9663. 13.28. 10849. 17.88. 11 Zhejiang. E. 5385. 31.67. 5527. 29.66. 6595. 18.83. 7267. 14.43. 12 Anhui. C. 5909. 0.00. 6366. 0.00. 6679. 0.00. 7489. 38.48. 13 Fujian. E. 2160. 0.00. 2205. 0.00. 2711. 0.00. 3272. 0.00. 14 Jiangxi. C. 2469. 55.30. 2584. 0.00. 2557. 0.00. 3089. 0.00. 15 Shandong. E. 8698. 0.00. 11098. 0.00. 12938. 0.00. 15166. 0.00. 16 Hennan. C. 8725. 31.22. 9325. 18.89. 10333. 30.93. 11420. 24.73. 17 Hubei. C. 6051. 61.06. 6096. 50.93. 6483. 48.01. 7238. 42.92. 18 Hunan. C. 3335. 0.00. 4100. 0.00. 4287. 0.00. 4984. 0.00. 19 Guangdong. E. 5890. 0.00. 6088. 0.00. 6649. 0.00. 7910. 0.00. 20 Guangxi. E. 2228. 9.43. 2228. 8.45. 2133. 12.35. 2621. 13.28. 21 Sichuan. W. 7804. 60.46. 7386. 56.16. 8515. 22.71. 9900. 22.74. 22 Guizhou. W. 5146. 75.70. 4946. 77.22. 5199. 85.10. 6794. 87.70. 23 Yunnan. W. 3062. 43.99. 3101. 33.28. 3556. 39.44. 4614. 48.27. 24 Shaanxi. W. 2766. 66.91. 3133. 54.56. 3451. 52.13. 3961. 49.85. 25 Gansu. W. 2480. 71.14. 2551. 67.75. 2798. 67.76. 3219. 76.47. 26 Qinghai. W. 522. 70.88. 642. 74.05. 620. 53.05. 675. 48.67. 27 Xinjiang. W. 2702. 69.30. 2734. 69.26. 2898. 67.22. 3184. 62.53. E. 5865. 13.78. 6159. 22.33. 6725. 19.42. 7571. 18.79. C. 6298. 52.13. 6623. 43.01. 7273. 42.65. 8382. 38.23. W. 3497. 65.48. 3499. 61.75. 3862. 55.35. 4621. 56.60. Area Average. Notes: 1. Actual consumption is in 10,000 tons. 2. Savings ratios are in percentage terms.. 30.
數據

+7

相關文件
The daily averages of total suspended solids as well as oil and fats in the waste water treated at the WWTP in Macao Peninsula were higher than the standard values of
If we recorded the monthly sodium in- take for each individual in a sample and his/her blood pressure, do individuals with higher sodium consumption also have higher blood
Economic expansion of Macao in the first quarter of 2011 was mainly supported by favourable performance in exports of services, investment and private consumption expenditure,
Average bi-weekly household consumption expenditure by section of goods and service, form of occupancy of living quarter, and bi-weekly household consumption expenditure
Average bi-weekly household consumption expenditure by section of goods and service, form of occupancy of living quarter, and bi-weekly household consumption expenditure
Average bi-weekly household consumption expenditure by section of goods and service, form of occupancy of living quarter, and bi-weekly household consumption expenditure
Solid wastes comprise all the wastes arising from human and animal activities that are normally solid and that are discarded as useless or unwanted.. 重金
Reuse, Reduction and Recycle of Construction and Demolition Waste Construction and Demolition Waste... What is Construction Waste What is
