國 立 交 通 大 學
電信工程學系
博 士 論 文
以雙波帶抑制載波調變及數位信號處理技術為基礎的
光傳輸系統及網路之研究
Optical Transmission Systems and Networks based
on Double-Sideband Modulation with Suppressed
Carrier and Digital-Signal-Processing Techniques
研 究 生:翁佳愷
指導教授:尉應時
以雙波帶抑制載波調變及數位信號處理技術為基礎的
光傳輸系統及網路之研究
Optical Transmission Systems and Networks based
on Double-Sideband Modulation with Suppressed
Carrier and Digital-Signal-Processing Techniques
研 究 生 : 翁佳愷 Student:Chia-Kai Weng
指 導 教 授 : 尉應時 博士 Advisor:Winston I. Way
國立交通大學
電信工程研究所
博士論文
A Dissertation
Submitted to the Institute of Communication Engineering
College of Electrical Engineering and Computer Science
National Chiao Tung University
in
Partial Fulfillment of the Requirements
for the Degree of Doctor of Philosophy
in
Electrical Engineering
May 2008
Hsinchu, Taiwan, Republic of China
以雙波帶抑制載波調變及數位信號處理技術為基礎的
光傳輸系統及網路之研究
研究生:翁佳愷 指導教授:尉應時 博士
國立交通大學 電信工程學系
中文摘要
在本論文中,我們研究以雙波帶抑制載波調變及數位信號處理技術
為基礎的光傳輸系統及網路之研究。主要的研究成果可以分為兩大
部分。首先,我們以實驗及分析方法驗證一個射頻在 18GHz,資料
速率為 5Gb/s 的 16QAM 信號在 100 公里光纖上的傳輸品質。我們評
估光纖放大器雜訊、光纖非線性、雷射光源的相位雜訊、系統頻率
響應以及類比數位轉換器量化雜訊對傳輸系統品質的影響。此
18GHz 的 16-QAM 信號可以直接從基地台以光纖傳送到遠端天線而
不需要頻率轉換器,遠端終端機則可以用 DSP 的方式將信號解調。
在本實驗中,我們是以 20Gs/s 的數位類比轉換器做為信號干擾
(ISI)及相位雜訊抑制數位信號處理(DSP)的前端。這些數位信號處
理模組所使用的演算法也在本論文中有詳細說明。在本論文的第二
部分中,我們提出並以實驗驗證一個在單一光纖雙向傳輸的光網路
中以雙波帶抑制載波為基礎的保護架構。這個架構所需要的光發射
機數量將比傳統架構所需的要少,也就是說一個雙波帶抑制載波的
發射機就可以同時供工作及保護頻道使用。
Optical Transmission Systems and Networks based on
Double-Sideband Modulation with Suppressed Carrier and
Digital-Signal-Processing Techniques
Student:Chia-Kai Weng Advisors:Dr. Winston I. Way
Department of Communications Engineering
National Chiao Tung University
ABSTRACT
In this dissertation, we study the optical transmission systems and networks based on double-sideband modulation with suppressed carrier (DSB-SC) and digital signal processing (DSP) techniques. The main research results are organized in two parts. In the first part, we experimentally and analytically proved the feasibility of a 100km radio-over- fiber (ROF) system using a 16-QAM signal with 5Gb/s bit rate and a carrier frequency of 18 GHz. The transmission system performance was analyzed by considering optical amplifier noise, fiber nonlinearity, phase noise, frequency response, and analog-to-digital converter (ADC) quantization noise. The 18 GHz, 16-QAM signal could be sent from the base station to a remote antenna port without any up-converter, and the remote terminal consists of a down-converter and high-speed digital signal processors (DSPs) to recover the 16-QAM signal. The high-speed DSP, which partially compensates the inter-symbol-interference (ISI) and phase-noise-induced system penalties, was enabled by 20 Gs/s ADCs. The algorithms used in the DSP blocks were also described in details. In the second part of this dissertation, a single-fiber optical unidirectional-path-switched ring (UPSR) based on subcarrier multiplexed double-sideband modulation with suppressed carrier was proposed and experimentally verified. This single-fiber UPSR architecture can be used to reduce the number of required optical transmitters, i.e., a single DSB-SC transmitter can be used for both east- and west-bound wavelengths.
誌 謝
多年的博士求學生涯總算告一段落;首要感謝指導教授尉應時博士塑
造了一個良好的研究環境,讓我們可以在完善的資源、設備及開放的
討論空間下完成各式困難且具挑戰的實驗及研究。同時身為學生及員
工的經驗,老師的指導及要求不只讓我體驗創新、嚴謹及完整對學術
研究的重要性,也讓我累積研發實務經驗,了解高科技產品誕生的流
程及解決問題需要的耐心和執著。在求學過程中,同學及朋友的關心
和照顧也是在我疲憊時支持我往前的動力;感謝學長林玉明博士及交
大光電所陳智宏教授提供適時的精神及實驗資源的協助;感謝坤廷、
維哲及信宏,你們的鼓勵、督促及協助是我完成學業不可少的支援。
最後,要感謝我的家人,沒有你們的全力支持,我絕對無法完成這個
艱難的任務。
Table of Contents
Chapter 1 General Background ...1
Chapter 2 Radio-over-Fiber 16-QAM Transmission Using DSB-SC Transmitter and Remote Heterodyne Detection ...8
2.1 Introduction...8
2.2 Principle of Operation...9
2.3 System Performance Analysis...11
2.3.1 SNR comparison of RSH, coherent detection and SCM system...11
2.3.2 M-QAM RSH system receiver sensitivity ...13
2.4 Experiment...16
2.4.1 Back-to-Back MER Measurement...18
2.4.2 Unrepeated 100 km Transmission Experiment...19
2.5 Discussion...19
2.5.1 Effects of Phase Noise and Frequency Response...19
2.5.2 Back-to-Back Performance Improvement through ISI Equalization and Phase Tracking...20
Chapter 3 A Single-Fiber Optical UPSR Ring Network Using DSB-SC Modulation Technique for Capacity Enhancement...42
3.1 Introduction...42
3.2 Principle of Operation...43
3.3 Experimental Setup and Results...44
3.4 Discussion ...45
Chapter 4 Conclusion...53
List of Figures
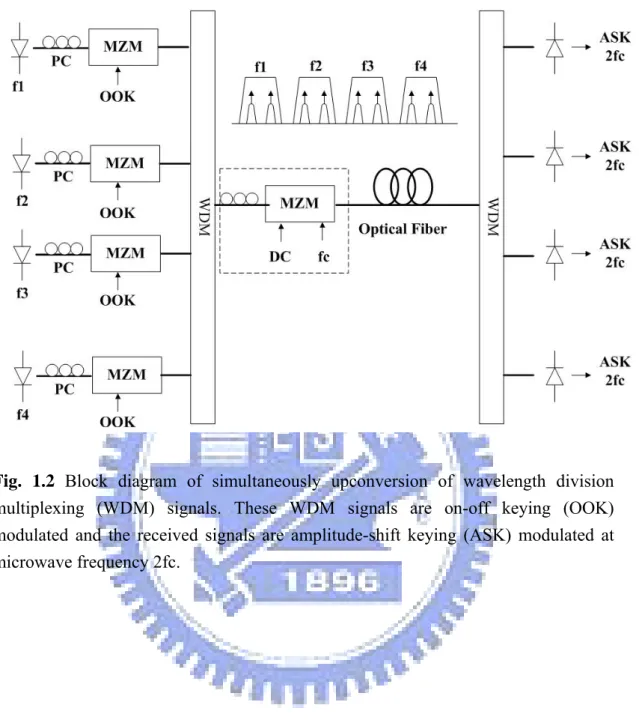
Fig. 1.1 Block diagram of photonic generation, distribution and transmission of microwave signals. Microwave signal at frequency twice of the modulating signal is generated...4 Fig. 1.2 Block diagram of simultaneously upconversion of wavelength division
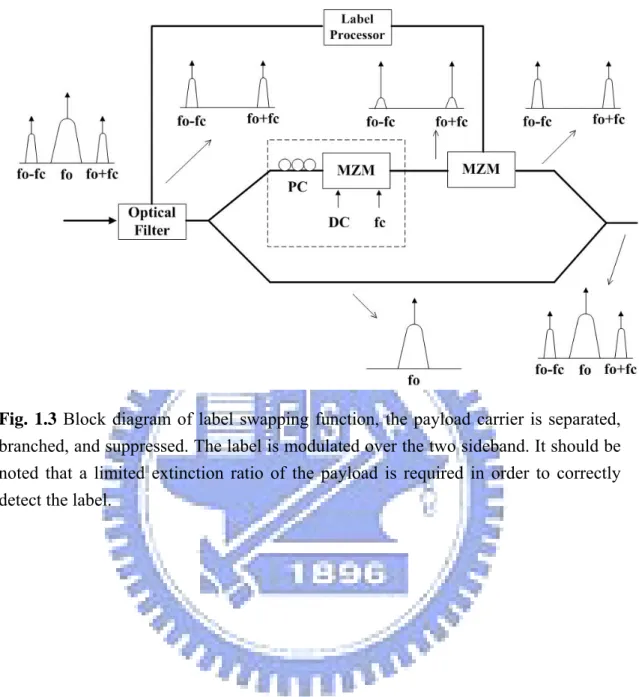
multiplexing (WDM) signals. These WDM signals are on-off keying (OOK) modulated and the received signals are amplitude-shift keying (ASK) modulated at microwave frequency 2fc...5 Fig. 1.3 Block diagram of label swapping function, the payload carrier is separated,
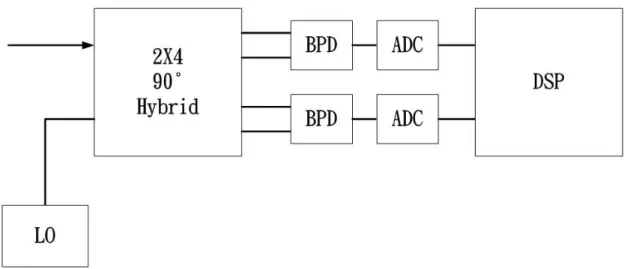
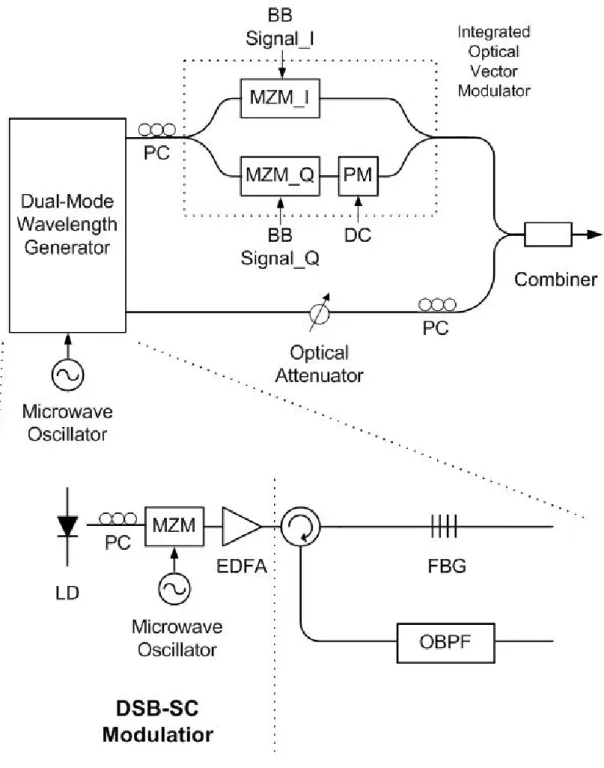
branched, and suppressed. The label is modulated over the two sideband. It should be noted that a limited extinction ratio of the payload is required in order to correctly detect the label...6 Fig. 1.4 A typical coherent and DSP-based optical receiver. LO: local oscillator, BPD: balanced photo-diodes, ADC: analog-to-digital converter, DSP: digital signal processor. This typical configuration consists of a local laser diode, a hybrid coupler, multiple photo-detectors, multiple high-speed analog-to-digital converters (ADCs), and a high-speed DSP to carry out carrier recovery, timing recovery and equalization...7 Fig. 2.1 QAM-Remote Heterodyne (QAM-RSH) transmitter configuration for the
generation of a wideband optical QAM signal. BB Signal_ I/Q: Baseband in-phase/quadratic-phase component of the QAM signal. DC: constant bias voltage. FBG: fiber Bragg grating. FPF: Fabry-Perot filter. ...25 Fig. 2.2 System configuration for a radio-over-fiber system using the proposed
RSH-QAM system.DSP = Digital Signal Processor...26 Fig. 2.3 Description of image-band noise rejection condition of OBPF...27 Fig. 2.4 Calculated results for coherent (η=1/2), RSH (η=1/2 with PS = PLO), and
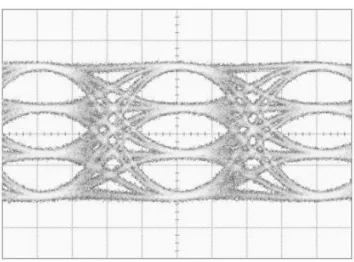
conventional SCM systems (with m=10% and 20%)...28 Fig. 2.5 Measured 4-PAM eye diagram at the output of the
LPF...29
Fig. 2.6 Software processing of the IF data for demodulation...30 Fig. 2.7 Calculated power spectral density of the sampled IF signal...31 Fig. 2.8 Measured 16-QAM constellation diagram (a) back-to-back with MER =
20.58 dB (b) 100 km transmission with 2 dBm launched power with MER = 20.24 dB. The circle points represent the ideal signal constellation, and the dashed lines are the decision thresholds...32 Fig. 2.9 Spectral shape of the OBPF and the spectrum of the dual-wavelength signals
in the experiment. The shorter wavelength is the modulated optical carrier, and the longer wavelength is the un-modulated optical carrier. The spectral
resolution of the optical spectrum analyzer was set at 0.01 nm...33 Fig. 2.10 MER dependence on optical amplifier input power: Solid circle points are
the measured MER; solid and dashed lines are the calculated MER with and without the image rejection filter, respectively; dotted line is the ADC quantization noise-limited MER (with an ENOB of 5 bits)...34 Fig. 2.11 Measured frequency response with (solid line) and without (dotted line)
equalizer, and the ideal raised cosine filter response with roll-off factor of 1(dashed line)...35 Fig. 2.12 Simulated result for MER dependence on SNR, considering only ISI effect
due to the imperfect frequency response. Solid line represents the result without an equalizer. Dash line represents the result with the derived equalizer...36 Fig. 2.13 Software processing for performance improvement through phase tracking
block and ISI equalization...37 Fig. 2.14 Back-to-back MER dependence on the received optical power before the
preamplifier...38 Fig. 2.15 Measured back-to-backsignal constellation diagram with phase estimation
and equalization. (a) for phase estimation block length of N = 125. (b) for phase estimation block length of N = 25...39 Fig. 2.16 Simulation and experimental results for unrepeated 100 km transmission
after performance improvement through the DSP technique. The measured
back-to-back MER is also shown...40 Fig. 2.17 Measured signal constellation diagram after unrepeated 100 km transmission with digital compensation. (a) for launched power of –9 dBm and (b) for launched power of 10 dBm...41 Fig. 3.1 Typical node configuration in a single-fiber O-UPSR network. The node is
composed of a BD-OADM and a DSB-SC transmitter. USB is east-bound and LSB is west-bound...48 Fig. 3.2 Experimental setup. The resolution bandwidth of the measured optical spectra
is 0.01 nm. SMC: suppressed modulated optical carrier, HD1 and HD2: 2nd
harmonic distortion...49 Fig. 3.3 The relative frequency arrangement of the two externally modulated lasers
and their respective double-sideband signals. Note that the OBPF in an ideal case should be narrow enough to filter just one USB or LSB signal...50 Fig 3.4 Experimental setup to investigate the impact of back-reflections: (a) the
transmitted spectrum, (b) the reflected spectrum from 50km fibers, the additional “R” in USB1R, SMC1R, etc., stands for Rayleigh backscattered signals, (c) the reflected spectrum after the interleaver through 50km SMF, and (d) the reflected spectrum after the interleaver with an air interface………...51
Fig. 3.5 Measured (solid symbols) and calculated (solid and dashed lines) power suppression (relative to sideband power) of the optical carrier and the second harmonics (HD). Also shown is the operating point of this experiment...52
Chapter 1 General Background
A general overview of the optical double-sideband with suppressed carrier (DSB-SC) modulation technique and the digital signal processing (DSP)-based optical transmission systems is given in this chapter.
DSB-SC is a modulation technique which could be implemented simply by using a standard Mach-Zhender modulator (MZM) biased at a minimum transmission point of its transfer curve and driven with an electrical tone signal. Various applications has been published in using this modulation technique. In microwave distribution networks, the photonic generation, distribution and transmission of microwave signals has been proposed [1], as shown in Fig. 1.1. In this network, A microwave signal at frequency 2fc is generated and transmitted through optical fiber with low propagation loss using the DSB-SC scheme; moreover, the same scheme could also be used to simultaneously upconvert wavelength division multiplexing (WDM) signals [2], as shown in Fig. 1.2. These WDM signals are modulated with basedband data and the received signals are ASK modulated at microwave frequency 2fc. In the full duplex radio-over-fiber systems [3], wavelength reuse could also be achieved by separating these two sideband through optical filter, modulating one of them, and leaving the unmodulated carrier as the upstream carrier. In all-optical subcarrier labeling based networks [4], the payload carrier is suppressed and the label is modulated over the two sideband. It should be noted that a limited extinction ratio of the payload is required in order to correctly detect the label, as shown in Fig. 1.3.
With the rapid development of complementary metal–oxide–semiconductor (CMOS) digital technology, high speed digital signal processing (DSP) has been recently proposed to be used at both the transmitter and receiver side of optical transmission systems. A typical coherent and DSP-based optical receiver is shown in Fig. 1.4. It can be seen that this typical configuration consists of a local laser diode, a hybrid coupler, multiple photo-detectors, multiple high-speed analog-to-digital converters (ADCs), and a high-speed DSP to carry out carrier recovery, timing recovery and equalization [5]. Various DSP-based data recovery and equalization algorithm have been studied in the literature for both wireless and wireline radio-frequency (RF) transmission systems [33], [34]. Depending on the utilization of the demodulated data sequence in the synchronization process, the synchronization
schemes could be categorized into decision-directed or data-aided (DD/DA) and non-data-aided (NDA). The structure of the synchronizer could be further classified into feedforward (FF) and feedback (FB), according to how the timing/phase estimates are extracted from the received signal. Other applications of DSP in optical transmission systems include optical orthogonal frequency division multiplexing (OFDM) transmission systems [8], equalization based on maximum likelihood sequence estimation (MLSE) [6], and electronic predistortion [7].
A critical block in DSP-based optical transmission systems is the high speed ADC. To achieve a practical solution, an interleaved array of ADCs sampling at lower rate can be employed. By breaking a high speed ADC into parallel low speed ADCs, and independently adjusting the timing phase, gain, offset and frequency response of each low speed ADC, the same resolution is achieved without loss of performance at high speed using the digital calibration techniques [6]. Generally speaking, DSP have been used to relax the component requirement, and extend the dispersion-limited transmission distance.
For traditional coherent receivers, homodyne or heterodyne demodulation scheme uses an optical or electrical phase-locked loop (PLL) that synchronizes the phase and frequency of the local oscillator with the transmitter laser. However, there are limitations on the PLL loop bandwidth, delay and the tracking error, and it has been shown that the PLL-based receivers have a stringent requirement on laser linewidth. With high speed ADCs, the carrier phase can be estimated and tracked by DSP in a feedforward architecture. Recent theoretical and experimental results have shown that the DSP-based coherent receivers with feedforward phase estimation algorithms are more tolerant to laser phase noise than PLL-based receivers [9]. A real-time experiment for 800 Mb/s QPSK transmission based on field-programmable gate array (FPGA) has been demonstrated [10].
Optical orthogonal frequency division multiplexing (OFDM) transmission systems, which have become very popular to achieve a high dispersion-tolerant performance in recent years, rely heavily on DSP technology [8]. OFDM splits a high-speed data stream into a number of low-speed data streams that are transmitted simultaneously over a number of harmonically related narrowband subcarriers. To efficiently implement the multi-carrier modulation, DSP is employed in the transmitter and receiver for the purpose of achieving digital Fourier transformation. Both coherent and direct detection schemes have been proposed and analyzed to implement the optical OFDM transmission systems[8][13]. It should be mentioned that the major
drawbacks of the OFDM systems are (1) the requirement on system linearity, due to the high peak-to-average power ratio (PAPR) of the multi-carrier signals and (2) sensitivity to synchronization parameter, including timing, phase, and frequency errors[44]; therefore, pilot-aided synchronization strategies are usually employed[8], [13].
To compensate the effect of chromatic dispersion (CD) and polarization mode dispersion (PMD), electronic equalization schemes are considered because they are more flexible and cost-efficient than optical equalization schemes. An MLSE receiver provides robust performance in the presence of inter-symbol interference (ISI) by choosing the bit sequence that maximizes the logarithm of the likelihood function [6]. With the efficient realization of Viterbi algorithm, the technical implementation of MLSE receivers at 10 Gb/s is currently commercially available [11].
Another efficient electronic dispersion compensation scheme is electronic predistortion. With the use of a dual-drive MZM or a Cartesian (triple) MZM, real and imaginary part of the predistorted field samples are calculated from the bit pattern in a DSP according to the channel response, and after photodetection, the original electrical signal waveform is recovered [7]. The performance of the electronic predistortion is better than receiver-side equalization schemes with direct detection, because the field signal is processed. An FPGA-based optical transmitter design has been demonstrated [12].
Network protection at the optical layer is generally required to increase the reliability and decrease the downtime of an optical network, especially for transparent optical networks. Conventionally, in the metro/access area, a ring topology with two fibers is usually considered for protection against fiber failure. The common optical fiber protection scheme in the dual-fiber ring networks is optical unidirectional path-switched ring (O-UPSR) [14]. To reduce the number of optical fibers and optical components, single-fiber self-healing ring with bidirectional optical add/drop multiplexers (BD-OADM) has recently been proposed. However, the number of the transmitters and receivers are doubled in these proposed schemes [38].
The dissertation is organized as follows. In chapter 2, we discuss the application of the DSP technology in a remote heterodyne detection system based on DSB-SC modulation technique. In chapter 3, we propose a single-fiber ring architecture to further reduce the number of optical transponders with the application of DSB-SC modulation technique. Chapter 4 concludes the dissertation.
Fig. 1.1 Block diagram of photonic generation, distribution and transmission of
microwave signals. Microwave signal at frequency twice of the modulating signal is generated.
Fig. 1.2 Block diagram of simultaneously upconversion of wavelength division
multiplexing (WDM) signals. These WDM signals are on-off keying (OOK) modulated and the received signals are amplitude-shift keying (ASK) modulated at microwave frequency 2fc.
Fig. 1.3 Block diagram of label swapping function, the payload carrier is separated,
branched, and suppressed. The label is modulated over the two sideband. It should be noted that a limited extinction ratio of the payload is required in order to correctly detect the label.
Fig. 1.4 A typical coherent and DSP-based optical receiver. LO: local oscillator, BPD:
balanced photo-diodes, ADC: analog-to-digital converter, DSP: digital signal processor. This typical configuration consists of a local laser diode, a hybrid coupler, multiple photo-detectors, multiple high-speed analog-to-digital converters (ADCs), and a high-speed DSP to carry out carrier recovery, timing recovery and equalization.
Chapter 2 Radio-over-Fiber 16-QAM
Transmission Using DSB-SC Transmitter and
Remote Heterodyne Detection
2.1 Introduction
To satisfy the ever increasing demand of broadband services, it is very attractive to employ radio-over-fiber (ROF) systems operating at millimeter-wave frequency due to the inherent advantage of low propagation loss and huge bandwidth provided by an optical fiber and mobile access enable by a radio signal. In general, an ROF system transmits an optically modulated radio signal from a central office to base stations with optical fibers. The radio signal is recovered by photodiodes at the base stations and then forwarded to user terminals or antenna units through wireless channels.
In an ROF system which carries millimeter-wave signals, the chromatic dispersion-limited transmission distance can be extended by using optical single-sideband (SSB) modulation technique which is implemented by applying a phase difference of 90° in the two RF electrodes of a dual-electrode Mach-Zhender modulator (MZM) [15], whereas the radio-spectrum-limited capacity can be overcome by using multi-level modulation techniques such as M-ary quadrature amplitude modulation (M-QAM) techniques [16-18]. The M-QAM signals could be generated either through electrical or photonic vector modulation architectures. It should be noted that conventional electrical vector modulation at millimeter-wave frequency requires more than one mixing、 amplification and filtering stages and these signal processing degrades the system quality and limits the flexibility to change the operation frequency, while the photonic vector modulation requires precise phase control between the in-phase and quadrature components.
To transport multi-gigabit/sec data, integrated optical vector modulator (IOVM) is a common method which has been proposed in coherent optical M-QAM systems [18-21]. It should be noted that traditional subcarrier multiplexed M-QAM system
suffers from poor modulation efficiency, dispersion tolerance, and receiver sensitivity [16], while conventional coherent system is economically prohibitive. Therefore, a remote self-heterodyned (RSH) system could serve as an attractive alternative solution [22-24]. In the RSH system, two phase-correlated optical carriers are generated in a dual-wavelength transmitter. After transmission and photo-detection, these two carriers beat with each other and the RF signal is generated. With the combination of IOVM and RSH system, the wideband M-QAM signal could be transmitted with long range. The RSH system is the main subject to be analytically and experimentally investigated in this chapter.
In this dissertation, we propose and demonstrate an optical transmitter based on double-sideband suppressed carrier (DSB-SC) [25], and an optical receiver based on digital-signal-processing (DSP) technique, to build an RSH system which transports multi-gigabit/sec data rate using optical M-QAM. Furthermore, we verified an unrepeated 100 km transmission system with standard single mode fiber (SSMF).
Chapter 2 is organized as follows. In section 2.2, the principle of operation for wideband QAM signal generation is described. In section 2.3, the fundamental performance for RSH is analyzed and the result is compared for coherent detection and SCM systems. In section 2.4, the experimental results on a back-to-back and a 100km transmission system are described. In section 2.5, the DSP technique which was used to improve the system performance degradation is described.
2.2 Principle of Operation
The proposed optical transmitter to generate a wideband optical QAM signal in an RSH system is shown in Fig. 2.1. A double-sideband-suppressed-carrier (DSB-SC)-modulator [25] is used to generate two wavelengths whose frequency and phase differences are tightly controlled through a microwave oscillator. The first wavelength, which serves as the local oscillator at the heterodyne receiver, is un-modulated and properly attenuated. The second wavelength is modulated by an integrated optical vector modulator (IOVM), which is composed of three modulators: a Mach-Zehnder modulator (MZM) for in-phase modulation (MZM_I), an MZM for quadratic-phase modulation (MZM_Q), and a phase modulator for controlling the phase difference between the MZM_I and MZM_Q [26]. To generate an optical 16 QAM signals, MZM_I and MZM_Q are both biased at a minimum transmission point and are modulated by two independent four-level pulse amplitude modulated (4-PAM)
baseband non-return-to-zero (NRZ) signals, while the phase modulator maintains a 90° phase shift between the output signals of MZM_I and MZM_Q. The E-fields of the un-modulated and modulated wavelengths at the output of the QAM-RSH transmitter are given by:
ELO(t)= Acos(ωLOt+θLO(t)) (2-1) and ))] ( sin( ) ( ' )) ( cos( ) ( ' [ ) (t B I t t t Q t t t ES = ⋅ ωS +θS + ωS +θS (2-2)
respectively. In (2-1), A is the amplitude of the remote LO carrier,
) 2 ( 2 0 m LO f f − = π
ω and θLO(t) are the radian frequency and phase of the remote LO
carrier, respectively; f0 is the frequency of the laser diode, and fm/2 is the frequency of
the microwave oscillator. In (2-2), ) 2 ) ( sin( ) ( ' _ I V t I t I π π = and ) 2 ) ( sin( ) ( ' _ Q V t Q t Q π π = , where ( ) n ( s) n I p t nT t I =Σ − and ( ) n ( s) nQ p t nT t
Q =Σ − are the electrical m-PAM data
for the in- and quadratic-phase components of a 2m-QAM signal, respectively; p(t) is a rectangular pulse signal with unit amplitude and time duration Ts; Vπ_I and Vπ_Q are
the half-wave switching voltage of MZM_I and MZM_Q, respectively;
) 2 ( 2 0 m S f f + = π
ω and θS(t) are the radian frequency and phase of the modulated
signal. We assume that the 2m-QAM signal has a uniform and rectangular constellation (m is an even number), and therefore the amplitude levels of the m-PAM must be properly adjusted to compensate for the nonlinear sinusoidal transfer function of the MZM_I and MZM_Q. For example, with
I n V I _ 2 π π = (-0.5π, -0.108π, 0.108π,
0.5π), we obtain a uniformly distributed amplitude of I’(t)= (-1,-1/3,1/3,1). Note that the polarization states of the two wavelengths are aligned through a polarization controller before they were recombined. Owing to the fact that the polarizations and frequencies of both modulated and un-modulated wavelengths are well controlled at a DSB-SC transmitter, an RSH receiver becomes significantly simpler than a coherent receiver.
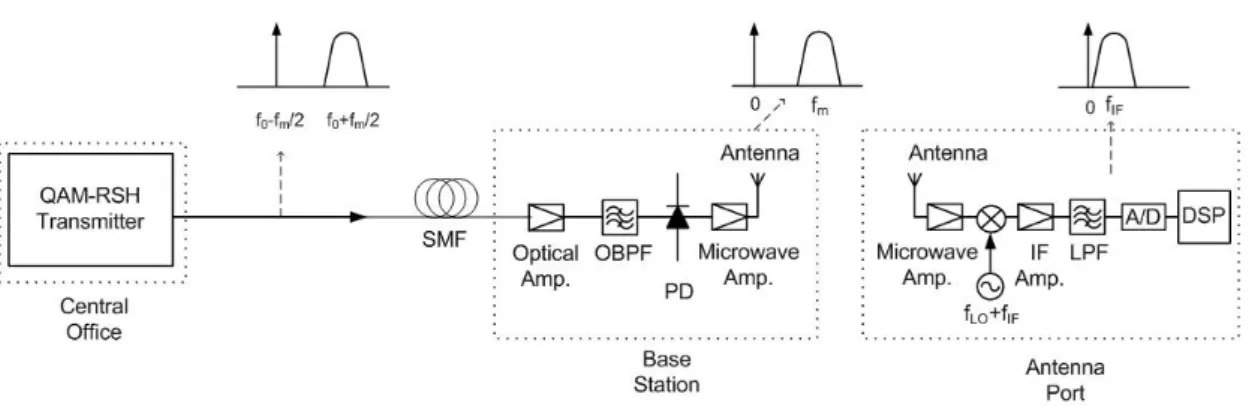
A system diagram for a radio-over-fiber network using the proposed RSH technique is shown in Fig. 2.2. A QAM-RSH transmitter, located in a central office, sent an optical M-QAM signal together with a remote LO carrier through an optical
fiber link with a total optical loss L. At a remote base station, both the modulated signal and reference carrier are amplified by an erbium-doped fiber amplifier (EDFA) with an optical gain G, filtered with an optical bandpass filter (OBPF) centered at f0
and a 3-dB bandwidth of B0, and received by a wideband direct-detection optical
receiver. The detected signal after the wideband optical receiver is given by:
2 )) ( ) ( ( ) (t R GL E t E t Ir = s + LO terms DC t t f t Q t t f t I RGLAB⋅ m +Δ − m +Δ + = [ '( )cos(2π θ( )) '( )sin(2π ) θ( ))] (2-3)
Where R is the photo-diode responsivity, andΔθ(t)=θLO(t)−θS(t). It can be seen from (2-3) that the in-phase modulating signal I’(t) and quadratic-phase modulating signal Q’(t), both at the beat frequency fm, have been recovered. The
microwave/millimeter-wave signal is then amplified and radiated via an antenna. At the remote antenna port, the received microwave/millimeter-wave signal is down-converted to an intermediate-frequency (IF) signal. The optical and electrical spectra are also shown in Fig. 2.2. Note that in a remote antenna port, an IF digital receiver [16][18] is used.
2.3 System Performance Analysis
2.3.1 SNR comparison of RSH, coherent detection and SCM system
In this section, we would like to compare the SNR performances of transmission systems based on three different detection methods: RSH, coherent, and subcarrier-multiplexed (SCM) systems, all with an optical pre-amplifier. We assume that the transmitted signal and LO power at the output of the QAM-RSH transmitter in Fig. 2.2 are Ps and PLO, respectively. Considering only signal-spontaneous (Sig-Sp)
and LO-Spontaneous (LO-Sp) beat noise, we have the IF SNR of an RSH system given by (measured with an electrical bandwidth B at the IF band)
B P P LGS R P P RGL SNR LO S ASE LO S IF RSH ⋅ + = ) ( 2 ) 2 ( 2 1 2 2 , η (2-4)
where 2ηR2LGSASEPS and 2ηR2LGSASEPLO are the Sig-Sp and LO-Sp beat noise
density respectively, B is the IF filter bandwidth, SASE=2neq(G-1)hν is the ASE
spectral noise density in two polarizations, neq is the equivalent spontaneous emission
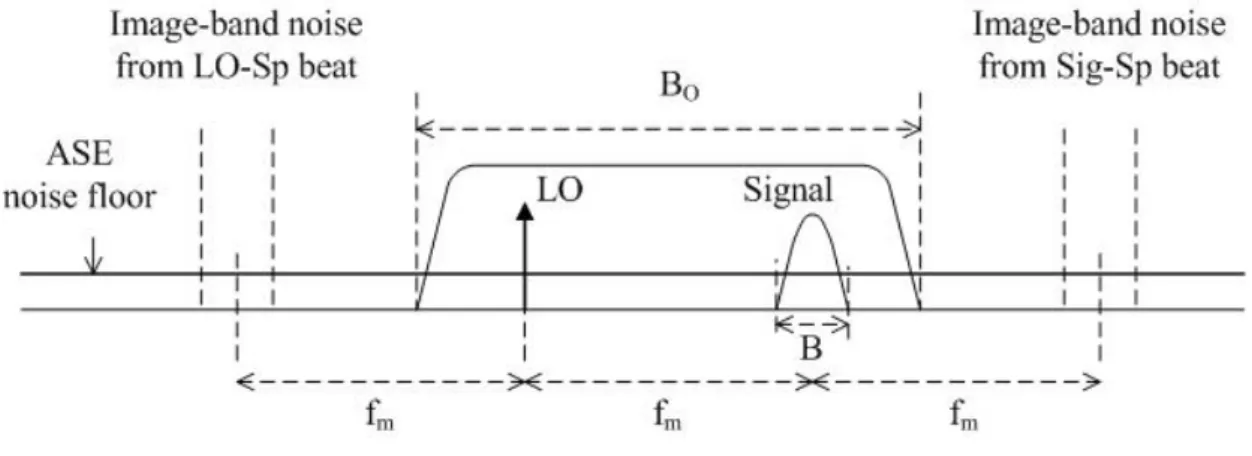
factor of the optical amplifier, hν is the photon energy, and η= 1 or 1/2 depending on the optical filter bandwidth [27]. Here η= 1/2 corresponds to the condition of image-rejecting filtering and is illustrated in Fig. 2.3. It could be seen from Fig. 2.3 that, when the optical filter (centered at f0) has a bandwidth Bo<3fm-B, the in-band
noise can be reduced by 3 dB due to the image-band LO-Sp and Sig-Sp noise rejection.
The maximum SNR at the demodulator output for RSH system, derived from Eq.(2-4) when Ps = PLO is then given by:
B h n LP SNR eq T IF RSH = η⋅ ν 8 , for G >> 1 (2-5)
where PS = PLO = PT/2, and PT is the total optical power at the transmitter output.
For coherent heterodyne detection based on a strong LO signal located at receiver, assuming the LO power is significantly greater than that of the amplified signal, the noise is dominated by LO-Sp beat noise, and the SNR at the output of a photo-detector is given by:
B h n LP B P S R P GLP R SNR eq T LO ASE LO S coh = η = η⋅ ν 2 2 ) 2 ( 2 1 2 2 for G >> 1 (2-6)
Note that PT= PS for the coherent heterodyne system. It can be observed from (2-5)
and (2-6) that for the same total transmission power, the maximum achievable SNR for coherent heterodyne detection based on a strong LO signal is 6 dB higher than that of RSH detection.
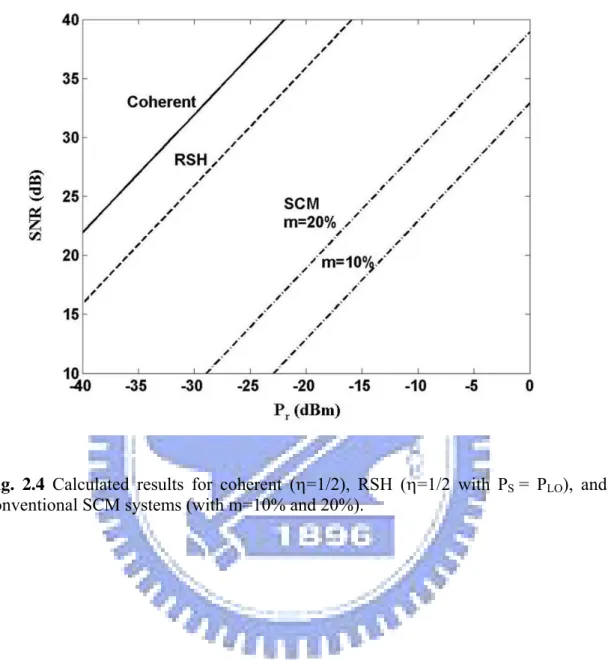
B h n LP m B GLP S R GLP Rm SNR eq T rms T ASE T rms SCM ν 8 2 ) ( 2 1 2 2 2 = = for m << 1 (2-7)
where mrms is the root-mean-square optical modulation index, and is typically less
than 20%. For example, if mrms = 10%, the SNR penalty of an SCM system is 23 dB
when compared with an RSH system with PS= PLO and η= ½, given that both
systems have the same total transmission power and ASE noise floor. Fig. 2.4 shows the calculated SNR as a function of the total received power (Pr=LPT) for the
three transmission systems (B=2.5GHz and neq=2). We can see that even though the
RSH system has a 6 dB worse SNR performance than a conventional coherent system, it has a significant SNR advantage over conventional SCM systems.
Note that the calculated results in Fig. 2.4 for SCM systems were based on a linear electrical-to optical (E-O) transfer function, and therefore a small error could be incurred for OMI=20% if the E-O transfer function is not linear. It should also be noted that at OMI higher than20%, the constellation was severely degraded because of the in-band nonlinear distortion, and the effect could not be evaluated simply from SNR measurement.
In our experiment, an actually measurable parameter called modulation error ratio (MER) was obtained. MER is defined as MER = 2 2
2 2 ) ( ) ( r o r o r r Q Q I I Q I − + − + , where Ir, Qr
are the demodulated in-phase and quadrature-phase symbols, and Io, Qo are the ideal
normalized in-phase and quadrature-phase QAM symbols. Note that MER is equal to the baseband SNR (given in Eq.(2-10)) when only uniform additive white Gaussian noise (AWGN) is considered.
2.3.2 M-QAM RSH system receiver sensitivity
In this section, we would like to compare the receiver sensitivity of ASK, 4-QAM, 16-QAM, and 64-QAM modulations in an RSH system with an ideal pre-amplifier (neq = 1), by using a bit-rate-independent figure of merit, i.e., the required photons per
bit to achieve a bit-error ratio (BER) of 10-9. Our analysis is based on the following assumptions: (1) synchronous demodulation [28] with a matched-filter is used, (2) Ps
= PLO, (3) η = ½, and (4) the noise variance for each constellation point is equal to
amplitude-dependent noise for QAM BER calculation. In our calculation and Monte Carlo simulation, however, amplitude-dependent noise could cause some excessive optical power penalty of ~1 dB for 16-QAM and ~1.4 dB for 64-QAM modulation when a mid-point threshold was used.
Following Eq.(2-4), we have the IF signal at the photo-detector output given by: ) ( ) cos( ) 2 ( 2 ) (t RGL P P t n t SIF = s LO ωIF + for bit “1” (2-8) and ) ( ) (t n t SIF = for bit “0” (2-9)
Note that we have assumed that the single-sided noise density N0 for mark and space
is the same and given by:
0 2
0 2R GL(P P )n (G 1)hf
N = S + LO eq − (2-10)
where we have assumed that the optical image rejection filter was used. After an ideal down-conversion and a matched-filter detector, we obtain an output signal given by
∫
⋅ = Tb IF IF D S t t dt T t S 0 ( ) 2cos( ) 1 ) ( ω (2-11)The SNR at the matched filter output is then described by [36]:
b eq LO S LO S b b LO S D D R hf n P P P LP R N R N P P L G R S S SNR 0 0 0 2 2 2 2 0 2 1 2 0 _ 2 1 _ ) ( 2 2 2 0 4 + = + + = + + = σ σ for G>>1 (2-12)
Where SD_1 and SD_0 are the sampled signal of mark and space bit, respectively. For
a fixed total transmission power PT=PS+PLO, the maximum SNR is achieved when
b eq T ASK D R hf n LP SNR 0 _ 2 = (2-13)
Assuming both mark and space have Gaussian conditional probability density
functions with a decision threshold at RGL PSPLO , the BER of RSH ASK detection is
then given by ) ) ( ( ) 2 ( 0 0 S LO eq b LO S b LO S R hf n P P P LP Q R N P P RGL Q BER + = = for G>>1 (2-14)
For PS=PLO=PT/2, the BER becomes
) 4 ( 2 1 ) 8 ( 2 1 ) 4 ( _ 0 0 ASK D b eq T b eq T ASK SNR erfc R hf n LP erfc R hf n LP Q BER = = = (2-15)
where SNRD_ASK is the symbol signal-to-noise ratio of the sampled matched-filter
signal. The baseband SNRD_ASK is equal to IF SNR by letting B=RS/2=Rb/2 in
Eq.(2-4) and we have
2 2 _ b b eq T ASK D n R h n LP SNR = ⋅ = ν (2-16)
where nb is the average received photons per bit. To achieve a BER=10-9, the
required nb for ASK modulation is then equal to 144. For a coherent heterodyne
systems using synchronous detection, the required nb is 36 [28], which is 6 dB
superior to that of an RSH system.
To calculate the BER for a demodulated M-QAM signal, the symbol SNR (SNRD_QAM) of the sampled matched-filter signal at baseband is first determined. The
SNRD_QAM is equal to SNRIF by letting B=2(RS/2)=2(Rb/2log2M) by considering only
The SNRD_QAM is then given by 4 log 4 log2 2 _ b b eq T QAM D n M R h n LP M SNR = ⋅ = ν (2-17)
The M-QAM signals can be decomposed into two independent M -PAM signals.
The error probability of these two M -PAM signals is the same and could be treated
independently. With Gray coded bit mapping and the assumption that errors occur between neighbor pairs in the constellation, the BER of a square-shaped M-QAM constellation over AWGN channel is derived from [29]. The BER for 4-, 16- and 64- QAM modulation is then given by:
) 2 ( 2 1 _ 4 QAM D QAM SNR erfc BER− = (2-18) ) 10 ( 8 3 _ 16 QAM D QAM SNR erfc BER − = (2-19) ) 42 ( 24 7 _ 64 QAM D QAM SNR erfc BER − = (2-20)
To achieve BER=10-9, the required nb for 4-, 16- and 64- QAM modulation are
given by ~ 72 (SNRD_4QAM=15.6 dB), ~ 178 (SNRD_16QAM=22.5dB) and ~ 489
(SNRD_64QAM=28.7dB), respectively. Note that if we compare the 4- and 16-QAM
results with those of [30], which shows the required photon numbers per bit are 18 and 45, respectively, we can clearly see the 6 dB receiver sensitivity advantage of a coherent heterodyne system. It is worth mentioning here that the ~6 dB higher SNRD requirement of 64-QAM than 16-QAM implies a higher ~6 dB OSNR in the
optical transmission system and could present a significant challenge.
2.4 Experiment
The experimental setup is essentially what we have shown in Figs 2.1 and 2.2. The dual-wavelength signal generator was constructed via a DSB-SC transmitter with
a modulating tone of 9 GHz. One of the wavelengths was filtered by a fiber grating (FBG) and sent into an X-cut LiNbO3 IOVM which consists of three modulating ports
[26], two of which functioned as the interfaces to a pair of synchronized and independent 4-PAM signals. Each of these two ports had a half-wave switching voltage of ~5 V. The third port, a DC port with a half-wave switching voltage of ~6 V, was used to control a phase modulator. The other wavelength was reflected by the FBG, and passed through a Fabry Perot filter (FPF) to further suppress the unwanted spurious signals. This filtering configuration achieved more than 35dB suppression of spurious signals for both wavelengths. The modulated and the un-modulated wavelengths were combined and heterodyned at a remote 20 GHz photo-diode to generate a wideband QAM signal at 18 GHz. By using a microwave mixer and a local oscillator (LO) at 19.5 GHz, the 18 GHz signal was amplified and down converted to an IF frequency at 1.5GHz. The 1.5 GHz IF signal was amplified and sampled by a high-speed digital oscilloscope (Tektronics TDS7404) with analog-to-digital converters (ADCs) running at 20 Gs/s. The amplitude of the IF signal was ~400 mVpp. The amplitude level was optimal in the sense that the ADC
was run at nearly a full scale and the quantization noise can be reduced without significant signal distortion. The digital data was stored and processed by an offline software based on Matlab program in the personal computer, similar to those used in [16] [18] and [31].
Each of the two 4-PAM signals was generated by superimposing two binary non-return-to-zero (NRZ) signals with a proper amplitude adjustment to equalize the differences between any two adjacent power levels [32]. The binary NRZ data was 1.25 Gbps, which corresponds to 5 Gbps data rate for the 16-QAM signal. Note that each 4-PAM signal was formed by using the data and data-inverse outputs of a pulse pattern generator (PPG). The data and inverse-data outputs were de-correlated by a transmission cable, and the transmission-cable-induced delay was fine tuned via a mechanical delay line for symbol synchronization. The 4-PAM signal was then amplified and filtered by a linear-phase low-pass-filter (LPF) with a 3dB–bandwidth of 930 MHz. The measured eye diagram at the LPF output is shown in Fig. 2.5. The peak-to-peak voltage of the 4-PAM signal was ~6 V, which corresponds to ~0.6 modulation index (= Vpp/2Vπ_I,Q). Note that to generate two 4-PAM signals
synchronously, two PPGs operating in master and slave mode were used, and the symbol synchronization between the two PPGs was adjusted by the clock phase of the master PPG.
Q-components were subsequently separately filtered by a digital Raised-cosine filter with 3-dB bandwidth of 875 MHz and an alpha factor of 0.4, and re-sampled to keep one sample per symbol period with a decimation factor of 16 (20GHz/1.25GHz). Due to the different physical propagation lengths experienced by the modulated and un-modulated optical carriers, the phase difference between them caused the measured constellation rotated with an arbitrary phase. This phase rotation can be compensated by multiplying a complex phasor. A constellation analyzer, which computes the modulation error ratio (MER), was used to measure the link performance of the 5 Gbps 16-QAM signal [16]. The block diagram of the software demodulation is shown in Fig. 2.6. The Fourier transformed power spectral density of the IF signal is shown in Fig. 2.7. The resolution bandwidth was 10 MHz, and the 20 dB bandwidth was ~ 2 GHz, which demonstrates an achievable spectral efficiency of ≥ 2.5 bits/Hz (= 5 Gb/s/(2 GHz)).
The measured constellation at the software constellation analyzer is shown in Fig. 2.8(a). Also shown in this figure are the ideal signal constellation and the decision boundaries for data decision. No error was observed in the window duration of 12.5k symbols. The measured MER was 20.58 dB. It should be mentioned that the MER (or SNRD_QAM) to achieve a BER=10-9 is ~22.5 dB via Eq. (2-19).
An optical pre-amplifier was used before the 20GHz photo-detector, and its total optical power was controlled to be -6dBm via a variable optical attenuator. The optical amplifier was followed by an optical bandpass filter (OBPF) with a 3-dB bandwidth of ~ 40 GHz. The optical spectrum showing the OBPF filter shape and the dual-wavelength signals are shown in Fig. 2.9.
2.4.1 Back-to-Back MER Measurement
The measured and calculated MER are shown in Fig. 2.10. The calculated total MERt includes the optical pre-amplifier-limited MEROA, and the quantization
noise-limited MERq. MEROA is obtained from Eq. (2-5)with neq=2, B=RS=1.25GHz,
LPT=Pr, and an η is between 1/2 and 1 due to the imperfect image rejection via the
OBPF in the experiment. MERq is given by 6.02×ENOB+1.76 (dB), where ENOB is
effective number of bits of the sampling scope’s ADC and is equal to 5 in our experiment. It can be seen that themeasured MER (circle points) is lower than the calculated MERt by as much as ~11 dB. This severe degradation is caused by the
inter-symbol interference (ISI) and phase noise, which will be discussed in section 2.5.
2.4.2 Unrepeated 100 km Transmission Experiment
After the back-to-back measurement of MER is done, a 100-km SMF transmission fiber, anda booster- amplifier, were added to the experimental setup. The received optical power of the wideband photodetector was again fixed at –6 dBm.
The measured MER was 20.24 dB when the fiber input power was 2 dBm. The measured constellation is shown in Fig. 2.8(b). There is a smaller than 0.4 dB MER penalty compared to that of the back-to-back performance. Therefore, it is clear that the transmission performance is limited by the back-to-back setup, whose performance is limited by ISI and phase noise to be described in the next section.
2.5 Discussion
2.5.1 Effects of Phase Noise and Frequency Response
The effect of carrier phase noise is characterized by the same experiment setup as shown in Figs. 2.1and 2.2. In order to get an independent phase measurement without data modulation, only DC signals are applied to the IOVM. The DC bias levels are adjusted and controlled in a manner that the I/Q ports of the IOVM are both biased at maximum transmission power. The received single-frequency IF signal was digitally I/Q down-converted, low-pass filtered, and its phase calculated via MATLAB program. By fitting the measured data to a Gaussian distribution, we found that the standard deviation σp of phase was ~ 0.05 radians (2.86˚). The total recorded
number of samples was 12.5k. The phase noise sources include: (a) the LO phase noise in the transmitter, (b) the phase difference between the modulated carrier and LO which propagated through the system with different transmission lengths, and (c) the 19.5GHz LO (see Fig. 4.2) phase noise in the receiver. Note that the measured system SNR was very high (> 30 dB) and therefore the impact of theamplitude noise was negligible in this phase noise characterization.
The MER penalty Dphase due to phase noise, which is the ratio of MER (at the
presence of both phase noise and additive white Gaussian noise (AWGN)) and SNR (while only AWGN is presents), is given by [33] (approximated for σp << 1):
) 1 log( 10 2 p Phase SNR D = + ⋅σ (2-21)
For an SNRof 30 dB, Dphase is 5.44 dB, which is quite significant if the phase noise is
left uncompensated.
The frequency response measurement setup is also the same by replacing the PPG with a microwave synthesizer at the input of the IF amplifier. The frequency of the output signal from the microwave synthesizer is changed from 50 MHz to 1250 MHz with a step of 50 MHz and the microwave synthesizer output power was used as a reference. The received sample of this single-frequency IF signal is then digitally I/Q down-converted, low pass filtered, and Fourier transformed by the offline processor, and the results are shown as the dotted line in Fig. 2.11. Note that the resultant power was calculated and normalized to the transmitted power at the corresponding frequency, and was the average measured results of I- and Q- channels (note that there is no significant difference between the I- and Q- channels). An ideal raised cosine filter with a roll-off factor of 1 is also shown in Fig. 2.11 for comparison. The non-ideal frequency response would induce ISI on the QAM signal, and its effect was investigated through simulations by comparing the measured frequency responses with and without an equalizer (whose design will be described later). A low-pass equivalent model was used. The simulation results are shown as the solid line in Fig. 2.12. It is shown that, for SNR = 30 dB (and therefore the system is not limited by SNR), the MER penalty due to ISI is ~4.6 (=30-25.4) dB without the equalizer. The MER is limited to ~ 27 dB even with SNR > 35 dB without the equalizerbecause the ISI dominates the MER penalty.
2.5.2 Back-to-Back Performance Improvement through ISI Equalization and Phase Tracking
In order to improve the back-to-back MER performance, we implemented a time-domain ISI equalizer and a phase tracking block, both within a Matlab-based demodulator, as is shown in Fig. 2.13. The detailed functions of the phase tracking block and ISI equalizer are described in the following sections.
ISI Equalization: The equalizer is designed to compensate the imperfect frequency
response of the back-to-back system, and is not attempted to equalize the transmission-induced transfer function.
To compensate the ISI effect in the back-to-back system, an adaptive feed-forward equalizer (FFE) is applied to equalize the system response. The adaptive equalizer is based on the well-known least-mean-square (LMS) algorithm [34]. The equalizer has 128 taps with tap frequency equivalent to symbol rate, and is trained with the collected samples in a personal computer iteratively. With ~ 105 training symbols, the MER is converged and the filter coefficients are fixed in our experiment. It should be noted that the adaptive algorithm is only used to blindly compensate the static system transfer function; after the filter coefficients are converged we did not attempt to dynamically adjust it. The effect of the equalizer is illustrated in Fig. 2.12. We can see that there was ~2.7 dB MER improvement at SNR=30 dB by using the equalizer.
Phase error correction: We used feed-forward decision directed (FF-DD)
carrier phase recovery algorithm [35] for phase error correction. It has been shown that such algorithm realizes maximum-likelihood (ML) carrier phase estimation in an approximate form for high SNR. Unlike the traditional phase-locked loop (PLL) approach [21][33], the feed-forward algorithm estimate the carrier phase directly through an explicit form without relying on one-dimension searching process iteratively provided by PLL. Hence, no loop delay is introduced which is very suitable for tracking the carrier phase generated by the beating of optical carriers, such as in coherent optical systems [31], and the DSP causes negligible processing latency. The FF-DD algorithm estimates the carrier phase for the k-th block of symbols with the following form:
) ) ( ). ( ˆ arg( ˆ 1 *
∑
= = N i k k k a i z i θ (2-22)where θˆk is the ML carrier phase estimation for the k-th block of symbols, ˆ*()
i ak is
the complex conjugate of the i-th decision output of the k-th block of symbols derived from ˆ 1
−
k
θ , zk(i) is the i-th received symbol of the k-th block, and N is the length of
the block. The initial phase (θˆ0) would be estimated from the preamble bits in the
acquisition stage of the phase recovery block. The decision on the i-th symbol of the k-th block is then updated after subtracting the carrier phase drift derived from the k-th ML phase estimation: ) ). ( ( ) ( ~ ˆ k j k k i DEC z i e a = −θ (2-23)
where a~k(i) is the final decision output, and DEC() computes the decision metrics for
M-QAM signals. It should be noted that the phase drift should not vary significantly over NT, where N is the block length and T is the symbol rate, in order to get a correct estimate. Note that a larger N can reduce the estimation error because the noise level is averaged over a larger time window, while a smaller N provides faster tracking of the carrier phase.
The resultant MER improvement due to the combined effect of ISI equalizer and phase error correction block is shown in Fig. 2.14. The case for MER improvement through only phase tracking block is shown with a dotted line for N = 125 and 25, respectively. The difference of MER between N = 125 and 25 is not significant (The measured MER at Pr = -15 dBm was 21.44 dB for N = 125, and 21.78 dB for N = 25). Note that higher N is preferred from the viewpoint of phase updating rate even though the required buffer size is larger; for example, in our experiment, N = 25 stands for a phase updating rate of 50 MHz for 1.25Gsps symbol rate, and stands for 10 MHz for N = 125. The later significantly simplifies the hardware implementation with a reduced clock rate of the digital signal processor with negligible MER penalty. As shown in Fig. 2.14, experimentally we obtained ~ 1 dB MER improvement through the phase tracking block.
The MER performance with both phase tracking block and ISI equalizer is shown in Fig.2.14 for N = 125 and N = 25, respectively. The measured MER is 24.15 dB and 24.62 dB for N = 125 and N = 25, respectively, for Pr = -15 dBm. The total
MER improvement is ~ 3.5 dB for N = 125, and ~ 4 dB for N = 25 through the combination of phase correction and ISI equalization. The equalizer by itself improves the measured MER with ~ 2.7 dB, independent of N. This improvement is consistent with the simulation result. The measured signal constellation after the phase estimation block and the equalizer is shown in Fig. 2.15(a) and 2.15(b), for N = 125 and 25, respectively.
When ISI equalization and phase error tracking are both applied, the required received optical power before the optical amplifier is ~ -28 dBm to achieve BER=10-9 (MER=22.5 dB), according to Fig. 6.4. This received power level corresponds to ~ 2465 photons/bit for 5Gbps data rate, and the penalty is 11.4 dB compared to the ASE-limited receiver sensitivity of 178 photons/bit.
In summary, the performance improvement (at Pr = -15 dBm)through DSP blocks
is shown in the following table:
The DSP blocks are then applied to the stored data for unrepeated 100 km transmission experiment and the performance is compared with results obtained from a computer simulation using VPI. The simulation parameters of VPI were the same as the parameters used in the experiment: Optical fiber loss = 0.2dB/km, optical fiber chromatic dispersion = 17ps/nm, optical fiber nonlinear index = 2.6×10⁻²⁰ m2/w, and optical fiber core area =80 μm2, f
LO – fQAM = 20 GHz, optical amplifier noise figure =
6 dB, modulation index = 0.6, and the symbol length = 1024×16 symbols. The MER was obtained with the combined use of VPI and Matlab. In the simulation, both the carrier phase recovery and frequency-response are assumed to be ideal, and only the fiber dispersion and nonlinear effects were considered. The simulation and experimental results (with DSP and N=125) for the 100km system are shown in Fig. 2.16. Also shown in Fig. 2.16 is the back-to-back experimental performance after DSP improvement. The measured back-to-back MER was ~24 dB, which is ~4 dB improvement from the original back-to-back MER performance of 20 dB (shown in Fig. 2.10). The improvement, as mentioned previously, was due to ~2.7 dB from ISI equalizer and ~1 dB from phase error correction. However, comparing with the theoretical calculated MER = 31 dB at Pr= -15 dBm (see Fig. 2.10), there is still a MER penalty of ~7 dB (for N=125). The ~7 dB penalty was due to the non-ideal matched filter, ADC, frequency response, and the nonideal 4-PAM electrical signal generation (as can be observed in Fig. 2.5).
.
In Fig. 2.16, the measured MER after phase error correction and ISI equalization for the 100km transmission system, at an optimum fiber input power of 2 dBm, is 23.98 dB. This is about 2 dB lower than the simulation result. For higher and
lower launched power levels than 2 dBm, the discrepancy between the measured and simulated MER is smaller, because in those power regions the nonlinear and ASE noise effects dominates over the ISI effect, respectively. Note that the reason why the measured MER is lower than the simulated ones by ~2 dB is because of the residual back-to-back penalty that could not be compensated by the DSP blocks.
The measured constellations for a launched power of 2 dBm is essentially the same as that shown in Fig. 2.15(a). At a launched power of –9 dBm and 10 dBm, the constellation diagrams of the received signal after DSP are shown in Fig. 2.17(a) and (b), respectively. In Fig. 2.17(a), we can see that the noise is higher for the constellation points at the corners, which demonstrates the modulation amplitude-dependent noise due to Sig-Sp beat noise. In Fig. 2.17(b), there is an obvious phase rotation due to self-phase modulation (SPM) for constellation points at the edges. The phase tracking algorithm could not track the constellation well when the phase shift of the constellation points is intensity dependent.
Fig. 2.1 QAM-Remote Heterodyne (QAM-RSH) transmitter configuration for the
generation of a wideband optical QAM signal. BB Signal_ I/Q: Baseband in-phase/quadratic-phase component of the QAM signal. DC: constant bias voltage. FBG: fiber Bragg grating. FPF: Fabry-Perot filter.
Fig. 2.2 System configuration for a radio-over-fiber system using the proposed
Fig. 2.4 Calculated results for coherent (η=1/2), RSH (η=1/2 with PS = PLO), and
Fig. 2.8 Measured 16-QAM constellation diagram (a) back-to-back with MER =
20.58 dB (b) 100 km transmission with 2 dBm launched power with MER = 20.24 dB. The circle points represent the ideal signal constellation, and the dashed lines are the decision thresholds.
Fig. 2.9 Spectral shape of the OBPF and the spectrum of the dual-wavelength
signals in the experiment. The shorter wavelength is the modulated optical carrier, and the longer wavelength is the un-modulated optical carrier. The spectral resolution of the optical spectrum analyzer was set at 0.01 nm.
Fig. 2.10 MER dependence on optical amplifier input power: Solid circle points are
the measured MER; solid and dashed lines are the calculated MER with and without the image rejection filter, respectively; dotted line is the ADC quantization noise-limited MER (with an ENOB of 5 bits).
Fig. 2.11 Measured frequency response with (solid line) and without (dotted line)
equalizer, and the ideal raised cosine filter response with roll-off factor of 1(dashed line).
Fig. 2.12 Simulated result for MER dependence on SNR, considering only ISI effect
due to the imperfect frequency response. Solid line represents the result without an equalizer. Dash line represents the result with the derived equalizer.
Fig. 2.13 Software processing for performance improvement through phase tracking
Fig. 2.14 Back-to-back MER dependence on the received optical power before the
Fig. 2.15 Measured back-to-back signal constellation diagram with phase estimation
and equalization. (a) for phase estimation block length of N = 125. (b) for phase estimation block length of N = 25.
Fig. 2.16 Simulation and experimental results for unrepeated 100 km
transmission after performance improvement through the DSP technique. The measured back-to-back MER is also shown.
Fig. 2.17 Measured signal constellation diagram after unrepeated 100 km
transmission with digital compensation. (a) for launched power of –9 dBm and (b) for launched power of 10 dBm.
Chapter 3 A Single-Fiber Optical UPSR Ring
Network Using DSB-SC Modulation Technique
for Capacity Enhancement
3.1 Introduction
Optical unidirectional-path-switched-ring (O-UPSR) [37] is a common optical fiber protection scheme in optical ring networks. It uses two optical fibers carrying counter-propagating uni-directional traffic, with transmitting wavelengths bridged to both fibers, and receiving-end optical switches selecting signals from one of the two fibers. When there is a signal loss due to an optical fiber break, the optical switches toggle. Wavelength-division multiplexing (WDM) transmission has been proposed to save one of the two fibers [38]. However, when there is only one optical fiber, the wavelengths in the two transmission directions must be different in order to avoid in-band cross-talks caused by Rayleigh or fiber-cut back-reflections. This implies that half of the wavelength capacity is lost. To gain the capacity back, a natural solution is to double the available wavelengths by reducing the channel spacing. However, when the number of wavelengths is doubled, the number of the corresponding transceivers is also doubled [38]. In other words, even though an optical ring fiber is saved, twice as many optical transceivers must be used.
In chapter 3 of this dissertation, we propose a method which doubles the transmission capacity in a single-fiber O-UPSR system without doubling the transceivers. The method utilizes optical double sideband modulation with suppressed carrier (DSB-SC) [39] to automatically duplicate the modulating signal in east- and west-bound wavelengths (on “even” and “odd” ITU (International
Telecommunication Unit) wavelength grids) which are spaced twice denser than that used for a two-fiber O-UPSR.
3.2 Principle of Operation
Fig. 3.1 shows an optical node configuration in a single-fiber O-UPSR ring network which utilizes a bi-directional optical add-drop multiplexers (BD-OADM) and a DSB-SC transmitter. The BD-OADM is composed of a pair of back-to-back odd-ITU-channel multiplexer (O-MUX) and demultiplexer (O-DEMUX), and a pair of back-to-back even-ITU-channel E-MUX and E-DEMUX. The DSB-SC transmitter generates two similar 10 Gb/s sub-wavelengths which are 2·fc apart (see
the inset of Fig.1) by upcoverting a 10 Gb/s baseband data to a microwave frequency
fc. The upconverted signal is then applied to a dual-drive high- speed Mach-Zehnder
modulator (MZM), which is biased at a voltage level to minimize the optical carrier power [39]. For convenience, we call the channel centered at fc an USB
(upper-sideband), and the channel centered at –fc an LSB (lower-sideband).
In Fig. 3.1, USB’s are always east-bound via E-MUX and E-DEMUX, while LSB’s are always west-bound via O-MUX and O-DEMUX. In each direction, there is an optical amplifier and a dispersion-compensation module (DCM). As in a conventional optical add/drop configuration, the back-to-back MUX and DEMUX allow channels dropped, added, and passed through. At each end of the optical node, there is an optical wavelength interleaver which enables bi-directional transmission of the USB’s and LSB’s [37,39]. Note that the USB’s and LSB’s fit into the even and odd ITU-grids of the interleavers, respectively.
The output of the DSB-SC transmitter is split into two directions, one goes to the input port of the E-MUX, whereas the other goes to the input port of the O-MUX. The E-MUX rejects all the LSB-channels, whereas the O-MUX rejects all the USB-channels. Reflected signals due to Rayleigh backscattering are supposed to be suppressed by the interleaver through its high isolation between odd and even ITU channels, and will not reach the receiver. At the receiving end, both LSB and USB signals are dropped and one of them is selected by an optical switch (SW). When
there is a fiber cut on the ring network, the switch automatically toggles if a loss of the working channel is detected.
3.3 Experimental Setup and Results
Our experimental setup is shown in Fig. 3.2. Two continuous-wave lasers (CW1, CW2) with 200 GHz channel spacing were used in the experiment. Their center frequencies were shifted 25GHz away from a typical 50GHz ITU grid, so that the USB’s and LSB’s can sit right on the 50GHz ITU grid if fc is chosen to be 25 GHz
(see Fig. 3.3). The wavelengths of CW1 and CW2 after the 25GHz offsetting were 1554.33 and 1555.95 nm, respectively. Both lasers were respectively externally modulated by a 10Gb/s NRZ signal using a single-electrode LiNbO3 modulator. The
modulated signals were then combined via a WDM filter and sent to a dual-drive LiNbO3 modulator. To achieve DSB-SC modulation (in this case, the “suppressed
carrier” is actually a “suppressed modulated carrier (SMC)”) at both wavelengths, the dual-drive modulator was modulated by a 17 dBm microwave oscillator at 25 GHz and biased at its minimum optical power point. The half-wave DC voltage of the push-pull modulator was 4.5 V. To minimize the modulated optical carrier and the microwave harmonic distortion (HD), the microwave driving power and the delay between the microwave driving signals at the two electrodes were carefully tuned. The method presented in Fig. 3.2, which uses only one microwave module, can be applied to a lab environment when there are multiple DSB-SC wavelengths. In Fig. 3.2, the two 50/100GHz interleavers were used to simulate the two interleavers in Fig. 3.1. No MUX or DEMUX is used in this experiment, which does not affect the experimental result. The 50/100GHz interleaver has a 0.5dB bandwidth of 35 GHz, and suppresses adjacent channel by more than 15dB. For demonstration purpose, two optical switches (SW1 and SW2) were used to select either LSB or USB to pass through the interleavers. From the optical spectrum at the output of the dual-drive modulator, it can be seen that the suppression of the modulated optical carrier and the 2nd harmonic distortion were both more than 30 dB. The optical spectra at the output of the second interleaver show that the adjacent USB or LSB channel suppression was more than 35 dB due to the cascaded interleaver/de-interleaver pair (the upper and lower spectra show predominantly the USB’s and LSB’s when SW1 or SW2 was
on, respectively). The adjacent channel crosstalk was actually 10-15 dB lower than the amplified spontaneous emission (ASE) power and should cause negligible system penalty.
The effect of the Rayleigh back-scattering was also examined, and the results are shown in Fig. 3.4. The optical spectrum shown in the inset (a) is the transmitted USB’s with a launched power per channel of 0 dBm. Note that the LSB’s were not suppressed as deep as that shown in Fig. 3.2 because the DSB-SC signal passed through only one interleaver. The optical spectrum in the inset (b) is the reflected USB/LSB’s after 50 km of conventional single-mode fiber transmission. In this spectrum, the Rayleigh backscattering (RB) signals and spontaneous Brillouin scattering (SpBS)-induced shifted frequencies (shifted by ±11GHz) were observed [40]. The measured Rayleigh reflection is -35.3 dB. After the interleaver, the USB’s were suppressed another 19~24 dB, while the LSB’s power remained essentially the same, as shown in Fig. 3.4(c). If we add the LSB suppression due to the transmitting-end E-MUX (~10 dB) with 100GHz ITU-grid spacing, the received RB-reflected LSB power level could be as low as -70 dBm (10 dB lower than what is shown in Fig. 3.4(c)). When there is a fiber-cut-induced air-interface back reflection, the reflected LSB is about 20 dB higher than that in the RB signal, as shown in Fig.4(d), i.e., having a power level around -50 dBm. In both cases, the reflected LSB power should be way below a normally received westbound LSB signal (-20 ~ -25 dBm), and therefore resulted in a <1dB system power penalty [41].
Using the experimental setup shown in Fig. 3.2, we measured the BER performance and obtained a less than 1 dB system power penalty at a BER of 10-9, for both the LSB and USB signals (at 1555.95 nm and 1554.33 nm). Note that the results obtained were based on an optical band pass filter (OBPF) with a 1-dB bandwidth of ~100GHz (see Fig. 3.3), and a commercial 10Gb/s PIN receiver.