行政院國家科學委員會專題研究計畫 成果報告
石油價格波動對中國等金磚四國股票市場之影響
研究成果報告(精簡版)
計 畫 類 別 : 個別型 計 畫 編 號 : NSC 98-2410-H-004-040- 執 行 期 間 : 98 年 08 月 01 日至 99 年 07 月 31 日 執 行 單 位 : 國立政治大學經濟學系 計 畫 主 持 人 : 方中柔 處 理 方 式 : 本計畫可公開查詢中 華 民 國 99 年 10 月 27 日
行政院國家科學委員會補助專題研究計畫
■ 成 果 報 告
□期中進度報告
石油價格波動對中國等金磚四國股票市場之影響
計畫類別:
■
個別型計畫 □整合型計畫
計畫編號:NSC
98-2410-H-004-040
執行期間: 98 年 8 月 1 日至 99 年 7 月 30 日
執行機構及系所:
國立政治大學經濟學系
計畫主持人:
方中柔
共同主持人:
計畫參與人員:
成果報告類型(依經費核定清單規定繳交):
■
精簡報告 □完整報告
本計畫除繳交成果報告外,另須繳交以下出國心得報告:
□赴國外出差或研習心得報告
□赴大陸地區出差或研習心得報告
□出席國際學術會議心得報告
□國際合作研究計畫國外研究報告
處理方式:
除列管計畫及下列情形者外,得立即公開查詢
□涉及專利或其他智慧財產權,□一年□二年後可公開查詢
中 華 民 國 99 年 10 月 25 日
計畫中文摘要:
雖然有許多實證研究曾探討石油價格變動和經濟活動之關係,但令人意外的是:在相關文獻 中,卻很少提及油價波動對金磚四國(巴西、俄羅斯、印度和中國)股票市場之影響。因此,本計畫 擬利用2001/1 至 2008/9 較新及詳盡的月資料,對此一議題作深入的探討,希望能夠彌補文獻上之 空缺。因依先前相關實證分析顯示,油價可能混合不同性質之波動,此將和傳統文獻中高油價會導 致股價下跌的結論並不完全相同。故本計畫擬利用Kilian and Park (2009)所提之計量方法,將油價 波動區分為總供給、總需求、與石油市場之特定需求三個面向出發,探討不同面向的油價波動對中 國等金磚四國股市的影響。有別於Kilian and Park (2009)利用美國資料的實証分析,我們發現:所 有類型的油價波動對印度股價並沒有顯著影響;而對俄羅斯來說,總供給和石油市場之特定需求波 動對俄羅斯的股價呈現明顯的正向關係,其結果與高油價必然導致股價下跌的關係相反。對中國大 陸而言,石油價格衝擊對其股價的影響程度則界於俄羅斯與印度之間,即石油市場之特定需求波動 對股價有正向影響,而總供給波動則無顯著影響;造成此結果的可能原因為,中國經濟快速成長的 正向擴張效果被負向的預防性需求效果所抵銷。 本計畫的結果與先前的實證結果一致:俄羅斯、印度和中國的股票市場與全球的市場具有區 隔及整合的混和特性,隱含了此三個國家與其他國家的股票市場及石油價格的衝擊具有「部分整合」 的特徵。 關鍵詞:石油價格;油價波動;股票市場;新興工業國家;中國股市 Abstract
Although a lot of empirical research has studied the relationship between changes in oil price and economic activity, it is surprising that little research has been conducted on the relationship between oil price shocks and the BRIC (Brazil, Russia, India, and China). Therefore, this paper modifies the procedure of Kilian and Park (2009) and investigates how explicit structural shocks that characterize the endogenous character of oil price changes affect three BRICs’ stock-market returns, in order to fill this gap. From the empirical analysis, we find that the impact of oil price shocks on stock prices in three BRICs has mixed, it has partially in contrast to the effects on the U.S. and developed countries’ stock market. Firstly, we find that all shocks have no significant impacts on India’s stock returns. Additionally, in contrast to the early traditional literature that higher oil prices necessarily causes lower stock prices, both global and oil specified demand shocks have significantly positive impacts on Russia stock returns. However, the impact of oil price shocks on China stock returns has the mixed condition between Russia and India. This means that only oil specified demand shock has significantly positive effects, but both global supply and demand shocks have no significant impacts on China stock returns. The reason for the lack of significant impacts is that the positive expectation effect of China’s fast economic growth may be just offset by the negative effect of a precautionary demand driven effect. This result is also consistent with the previous empirical findings that the segmented and integrated three BRICs’ stock market is mixed, and it implies that the three BRICs’ stock market is “partially integrated” with the other stock markets and oil price shocks.
1. Introduction
NYMEX crude oil futures were trading near $10 at the beginning of 1999. Over the next decade, the crude oil prices move explosively to $147 by July 2008.1 What cause the 2008 high oil prices? Hamilton (2009) concludes that there are three key variables responsible for the high oil prices in summer of 2008: (1) the low price elasticity of demand; (2) the strong growth in demand from some large newly industrialized nations, such as Brazil, Russia, India, and China or BRIC; and (3) the failure of global production to increase. Among them, BRIC was first prominently used in the thesis of Goldman Sachs investment bank (Wilson and Purushothaman 2003). They argues that the growth and high returns of the BRIC countries should persist over the next 50 years and lead to a sharp rise of the BRICs in global investment portfolios. Furthermore, since the energy intensiveness of these economies as they experience a rapid economic growth and energy is used less efficiently, the economic impact of higher oil prices on developing countries is generally more severe than that for industrialized countries. According to the International Energy Agency (IEA) report,2 on average, developing countries use more than twice as much oil to produce a unit of economic output as do OEDC countries. Therefore, the rise of BRIC should be the main reason to cause the high oil prices from now to the future.
In fact, higher oil prices may affect the global economy through a variety of channels, including transfer of wealth from oil consumers to oil producers, a rise in the cost of production of goods and services, and impact on inflation, consumer confidence, and financial markets. In a pioneer work, Hamilton (1983) indicated that higher oil prices were responsible for almost all U.S recessions after World War II. Later, the bulk of the empirical researches have studied the relationship between oil price changes and macroeconomic activities. However, it is surprising that little research has been conducted on the relationship between oil price shocks and financial markets. Few studies have examined the effects of oil shocks on the stock market and economic activities, and these have been mainly for a few industrialized countries such as the United States, United Kingdom, Japan, and Canada. Furthermore, Economic liberalization and integration of international markets, characterized with increased level of capital flows and international investments in these emerging economies, have made global investors more vulnerable to oil price impact on emerging stock markets. But little attention has been devoted to inquiring about the impact of the fluctuations in the price of crude oil on stock markets for some large, newly industrialized economies (NIEs).3 Therefore, understanding the level of susceptibility of stock prices in emerging economies to movement in global oil prices is very important.
However, even changes in the price of crude oil are often considered an important factor for understanding fluctuations in stock prices, there is no consensus about the relation between stock prices and the price of oil among literatures. Since there is a strong presumption in the financial press that oil prices drive the stock market, economists, such as Kilian (2009), Kilian and Park (2009), recently began asking whether changes in macroeconomic variables cause oil price changes, leading to the decomposition of those oil price changes into the structural shocks hidden behind such changes. That is, different sources of oil price changes may imply non-uniform effects on certain macroeconomic variables.
1 See Tokic (2010, p. 6010) exhibit1 for detail.
2 See “Analysis of the Impact of High Oil Prices on the Global Economy,” (May 2004) for detail. 3 See Papapetrou (2001) for detail.
Therefore, the conventional wisdom that higher oil prices necessarily cause lower stock prices is shown to apply to oil-market specific demand shocks such as increases in the precautionary demand for crude oil. In contrast, positive shocks to the global demand for industrial commodities cause both higher real oil prices and higher stock prices, which helps explain the resilience of the U.S. stock market to the recent surge in the price of oil in 2008. Consequently, this paper studies the dynamic interactions between oil price and stock returns utilizing a structural vector autogressive model (SVAR) approach for these Large NIEs, in order to understand the relationship between oil price shocks and BRICs’ stock market.
The remainder of this paper is arranged as follows. Section 2 provides a brief review of existing work and outlines our contribution to the literature. Section 3 briefly reports economic situation in the BRICs. Section 4 describes the data and empirical methodology applied in this study. Section 5 reports the estimation results. Finally, Section 6 concludes the main findings of our analysis.
5. Empirical findings
5.1 Basic statistics description and stationary test
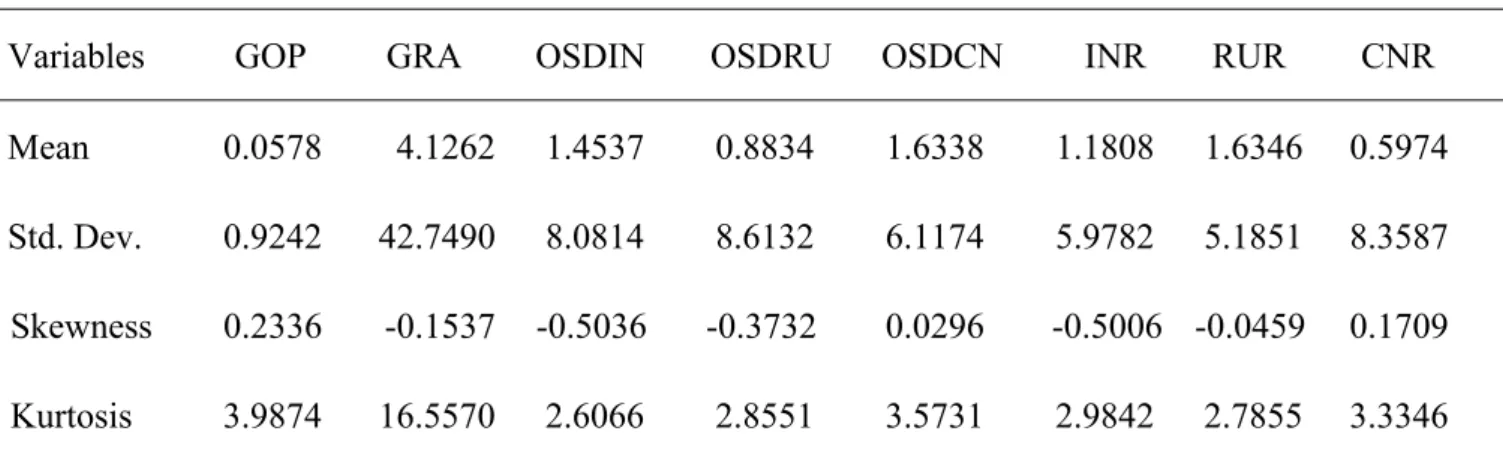
From Table 1, we can find that the mean profit of India stock return is the highest among the three economies’ stock returns. From all stock returns’ skewness and kurtosis, we see that the financial time series data have fat tail properties. Firstly, the positive mean of the global real activity change rate (4.12%) shows that global demand will increase as oil prices rise. This increasing demand effect could explain the global boom in commodity markets in the early 21st century, which was driven by strong economic growth worldwide. In addition, the mean of global oil production change rate (0.05%) shows that the global oil supply shock is also positive, and this means that the global oil shock will gradually increase with the higher global demand. Finally, the positive mean of specified oil demand or supply change rate of all markets could reveal that all three economies’ oil demand or supply will increase due to their fast economic growth among the three BRICs.
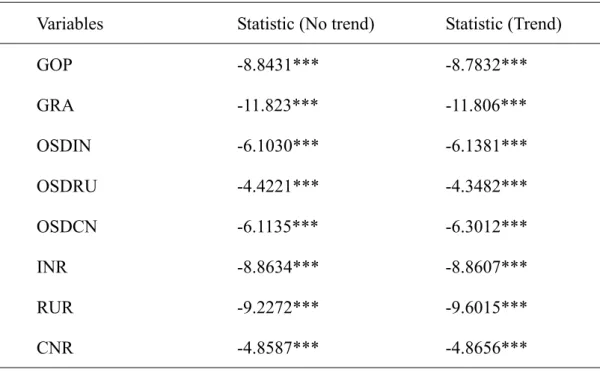
From Table 2, the results of ADF test show that stock returns in all economies have no unit root property. These means that all variables have no persistent impacts, and the current effect of one market shock on the others will disappear in the future. Hence, we can implement the SVAR estimation and IRA to process our analysis in the following section.
Table 1: Basic Descriptive Statistics Unit: %
Variables GOP GRA OSDIN OSDRU OSDCN INR RUR CNR
Mean 0.0578 4.1262 1.4537 0.8834 1.6338 1.1808 1.6346 0.5974
Std. Dev. 0.9242 42.7490 8.0814 8.6132 6.1174 5.9782 5.1851 8.3587
Skewness 0.2336 -0.1537 -0.5036 -0.3732 0.0296 -0.5006 -0.0459 0.1709
Kurtosis 3.9874 16.5570 2.6066 2.8551 3.5731 2.9842 2.7855 3.3346
means the specified demand change rate of India, OSDRU means the specified demand change rate of Russia, OSDCN means the specified demand change rate of China, INR means India stock return, RUR means Russia stock return, and CNR means China stock return.
2. The data used in this paper are from 2001/1 to 2008/9. After the first difference, the number of observations in our sample is 93.
Table 2: Stationary tests (ADF test)
Variables Statistic (No trend) Statistic (Trend)
GOP -8.8431*** -8.7832*** GRA -11.823*** -11.806*** OSDIN -6.1030*** -6.1381*** OSDRU -4.4221*** -4.3482*** OSDCN -6.1135*** -6.3012*** INR -8.8634*** -8.8607*** RUR -9.2272*** -9.6015*** CNR -4.8587*** -4.8656*** Note: 1. ** *represents 1% significant level.
2. Stationary test in this paper is ADF test. The 1% critical value without trend is -3.50 and 1% the critical value with trend is -4.06.
4.2 Estimation results
4.2.1 SVAR estimation
In this section, we present the SVAR parameters estimation in Table 3.4 The structural estimation is from Equation (4) above, which is similar to Kilian and Park (2009). Firstly, the global oil production (or supply) shock has no significantly effect s on the India, Russia, and China stock markets. The reason is obviously that the negative supply shock may hurt the economy, but the good economic performance of three BRICs could mitigate this negative impact.5 Secondly, we can find that the global demand shock significantly only affects the Russia stock market but not in India and China stock markets. The reason for this finding is that both India and China stock markets may be relatively isolated from the world stock markets and global economy.
Additionally, the specific oil demand shock has no significantly impact on India stock market. But the oil supply shock has a significantly positive impact on Russia stock market. The result is reasonable
4 For VAR estimation, we let the optimal lagged periods for the three models be 24.
5 For example, China’s economic growth rate was 11.1% in 2006, 11.4% in 2007 and 9% in 2008 and the average economic growth rate
because Russia is the oil exporter and increasing export oil price will make the Russia economy better than before. However, even China as the oil importer, the specific oil demand shock has also significantly positive effect on China stock markets. This means that there could be other effects among them. For instance, the good expectations will make China still experience strong economic growth during the higher oil price period, and this positive effect may be larger than the former negative precautionary demand effect.6
Finally, the last “other” shock has a significant positive effect on the stock return. This shock (or residual) is defined as unobservable effect on the stock markets. Consequently, the positive effect means that this is not captured by our model, such as the noise in three BRICs’ stock markets or relaxation of the limits on investment in these countries, which could make the stock return increase.
Table 3: SVAR Parameters Estimation
Regressors INR RUR CNR
GOP -0.0013 (0.0072) 0.0264 (0.4825) -0.6663 (0.8873) GRA 1.1520 (0.7228) 0.9961** (0.4760) -0.2377 (0.8855) OSD -0.6925 (0.7091) 0.9722** (0.4631) 2.0691** (0.8703) Other 6.3230** (0.4998) 4.0851 ** (0.3230) 7.6948** (0.6046) Note: 1. ** represents 5% significance level.
2. The definition of variable is the same in Table 1. 3. In the parentheses is the standard error.
5.2.2 Impulse response analysis
In this section, we employ IRA to investigate how these three shocks affect three BRICs’ stock markets. As described in Kilian (2009) and Kilian and Park (2009), we find that the effect in these stock markets are partially in contrast to that in the U.S. stock market, as shown in Figure 1-3. These results show that the response of large-sized NIEs’ real stock returns may differ greatly depending on whether the increase in the price of crude oil is driven by demand shocks or supply shocks in the crude oil market. This imply that the oil specific demand shock (OSD) has a significantly positive impact on Russia and China stock return, the global demand shock (GRA) has a significantly positive impact on Russia stock return. However, only the global supply shock (GOP) has no significant impact on all these emerging countries which similar to Kilian’s finding in the U.S.
6 The positive effect of average economic growth in China from 1997 to 2007 is 9.5% per year. However, this positive effect could
become smaller since Chinese capital mobility control is stricter than in other economies, and then China’s stock market is relatively isolated from the world stock markets and global economy.
Firstly, we find that all shocks have no significant impacts on India’s stock return as show in Figure 1. This finding is contrast to Kilian (2009), and Kilian and Park (2009), who found that the global and the oil specific demand shocks have different significant effects on the U.S. stock market. Since the regulation limit and capital mobility control are with much more restrictions than other countries, it makes India’s stock market more separate and independent from the world economy. Therefore, the reason that there is no significant impact is that the positive expectation effect of India’s fast economic growth may be just offset by the negative precautionary demand driven effect.
Additionally, in contrast to the early traditional literature that higher oil prices necessarily causes lower stock prices, we find that all global supply and demand two shocks have significantly positive impacts on Russia stock returns in Figure 2. This finding is partially in contrast to that in Kilian (2009), and Kilian and Park (2009), who find that the oil specific demand shock is driven by precautionary demand for crude oil, and then has a negative impact on the stock market. Since Russia is the oil exporter, the reason for the positive effect on the Russia stock market is that the positive expectation effect of Russia’s fast economic growth and no negative effect of the precautionary demand driven effect. In addition, this positive expectation effect means that the investors expected the Russia economy to still perform well and capital to continue to flow in during the higher oil price period. In fact, the average economic growth rate of Russia from 1997 to 2007 was one of the highest around the world. Consequently, we can find that the response of Russia stock markets to these shocks is always positive.
Finally, only oil specific demand has significantly positive effects, but both global supply and demand shocks have no significant impacts on China stock returns. This finding is also partially in contrast to that in Kilian (2009) and Kilian and Park (2009), and the effect has mixed condition between Russia and India. At first, similar to the Russia condition, the reason for oil specific demand shock has positive effect on the China stock market is that the positive expectation effect of China’s fast economic growth may be greater than negative effect of the precautionary demand driven effect. Since the average economic growth rate of China from 1997 to 2007 was about 9.5%, the highest around the world. However, similar to the India condition, the result of global demand and supply shocks have no significant impacts is obviously that the regulation limit and capital mobility control are with much more restrictions than other countries, it makes China’s stock market more separate and independent from the world economy. Therefore, the reason that there is no significant impact is that the positive expectation effect of China’s fast economic growth may be just offset by the negative precautionary demand driven effect. In fact, this result is also consistent with Wang and Firth (2004)’s empirical findings that the segmented and integrated China stock market is mixed. It implies the China’s stock market is “partially integrated” with the other stock markets and oil price shocks.
6. Concluding remarks
Although a huge body of empirical research has studied the relationship between oil price changes and macroeconomic activity, it is surprising that little research has been conducted on the relationship between oil price shocks and BRICs’ stock returns. Some studies have examined the impacts of oil shocks on the stock market and economic activity, but mainly for a few industrialized countries such as the United States, United Kingdom, Japan, and Canada (See Papapetrou (2001)). Furthermore, one major impact in both oil markets and in the international monetary system since the late 1990s is the emergence
of BRICs. The BRICs are four biggest emerging economies combined they account for two-fifths of the total GDP of all emerging economies. Wilson and Purushothaman (2003) firstly identified these four emerging markets which together could be larger than the G6 within the next forty years. In financial terms, between 1986 and 1995 stock market capitalization in emerging countries grew ten-fold from $171 billion to 1.9 trillion and market share held in capitalization increased from 4 percent to 11 percent, mostly to these major emerging markets. In addition, 18 percent of total annual oil demand in 2006 came from the BRICs, and approximately 23 percent in 2030. However, there are not many studies explaining the relationship among oil price shocks and stock market returns in BRICs.
Additionally, Kilian and Park (2009) were the first to show that the response of aggregate U.S. real stock returns may differ greatly depending on whether the increase of the price of crude oil is driven by demand or by supply shocks in the crude oil market. Therefore, the main goal of this paper is to study the dynamic interactions between oil price and stock returns utilizing a SVAR approach for BRICs. We employ a new and detailed monthly data set from 2001/1 to 2008/9, in order to understanding the relationship between different oil price shocks and the return of BRICs’ stock market in detail, and fill this gap..
Unfortunately, we cannot find detail Brazil oil price data from all international energy statistic institutions, then we only discussing other three emerging economies in this paper and left this gap as the future research. From this paper empirical analysis, we find that the impact of oil price shocks on the three BRICs’ stock prices has been mixed. Firstly, we find that all shocks have no significant impacts on India’s stock return. Since the regulation limit and capital mobility control are with much more restrictions than other countries, it makes India’s stock market more separate and independent from the world economy. Therefore, no significant impact is that the positive expectation effect of India’s fast economic growth may be just offset by the negative precautionary demand driven effect. Additionally, in contrast to the early traditional literature that higher oil prices necessarily causes lower stock prices, we find that all global and oil specified demand shocks have significantly positive impacts on Russia stock returns. Since Russia is the oil exporter, the positive effect on the Russia stock market is that the positive expectation effect of Russia’s fast economic growth and no negative effect of the precautionary demand driven effect. Finally, the impact of oil price shocks on China stock returns has the mixed condition between Russia and India. This means that only oil specified demand shock has significantly positive effects, but both global supply and demand shocks have no significant impacts on China stock returns.
This result is also consistent with the previous empirical findings that the segmented and integrated three BRICs’ stock market is mixed, and it implies that the three BRICs’ stock market is “partially integrated” with the other stock markets and oil price shocks.
國科會補助專題研究計畫成果報告自評表
請就研究內容與原計畫相符程度、達成預期目標情況、研究成果之學術或應用價
值(簡要敘述成果所代表之意義、價值、影響或進一步發展之可能性)
、是否適
合在學術期刊發表或申請專利、主要發現或其他有關價值等,作一綜合評估。
1. 請就研究內容與原計畫相符程度、達成預期目標情況作一綜合評估
■
達成目標
2. 研究成果在學術期刊發表或申請專利等情形:
論文:□已發表
■
未發表之文稿 □撰寫中 □無
專利:□已獲得 □申請中 □無
技轉:□已技轉 □洽談中 □無
其他:(以
100 字為限)
3. 請依學術成就、技術創新、社會影響等方面,評估研究成果之學術或應用價
值(簡要敘述成果所代表之意義、價值、影響或進一步發展之可能性)(以
500 字為限)
(1) 學術理論價值:相關文獻中,很少提及油價波動對中國等大型新興工業國家 (NIEs)股票市場之影響。因此,本計畫擬利用 2001/8 至 2008/9 較新及詳盡的月資料, 對此一議題作深入的探討,希望能夠彌補文獻上之空缺。因依先前相關實證分析顯示, 油價可能混合不同性質之波動,此將和傳統文獻中高油價會導致股價下跌的結論並不完 全相同。故本計畫擬利用Kilian and Park (2009)所提之計量方法,將油價波動區分為總 供給、總需求、與石油市場之特定需求三個面向出發,探討不同面向的油價波動對中國 等金磚四國股市的影響。 (2) 政策參考價值:有別於美國等已開發國家資料的實証分析,我們發現:近年來 快速經濟成長吸引投資者繼續將資金留在中國等金磚四國股市,較不會預期油價上揚而 有獲利結清的動作,故中國等金磚四國股市相對於其他國家股市受整體經濟變化的影響 較小。因此,三個不同面向的油價波動對中國等金磚四國股市的影響可能會有所不同。 最後,我們更近一歩利用變異數分解法,探討油價波動長短期總效果對中國等金磚四國 股市的解釋能力,並將和其他國家資料所得之結果作一比較。理論推導及分析的結果, 或許可以用來瞭解或評估油價管制政策,在實際上執行之可行性與可能遭遇的困難。 (3) 參與人員獲得之訓練:從事此項研究人員,除了可瞭解如何利用傳統的時間序列分析 法進行研究,以圖形及表格來評估油價管制政策的成效性。另外,還可從進行SVAR 估計, 再利用估計之結果進行脈衝反應分析;用以探討不同變數的衝擊,對中國等大型新興工業 國家股票市場報酬的影響。從演練及討論中,學習如何應用到經濟意義的解釋與政策效果 的分析。98 年度專題研究計畫研究成果彙整表
計畫主持人:方中柔 計畫編號:98-2410-H-004-040- 計畫名稱:石油價格波動對中國等金磚四國股票市場之影響 量化 成果項目 實際已達成 數(被接受 或已發表) 預期總達成 數(含實際已 達成數) 本計畫實 際貢獻百 分比 單位 備 註 ( 質 化 說 明:如 數 個 計 畫 共 同 成 果、成 果 列 為 該 期 刊 之 封 面 故 事 ... 等) 期刊論文 0 0 100% 研究報告/技術報告 0 0 100% 研討會論文 0 1 100% 篇 將 於 台 灣 經 濟 學 會 2010 年會發表 論文 論文著作 專書 0 0 100% 申請中件數 0 0 100% 專利 已獲得件數 0 0 100% 件 件數 0 0 100% 件 技術移轉 權利金 0 0 100% 千元 碩士生 0 0 100% 博士生 0 2 100% 博士後研究員 0 0 100% 國內 參與計畫人力 (本國籍) 專任助理 0 0 100% 人次 期刊論文 0 1 100% 預期將投稿 SSCI 國際期刊 研究報告/技術報告 0 0 100% 研討會論文 0 0 100% 篇 論文著作 專書 0 0 100% 章/本 申請中件數 0 0 100% 專利 已獲得件數 0 0 100% 件 件數 0 0 100% 件 技術移轉 權利金 0 0 100% 千元 碩士生 0 0 100% 博士生 0 0 100% 博士後研究員 0 0 100% 國外 參與計畫人力 (外國籍) 專任助理 0 0 100% 人次其他成果