Pergamon
Solid State Communications, Vol. 97, No. 10,pp.
821-825, 1996 Copyright 0 1996 Elsevier Science Ltd Printed in Great Britain. All rights reserved 0038-1098/96 $12.00+.00 003%1098(95)00777-6ORIENTATIONAL PHASE TRANSITION IN Na&, (&2): 13C NMR STUDY
Ilias I. Khairullint, Wen-Tsung Chang, and Lian-Pin Hwang*
Department of Chemistry, National Taiwan University, and Institute of Atomic and Molecular Sciences, Academia Sinica,
Taipei, Taiwan, Republic of China.
(Received 27 August 1995; accepted 17 November 1995 by P. But-let)
Two major fractions, Na#& and Cbu, are shown to contribute into the 1% nuclear magnetic resonance (NMR) spectra of the low-x Na,Ceu (152). The temperature dependencies of the 1% NMR line shape and spin-lattice relaxation rate (T&t show that Na-&u undergoes phase transition from the low-temperature orientationally ordered SC structure into the high-temperature orientationally disordered one at about 330 K. Exact temperature of the phase transition of 339 K is found by the differential scanning calorimetry (DSC) experiment.
Keywords: A. mllerenes, D. phase transitions, E. nuclear resonances
1. Introduction
Considerable interest to sodium containing fullerides is motivated by a number of unique characteristics. For example, Na3C6u is non-superconducting,t?2 and ternary NaflCbu (where M=K, Rb, and Cs) demonstrate superconductivity with anomalously low superconducting transition temperatures.2 A maximal number of the intercalated Na atoms was remarkably increased up to 10 in the host of Ceo remaining a face centered cubic (fee) structure.3 Phase diagram of the Na&o distinguishes from the K, Rb or Cs intercalation fullerides and is still ambiguous. Four discrete Na&o with r=2,3,6, and 10 have been identified.13334 A new single phase Nat.3C60 has recently been reported by Yildirim et al.5 who also suggested a solid-solution behavior for l-3. Absence of superconductivity shows importance of the electronic properties of Na,Cbo. Particularly, the data on the electronic state of Na&o are contradictory. Benning et
*To whom correspondence should be addressed.
ton leave from Department of Thermal Physics, Utbekistan Academy of Sciences, Katartal Str.28, Chilanzar C, Tashkent, 700135, Republic of Uzbekistan.
al.,6 Seta and Evangelisti’ claimed that Na&o is insulating, Gu et al.8 suggested that it is semiconducting, while Wertheim et a1.g concluded that the phase of the same composition Na2C6u is metallic in the bulk and insulating in the surface. Regarding molecular dynamic in Na intercalation fullerides, small ionic radius of Na comparing with K, Rb, or Cs, brings about different orientationally transition behavior. A phase transition from orientationaly disordered fee phase at high temperatures to ordered SC one below 325 K higher than 260 K of the fee+ SC transition in pristine solid C6u1’ has been found in Nat,&ju.5 The fcc-+sc transitions at 299-313 K have been found ah.0 in Na2MC6u. 1 1
In this communication, we concentrate on the low-x Na.$a (x52). By analysis of the l3C nuclear magnetic resonance (NMR) line shape and spin-lattice relaxation rate (rt)-* we show a phase transition at 330 K. Transition near this temperature is confirmed in differential scanning calorimetry @SC) experiment.
2. Experimental
Ceo (of 99.9% purity; natural abundance of 13C isotopes) and NaN3 (of >99?A purity) were used as purchased, respectively, from Material and Electrochemical
822 ORIENTATIONAL PHASE TRANSITION IN NaXC,(n12):‘3C NMR STUDY Vol. 97, No. 10
Research Corporation (Arizona, USA) and from Merck. NaxC&, of nominal x=1 and x=z were prepared by the thermal decomposition of NaNjr2,13 in dynamic vacuum in stainless steel vessel doubly sealed into Pyrex tube.3 Samples was annealed at 350 “C for 2 weeks after reaction. NMR measurements have been performed at 13C frequency (125.7 MHz) on a Bruker MSL 500 spectrometer (11.7 Tesla). The temperature (T-) dependences were measured using about 200 mg of powder sample sealed in Pyrex tube. Room temperature (RT) t3C magic angle spinning (MAS) spectra were taken using 100 mg of powder sample placed into the rotor under argon atmosphere. The applied rfpulse width was 6 ps. A 1% shift of tetramethylsilane (TMS) was used as a reference. 13C nuclear spin-lattice relaxation times 7’1 were measured with the inversion-recovery technique using pulse sequence X-Z-Z/~. The DSC measurements were performed on the TA Instruments 910 Differential Scanning Calorimeter with the heating rate 10 K/mm. The sample was placed into a special sample holder under argon atmosphere in the glove box. The holder was exposed to ambient atmosphere only for a short time necessary to press-in and transport it into the calorimeter, the step which we could not avoid.
3. Results and Discussion
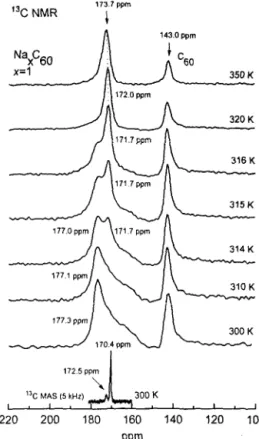
We start with the phase diagram derived from NMR experiment, since the question either the low-x Na.&o makes solid solution or separates into discret phases is still worth. The 1% NMR spectra of the x=1 and x=2 samples taken at different T are presented in Figs. 1 and 2. The spectra indicated that the system essentially separated into undoped Cc0 (143 ppm) and Na intercalation phases characterized by broader resonance in the low fields. The isotropic shift of the broad signal of the doped phase was found in the RT l3C MAS NMR to be 170.4+0.1 ppm (the bottom spectra in Figs. 1,2). We assign the peak at 170.4 ppm in MAS spectra to Na,C,o.? Along with a major line at 170.4 ppm, MAS spectra showed a few minor peaks’ with a very weak intqpsities, sequentially, at 172.5fp.2 ppm in both samples, and at 175.5+0.3 ppm in the later one only (Fig. 1,2). We attribute these minor peaks to negligibly small fractions of the other Na&o (~2) and will not discuss them here. Mixture of discrete phases in the low-x Na,C,o instead of solid-solution behavior have been reported efsewhere.es8 For example, along with Ceo, Benning et aL6 found only Na-&o in the x=0.1 and x=1.9 samples, Seta and Evangelist? reported mixture of Na&o
172 5 ppm 1
220 200 180 160 140 120 100
rm
Fig. 1. t3C NMR spectra of the x=1 Na.&u sample at indicated temperatures, Bottom spectrum is r3C MAS NMR spectrum. Shifts are in ppm with respect to TMS. Dotted line shows slight change in the shift at high T.
and Na&, in the x=1.2 and x=2.6 samples, Gu et al.8 found only Na2C60 in the x=0.9 sample and a mixture of Na&u and Na,+& in the x=2.3 sample. Hence, for our samples, observed separation into two major fractions, C6u and Na$bo was in agreement with Refs.6~8.
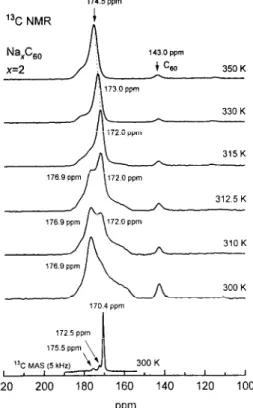
The lineshape of the resonance in l3C NMR spectra associated with the doped phase (Figs.1,2) changed dramatically with 7’ indicating phase transition. Above 330 K, the signal had isotropic lineshape and linewidth comparable with that in undoped Cho (Fig. 1). The shifts in both samples slightly decreased with T, from 173.7 ppm (350 K) to 171.7 ppm (316 K) in the x=1 sample (Fig.1) and from 174.5 ppm (350 K) to 172.0 ppm (315 K) in the x=2 sample (Fig.2). At the same time, constant shift of 143.0 ppm was observed for undoped Ceo. Below 330 K, the resonance gradually broadened and finally transformed at 310 K into the powder pattern typical for the axially symmetric shift tensor when molecule rotates about one of the given axises.t4 An estimate using an isotropic shift
Vol. 97, No. 10 ORIENTATIONAL PHASE TRANSITION IN Na,C,(&2):‘%Z NMR STUDY 823
312 5 K
220 200 180 160 140 120 100
rwm
Fig. 2. 1% NMR spectra of the x=2 Na,Ceu sample at indicated temperatures. Bottom spectrum is t3C MAS NMR spectrum. Shifts are in ppm with respect to TMS. Dotted line shows slight change in the shift at high T.
170.4 ppm derived from the MAS measurement gives qrl57.4 ppm and 0~=176.9 ppm. The shape of broad line did not change thereafter, and no other transformation associating with doped phase was found at lower T.
T-dependences of the 13C nuclear spin-lattice relaxation rates (T&l for x=1 sample are presented in Fig. 3. The recovery curves of the doped phase were meausred on the corresponding signal position of the Fourier transformed spectrum obtained from the free induction decay at the relaxation delay time 2 s. The T1 measurement for &doped Ceu, in turn, done, on the 143 ppm signal position at a very long relaxation delay time 180 s. Data points in both cases have been fitted by single-exponential function in the form M(t)= Mc[l-2exp(-t/T,)] over the range from 220 K to 360 K (in an assumption that Mo=l). The feature at 330 K in the T-dependence of (T&l of the doped phase (Fig.3) coincides with the lineshape transformation occured at the same T (Fig. 1). One may neglect a contribution of the fraction responsible for the minor peak in the MAS spectra, since the magnetization
t1.1, I., I,, ,I,, 111
200 240 280 320 360
Temperature (K)
Fig. 3. The temperature dependence of the 13C spin-lattice relaxation rate (~$1 for the x=1 sample. Arrows show transition points for fractions of Cbu and Na&u.
recovery curves at different T were reliably fitted by single- exponential function and due to a very weak intensity of the peak itself Farthermore, the very fact that the T- dependence of (T&l for the Ceu signal demonstrated clear transition at 260 K, while for Na& did not, and vice versa, transition at 330 K was inherent in the latter phase (Fig. 3), was a direct proof that two nuclear spin systems, of Ceu and Na&o, were decoupled. Very similar T- dependence of the (T&l with an extremum near 330 K was demonstrated by the x=2 sample as well. The line- shape transformation (Figs.1,2) and extremum in T- dependence of the (T&t at about 330 K were resulted by transition in Na$eu, namely. Correspondingly, two transitions, at low and high T, were detected by DSC method. Typical endotherm obtained from x=1 sample is presented in Fig. 4. Peak at 261 K (m=4.8+0.2 J/g) can be immediately attributed to the undoped COO, while peak at 339 K (m=4.8+0.2 J/g) is from Na&o which undoubtedly confirms existance of the phase transition in the doped phase within the same temperature range as seen in NMR experiment: Thus, results presented show that Na&u posseses the high- and low-temperature phases , exhibiting different corresponding NMR lineshapes.
In pristine solid Ceo, spin-lattice relaxation mechanism is provided by the chemical shift anisotropy (CSA) combined with molecular rotation.15,16 For alkali metal fi.rllerides, electron-nuclear interactions contribute into the relaxaiion mechanisms along wit& the molecular motion term.17 In general, (Tt)-t can be given in simple form
824 ORIENTATIONAL PHASE TRANSITION IN Na,C,(x<Z):‘%Z NMR STUDY Vol. 97, No. 10
properly experimental (Tl)-1 data to evaluate ~~ and To
-0.45 - above and below transition point. The principal values of
C Na,C,o
g -0.50 - 4.6?g 4.6 J/g the shift tensor (which can be derived from the spectra at
I I
very low T when motion frozen) and dependence of (T&I
3 -0.55 - on the magnetic field which usually used for the fitting
g were also unknown. These measurements are in progress.
Z
2 -0.60 Howgver, regarding the high-T phase, one can note that
-0.65 - almost equal linewidths of resonances of Na,Ceo and
undoped Cc0 in the static 13C NMR spectra, for example, -0.701 ’ ’ s ’ ’ s s ’ . ’ J
200 240 260 320 360 respectively 4.120.2 ppm and 2.9kO.2 ppm at 350 K
Temperature (K) (Fig.l), brings about conclusion that at high T the C6u mO!eCUleS in Na$eo reorientate in the same manner as in
Fig. 4. The endothermic DSC peaks for the x=1 sample indicating phase transitions, correspondingly, in undoped Ceo (261 K) and NazC6c (339 K).
an orientationally disordered fee lattice of solid Cm. Therefore, the rotational correlation time in Na2Ce0 should be very close to that of pure C60 reported elsewhere. Regarding the low-T phase of Na2Ce0, sufficiently broad line extends over the range of about 20 ppm (Figs, 1,2). It
(q)-’ =(Tl)& +2y~&R~~rc(l+w*r~)-‘, where ‘yn is
is, however, much narrow than that of the frozen solid Ccc where the resonance extends over the range of about 200 the 13C gyromagnetic ratio, r, is rotational correlation
time, o.F@~ is the angular Larmor frequency, 6Bl,, is the local field at the nuclear site. The second term here represents molecular motion. The T-dependent rc is usually expressed in the Arrhenius form rc=rcexp(To/Z). The former term is a relaxation due to the electron-nuclear interaction (ENI), which can involve the contact and dipolar hyperline couplings. 17 For pure contact coupling in metals, the rate is given by Korringa relation
(q )ENI -’ = 4&tr-‘(yn /ye)*K*7’, where tt is Planck’s constant, k is the Boltzmann constant, ‘ye is electronic gyromagnetic ratio, and K is the Knight shit!. If one try to fit the T-dependence of (Tl)-l of Fig.3 using general
equation, then one can find that the term (T1)& by a
ppm.15 An order difference in the linewidth is merely related to the reorientationa! motion of C,ju molecu!e. It has been shown previously in x-ray experiment, that orientationally ordered SC Na,Ceu possesses PUT space group.5 The Pa?? structure was reported to be stable in the l<x<2 compounds up to 325 K above which the structure changes into a fee. Such stability of SC structure in comparison with K and Rb intercalation Cen is associated with small ionic radius of Na+ of 0.98 A bringing about decreasing of the short range repulsive force between Na+ and C@. In this situation the Na-Crju Coulomb interactions in combination with Ceu-Ceu interaction become crucial.5 It has been shown that C,jo mo!ecu!es in Na&c rotate about [Ill] axis at setting angle r#~22.24’.~ An axially symmetric 13C Nh4R lineshape of Na$eu below transition factor of about 4 smaller than, for example, an anologous (Figs.l,2) is in a good agreement with the proposed contribution found for K3C6c.18 That can be qualitatively reorientation of Ceu mo!ecule about one of the four explained by small degree of the electron-nuclear contact possible [I 1 I] directions. Thus, we conclude that a coupling due to decreased electron transfer in Na&jo in transition seen in DSC and from the 1% NMR lineshape comparison with K$eO. That the EN! take place in this (Figs.l,Z) and (Tl)-1 (Fig.3) is a phase transition in case beyond doubt since T1 in Na$eo was much shorter Na2C60 from the high-T orientationally disordered phase than in the fraction of undoped Ccc (at 300 K, 0.28 s into the low-Torientationally ordered SC one.
versus 33.1 s, respectively), and the samples had strong In conclusion, we show that Na,Ca with nominal r=l electron spin resonance signals. Qualitative analysis also and x=2 comprises two main components, Na&o and the showed that the equation for (T&l presented above is no remain undoped Ccc. With temperature increase, Na&-, longer valid in this situation, and a new term responsible transf&ms at 339 K from o<entationally ordered SC for the rotational motion in the high-T phase should be structure into orientationally disordered one. This value is added. The T-range extended only up to 360 K in this close to the sc-+fcc phase transition temperature of 325 K experiment did not allow us to modify the equation and fit for Nal,3Cec.5
Vol. 97, No. 10 ORIENTATIONAL PHASE TRANSITION IN Na,C,(xl2):“C NMR STUDY 825
Acknowledgments - This work was supported by National and Institute of Atomic and Molecular Science for Science Council (NSC) of Republic of China under Grant fellowships. The Instrumentation Center of the NSC is also No. NSC 84-2811-MOOI-046. I.I.Kh is grate&l to NSC acknowledged for the help in DSC measurement.
References 1. 2. 3. 4. 5. 6. 7. 8.
i%?.J. Rosseinsky, D.W. Mur+phy, R.M. Fleming, R. Tycko, A.P. Ramirez, T. Siegrist, G. Dabbagh and S.E. Barret, Nature (London) 356 (1992) 416. K. Tanigaki, I. Hirosawa, T.W. Ebbesen, J. Mizuki, Y. Shimakawa, Y. Kubo, J.S. Tsai and S. Kuroshima, Nature (London) 356 (1992) 419.
T. Yildirim, 0. Zhou, J.E. Fisher, N. Bykovetz, R.A. Strongin, M.A. Cichy, A.B. Smith III, C.L. Lin and R. Jelinek, Nature (London) 360 (1992) 568.
D.W. Murphy, M.J. Rosseinsky, R.M. Fleming, R. Tycko, A.P. Ramirez, R.C. Haddon, T. Siegrist, G. Dabbagh, J.C. Tully, and R.E. Walstedt, J. Phys. Chem. Solids 53 (1992) 1321.
T. Yildirim, J.E. Fischer, A.B. Harris, P.W. Stephens, D. Liu, L. Brard, R.M. Strongin and A.B. Smith III, Phys. Rev. Lett. 71 (1993) 1383.
P.J. Benning, F. Stepniak and J.H. Weaver, Phys. Rev. B 48 (1993) 9086.
M.De Seta and F. Evangelisti, Phys. Rev. B 5 1 (1995) 6852.
C. Gu, F. Stepniak, D.M. Poirier, M.B. Jost, P. J. Benning, Y. Chen, T.R. Ohno, J.L. Martins, J.H. Weaver, J. Fure and R.E. Smalley, Phys. Rev. B 45 (1992) 6348.
9. G.K. Wertheim, D.N.E. Buchanan and J.E. Rowe, Chem. Phys. Lett. 202 (1993) 320.
10. R. Sachidanandam and A.B. Harris, Phys. Rev. Lett. 67 (1991) 1467.
11. K. Tanigaki, I. Hirosawa, T. Manako, J.S. Tsai, J. Mizuki and T.W. Ebbesen, Phys. Rev. B. 49 (1994)
12307.
12. K. Imaeda, 1.1. Khairullin, K.Yakushi, M. Nagata, N. Mizutani, H. Kitagawa and H. Inokuchi, Solid State Commun. 87 (1993) 375.
13. 1.1. Khairullin, K. Imaeda, K. Yak&i and H. Inokuchi, Physica C 23 1 (1994) 26.
14. M. Mehring, Principles of High Resolutiott hMR itr Sbliuk. 2nd. ed. (Springer-Verlag, New York, 1983), p. 52.
15. R. Tycko, G. Dabbagh, R.M. Fleming, R.C. Haddon, A.V. Makhija, and S.M. Zahurak, Phys. Rev. Lett. 67 (1991) 1886.
16. Y. Maniwa, K. Mizoguchi, K. Kume, K. Kikuchi, I. Ikemoto, S. Suzuki, and Y. Achiba, Solid State Commun. 80 (1991) 609.
17. R. Tycko, J. Chem. Solids, 54 (1993) 1713.
18. Y. Yoshinari, H. Alloul, G. Kriza, and K. Holczer, Phys. Rev. Lett. 71 (1993) 2413.