國立交通大學
材料科學與工程學研究所
碩士論文
新式含接枝型聚苯乙烯起孔洞劑之甲基
矽氧烷低介電材料製成及結構特性分析
Novel Porous Low-k Materials MSQ by
Grafting PS-Siloxane porogen: Synthesis,
Structure, and Pore Morphology
研 究 生: 邱詩雅
指導教授:呂志鵬 博士
新式含接枝型聚苯乙烯起孔洞劑之甲基矽氧烷低介電材料製成及結
構特性分析
Novel Porous Low-k MSQ by Grafting PS-Siloxane porogen: Synthesis, Pore Morphology and Properties
研 究 生:邱詩雅 Student:Shih-ya Chiu
指導教授:呂志鵬 教授 Advisor:Dr. Jihperng Leu
國立交通大學
材料科學與工程學系
碩士論文
A Thesis
Submitted to Department of Materials Science and Engineering
College of Engineering
National Chiao Tung University
in Partial Fulfillment of the Requirements
for the Degree of
Master
in
Materials Science and Engineering
July 2009
新式含接枝型聚苯乙烯起孔洞劑之甲基矽氧烷低介電材料製成及結構特性分析 新式甲基矽氧烷接枝聚苯乙烯低介電材料製成及結構特性分析 研究生:邱詩雅 指導教授:呂志鵬 博士 國立交通大學材料科學與工程學系碩士班 摘 要 本研究以 Solid-FirstTM方法製備多孔性低介電薄膜: 以旋塗性質良好的甲基 矽氧烷(MSQ,methylsilsesquioxane)為基材,並以原子轉移自由基聚合反應 (ATRP)合成的含有矽氧烷的聚苯乙烯(PS-siloxane)作為高溫起孔洞劑 (porogen),並以接枝(Graft)方式將兩著結合在一起,即:甲基矽氧烷接枝聚 苯乙烯。而起孔洞劑在金屬層完成後才會被燒除,解決了初成膜(as-deposited) 的薄膜中因孔洞引起的問題。本文首先討論自行合成的聚苯乙烯、甲基矽氧烷、 以及甲基矽氧烷接枝聚苯乙烯的化學結構、基本性質,以及起始劑的含量對聚苯 乙烯分子量的影響;隨後觀察孔洞大小及其影響因子,例如聚苯乙烯的分子量以 及溶劑的影響;最後比較接枝形成薄膜和混掺(Hybrid)薄膜的差異。聚苯乙烯、 甲基矽氧烷、以及甲基矽氧烷接枝聚苯乙烯的化學結構將由超導核磁共振光譜儀 (Nuclear Magnetic Resonance Spectrometer,NMR)、紅外線光譜儀 (FTIR)、以及 熱重分析儀 (TGA)所鑑定。聚苯乙烯、以及甲基矽氧烷接枝聚苯乙烯的熱性質 可由差示熱分析儀 (DSC) 和熱重分析儀 (TGA) 取得。並用 X 光反射儀計算多 孔性介電薄膜的孔隙率。最後使用掃描式電子顯微鏡觀察各式薄膜的孔洞大小及 分布。
含量越多,則聚苯乙烯的分子量越小,進而使得薄膜形成後有較小的孔洞。併且 發現,當選用和聚苯乙烯溶解係數差異較大的溶液做為溶劑時,聚苯乙烯的長鏈 段會被束縛,而使得最後的薄膜有較小的孔洞。 為了證明接枝方式所製程的薄膜擁有較小的孔洞以及較佳的孔洞分布,因 此,在一樣的條件下,將市售的聚苯乙烯混掺加入甲基矽氧烷溶液中,薄膜製程 後可以發現會有明顯的孔洞聚集,由此可以得知,由接枝方式所製程的薄膜有效 的改善了孔洞聚集的現象。 總合實驗結果可知,以接枝方式製成的薄膜其孔洞大小及分布能被有效的控 制,而沒有聚集的現象產生,而孔洞大小亦受聚苯乙烯的分子量大小以及溶劑的 總類所控制。綜合以上,可以確定接枝方式所製程的薄膜可被用在 ILD 層作為 製作Solid-FirstTM材料更好的方式。
Novel Porous Low-k MSQ by Grafting PS-Siloxane porogen: Synthesis, Pore Morphology and Properties
Student: Shih-Ya Chiu Advisor: Dr. Jihperng Leu
Department of Materials Science and Engineering National Chiao Tung University
ABSTRACT
This study takes a novel approach to graft a functionalized porogen onto the backbone of low-k precursor, which is further crosslinked into a low-k matrix with well dispersed and discrete porogens to achieve excellent control of pore size and pore distribution. In particular, polystyrene (PS) is chosen as the high-temperature porogen because of its high decomposition temperature, while a widely used spin-on methylsilsesquioxane (MSQ) with k ~2.9 is employed as the low k matrix in the Solid-FirstTM scheme. The high temperature porogen would be burned out after a metal/dielectric layer is completed such that the reliability issues such as insufficient barrier coverage encountered in the integration of as-deposited porous dielectrics and poor pore size/distribution could be circumvented. This study starts with the synthesis and characterization of PS-Siloxane, MSQ, and MSQ-g-PS, and then examines the relationship between the content of initiator and PS-Siloxane molecular weight. Moreover, factors for controlling the pore size such as PS molecular weight and solvent effect are investigated. Finally, we compare the pore morphology between the PS/MSQ hybrid film and MSQ-g-PS film to examine any porogen aggregation issue.
The scheme of PS-Siloxane, MSQ, and MSQ-g-PS structures are examined by
1H-NMR, 29Si-NMR, and Fourier-transform infrared spectroscopy (FTIR). Thermal
properties such as decomposition temperature and glass transition temperature are measured by DSC and thermal gravimetric analyses (TGA). Moreover, porosity was characterized by X-ray reflectivity (XRR), while pore size was examined by scanning electron microscope (SEM).
PS-Siloxane has been synthesized by atom transfer radical polymerization (ATRP) method. It is found that PS molecular weight decreases with decreasing amount of initiator. Lower PS molecular weight (80,000 g/mole-5,000 g/mole) leads to smaller pore size in the range of 160-90 nm. Besides, adding poor solvent into MSQ-g-PS solution can limit the extending of PS long-chain, and thus reduce pore size. Compared to the MSQ/PS hybrid film, well dispersed and discrete pores have been found in MSQ-g-PS film without aggregation, which presumably enhances the mechanical strength of porous low-k films and other properties for application. Therefore, MSQ-g-PS is a novel and excellent material to be used as an ILD in Solid-FirstTM scheme.
Acknowledgements
很開心在碩士班的兩年可以在呂志鵬老師實驗室,實驗室的大家就像是一家 人一樣,一起歡笑,一起努力,也很感謝老師兩年來的指導,讓我對如何研究, 科技寫作,有更多的認識,也學到更多。 在此,我要謝謝國原學長這兩年來的指導,不僅是在學業,對於做人處事, 以及看事情的角度更是影響我很多,跟學長聊天總是讓我能有很多收穫;謝謝幸 鈴學姊幫了我好大的一個忙,如果沒有學姐,我應該還在角落掉眼淚吧;謝謝車 牧龍,這兩年我從車胖身上學了很多,應對進退,以及做實驗前該先準備好的功 課;還要謝謝我親愛的同學 Shindy 跟張弟,在我對材料專業領域上有不懂的地 方,總是能詳細的幫我解答,最重要的事,跟他們在一起,會讓人有想往上進步 的動力,也超級喜歡跟他們一起出去玩樂的。最後,謝謝大龜,泰印學長;阿義, 柏村,弘恩,王智,怡臻,少農,欣源哥,狗蛋,罐頭宇,恰吉,真是的很貼心 的學長姐們,不論什麼問題,他們總有專業,或是很有趣的意見,能夠有他們真 是太好了;最後,還有琬婷,小白,伯政,謝謝學弟妹們總是要聽我在那邊說一 些無聊的話,或是欺負他們,真是一群脾氣很好的學弟妹。最後,我要謝謝的我 家人,有他們的支持,我才能一路無憂的唸到這裡,謝謝他們對我的付出。 謝謝國科會No. 96-2221-E-009-216 的計畫,讓我在這兩年內,沒有經濟的 困難,還有國家同步輻射研究中心 (NSRRC) 的光束線支援,協助我完成我的實 驗。Contents
摘 要... I
ABSTRACT...III
Acknowledgements...V Contents ...VI Table Captions ...VIII Figure Captions...IX
Chapter 1 Introduction ...1
Chapter 2 Literature Review...4
2.1 Definition of low dielectric constant materials...7
2.1.1 Dielectric constant ...7
2.1.2 Polarization of dielectric material...8
2.2 Requirements of low k materials for ILD applications...11
2.3 Porous low k materials...12
2.4 High-temperature porogen...15
2.5 Challenge of porous low k integration...17
2.5.1 Mechanical strength ...17
2.5.2 Porosity versus modulus ...18
2.5.3 Moisture uptake ...20
2.5.4 Cu diffusion ...21
2.6 Living radical polymerization...23
2.6.1 Atom Transfer Radical Polymerization (ATRP) ...24
2.6.2 Stable Free-Radical Polymerization (SFRP)...26
2.6.3 Radical Addition-Fragmentation Transfer (RAFT) ...27
2.7 Cross-linking of siloxane ...28
2.8 Characterization Methodologies ...29
2.8.1 Nuclear Magnetic Resonance Spectroscopy (NMR) ...29
2.8.2 Gel Permeation Chromatography (GPC) ...30
2.8.3 Different Scanning Calorimetry (DSC) ...31
2.8.4 Thermal Gravimetric Analysis (TGA) ...32
2.8.5 Fourier-transform infrared spectroscopy (FTIR) ...33
2.8.6 Scanning Electron Microscope (SEM) ...34
2.8.7 X-ray reflectivity (XRR)...35
3.1.3 Solvent ...39
3.1.4 Acid...40
3.2 Preparation ...41
3.2.1 Purification of styrene (St) and CuBr(I) ...41
3.2.2 Synthesis of α-siloxane-polystyrene (PS-siloxane) ...41
3.2.3 Synthesis of MSQ from MTMS using sol-gel ...42
3.2.4 Grafting PS onto MSQ through siloxane-PS ...42
3.2.5 Preparation of porous low-k film...42
3.2.6 Solvent effect on the pore size of porous low-k films ...42
3.3 Experimental techniques...43
3.3.1 Nuclear Magnetic Resonance Spectroscopy (NMR) ...43
3.3.2 Gel Permeation Chromatography (GPC) ...43
3.3.3 Different Scanning Calorimetry (DSC) ...43
3.3.4 Thermal Gravimetric Analyses (TGA) ...43
3.3.5 Fourier-transform infrared spectroscopy (FTIR) ...44
3.3.6 Scanning Electron Microscope (SEM) ...44
3.3.7 X-ray reflectivity (XRR)...44
Chapter 4 Results and Discussion...45
4.1 Synthesis and properties of PS-siloxane ...45
4.1.1 Synthesis of PS-siloxane...45
4.1.2 Thermal properties of PS-Siloxane...49
4.2 Synthesis of MSQ ...51
4.3 Grafting PS-siloxane onto MSQ ...53
4.4 Pore morphology of MSQ-g-PS porous low k film ...59
4.4.1 The relationship between molecular weight and pore size in MSQ-g-PS...59
4.4.2 Solvent effect ...63
4.4.3 Porosity ...70
4.5 Comparison between MSO-g-PS and MSQ/PS hybrid porous low k films ..72
Chapter 5 Conclusion...74
Table Captions
Table 2. 1 Requirements of low k materials for ILD application ...11
Table 2. 2 Opening temperatures of key backend processing steps...16
Table 3. 1 The recipe of ATRP reaction for various PS molecular weight…………...42
Table 4. 1Primary absorption peak position and their assignment………...52
Table 4. 2 peak assignment of 29Si-NMR spectra...58
Table 4. 3 Parameters of R=a(M)b for various solvents...68
Table 4. 4 Solubility parameters for various solvents...69
Figure Captions
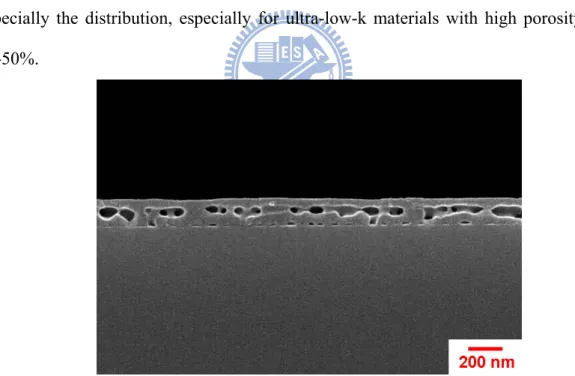
Figure 1. 1 Interconnect pore and pore distribution due to aggregation in
MSQ/PS-b-P4VP hybrid film ...2
Figure 2. 1Structures of multilayer interconnect (a) Al metallization, and (b) Cu metallization………..4
Figure 2. 2 Schematic diagram of a typical interconnect element...5
Figure 2. 3 Relationship between generation node and RC delay in gate and interconnect for Al/SiO2 and Cu/low k ...6
Figure 2. 4 Capacitor with dielectric...8
Figure 2. 5 Electronic polarization...9
Figure 2. 6 Ionic polarization...9
Figure 2. 7 Orientation polarization...10
Figure 2. 8 Relationship between dielectric constant and applied electric fieldfrequency ...11
Figure 2. 9 Procedure of sol-gel...13
Figure 2. 10 Mechanism of NSC method ...14
Figure 2. 11 General processing scheme to produce nanoporous structure using templating methed...15
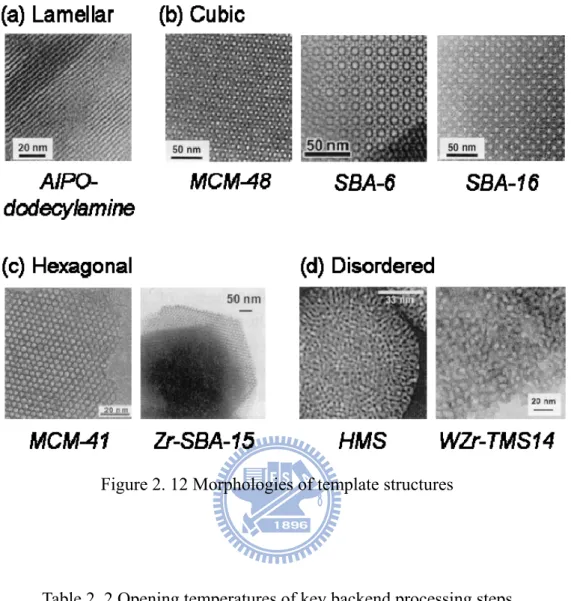
Figure 2. 12 Morphologies of template structures ...16
Figure 2. 13 Mprphology of worm pore and interconnect pore...17
Figure 2. 14 Delamination during CMP process...18
Figure 2. 15 Porosity versus modulus...19
Figure 2. 16 Pore size verse mechanical strength with the same porosity...20
Figure 2. 17 Damage of dielectric layer by solvent ...21
Figure 2. 19 Solid-FirstTM scheme ...23
Figure 2. 20 Mechanism of living radical polymerization (LRP)...24
Figure 2. 21 Mechanism of ATRP...25
Figure 2. 22 Block copolymer mechanism of ATRP ...26
Figure 2. 23 the thermal decomposition of an alkoxyamine into a reactive radical and a stable radical...26
Figure 2. 24 Mechanism of SERP...27
Figure 2. 25 Mechanism of RAFT...27
Figure 2. 26 Condensation reaction in the siloxane cross-linking ...28
Figure 2. 27 Sol gel MTMS to MSQ ...29
Figure 2. 28 Diagram of GPC ...31
Figure 2. 29 Schematic of a heat flux DSC cell...32
Figure 2. 30 Components of a thermal balance: A: beam, B: sample cup and holder, C: counterweight, D: lamp and photodiodes, E: coil, F: magnet, G: control amplifier, H: tare calculator, I: amplifier, J: recorder. ...33
Figure 2. 31 Schematic diagram of a FIB/SEM system...35
Figure 2. 32 Kieddig interference fringe...36
Figure 4. 1 Synthesis scheme of siloxane-polystyrene………46
Figure 4. 2 1H-NMR spectrum of siloxane-PS ...46
Figure 4. 3 PS molecular weight as a function of initiator weight loading ...48
Figure 4. 4 TGA of PS-Siloxane ...50
Figure 4.5 DSC curve of PS-siloxane...51
Figure 4. 6 The schematic of MSQ synthesis from MTMS monomers...52
Figure 4. 9 TGA data of MSQ and PMS-g-PS...55
Figure 4. 10 Derivative of TGA data of MSQ ...55
Figure 4. 11 Derivative of TGA data of MSQ-g-PS ...56
Figure 4. 12 IR spectra of MSQ-g-PS...57
Figure 4. 13 TDS of CH4 for where CH4 evolution data of MSQ ...57
Figure 4. 14 29Si-NMR of MSQ-g-PS...58
Figure 4. 15 SEM photograph of MSQ-g-PS porous low k film (MW of PS: 80,000 g/mole). ...60
Figure 4. 16 SEM photograph of MSQ-g-PS porous low k film (MW of PS:10,000 g/mole). ...61
Figure 4. 17 SEM photograph of MSQ-g-PS porous low k film (MW of PS: 5,000 g/mole). ...61
Figure 4. 18 SEM of MSQ-g-PS low k films with various MWs: (a) 80,000 g/mole (b) 10,000 g/mole (c) 5,000 g/mole...62
Figure 4. 19 Pore size as a function of the square root of PS molecular weight ...62
Figure 4. 20 PS Mw: 80,000 g/mole, solvent was Ethanol/THF ...64
Figure 4. 21 PS Mw : 80,000 g/mole, solvent was n-Hexane/THF ...64
Figure 4. 22 PS Mw: 10,000 g/mole, solvent was Ethanol/THF ...65
Figure 4. 23 PS Mw: 10,000 g/mole, solvent was n-Hexane/THF ...65
Figure 4. 24 PS Mw: 5,000 g/mole, solvent was Ethanol/THF ...66
Figure 4. 25 PS Mw : 5,000 g/mole, solvent was n-Hexane/THF ...66
Figure 4. 26 Summary of pore morphology and pore size ...67
Figure 4. 27 Solvent effect of pore size ...68
Figure 4. 28 The mechanism of PS activity in good solvent or in poor solvent...70
Figure 4. 29 Morphology of MSQ/PS hybrid porous low k film ...73 Figure 4. 30 Morphology of (a)MSQ/PS hybrid porous low k film (PS M :90,000
Chapter 1 Introduction
To overcome the increase of RC delay due to the scaling of integrated circuit devices [1], scientists and engineers developed two major solutions for the backend interconnect: first was copper metallization using a dual damascene architechure, and the second was low dielectric constant (low k) materials [2] such as carbon-doped oxide or SiLKTM [3] (k~2.6-3.0) in the past decade. For ultra-low k materials (k<2.5) in 45nm node and beyond, pores at various porosity have been incorporated into the dielectric matrix to reduce k-value. Most of ultra-low k films were made by introducing templating agent [4] into silica structure using spin-on solution coating or plasma-enhanced chemical vapor deposition (PE-CVD). The templating agent or pore generator (porogen) was then removed during the deposition or subsequent thermal process. However, due to large pore size/distribution or interconnected pores, porous low k films faced some critical issues such as (1) low mechanical strength leading to delamination or cracks after chemical-mechanical polish (CMP) or packaging and (2) poor barrier/dielectric reliability due to non-continuous side-wall coverage of barrier. In 2003, Shipley Inc. introduced a solution, “Solid-FirstTM” scheme [5] to circumvent these issues. Solid-FirstTM uses a high-temperature porogen and new integration scheme, which defers the formation of porous dielectric, i.e. the removal of high-temperature porogen after a metal/low-k layer is completed.
The common method for preparing porous low k films based on the Solid-FirstTM scheme is to mix the high-temperature porogen into a silica-containing matrix such as spin-on glass in a solution, then spin-coat the matrix/porogen solution onto a substrate, which is followed by a cure step preferably at ≤300 oC to form a crosslinked dielectric with high-temperature porogen as the starting interlayer dielectric (ILD) for
subsequent dual damascene integration flow. However, serious reliability concerns such as poor size distribution and/or interconnected pores, as illustrated in Fig. 1.1 [6], results were from enhanced diffusion and porogen aggregation [7] during the cure step [ 8 ]. For examples, such large pore size and interconnected pores may detrimentally degrade the ultra-low-k film’s mechanical strength [9] such that it cannot meet the minimum requirements (~4 GPa) for applications in the copper/low-k backend interconnect. For matrix/high-temperature porogen hybrid system (MSQ/polystyrene), recent efforts such as fast heating rate in the cure step or controlling the zeta-potential of polystyrene porogen by pH values or surfactants in the solution have successfully reduce the pore sizes and distribution down to 100 nm [10,11]. Yet, there is still room for improvement in terms of the pore size and especially the distribution, especially for ultra-low-k materials with high porosity > 40-50%.
Figure 1. 1 Interconnect pore and pore distribution due to aggregation in MSQ/PS-b-P4VP hybrid film
porogen during the cure process, this study takes a novel approach by grafting a functionalized porogen onto the backbone of low-k precursor, which is further crosslinked into a low-k matrix with well dispersed and discrete porogen to achieve excellent control of pore size and pore distribution. In particular, polystyrene (PS) is chosen as the high-temperature porogen because of its high decomposition temperature, while a widely used spin-on methylsilsesquioxane (MSQ) with k ~2.9 is employed as the matrix. However, there are a couple of problems be fixed first: (1) polystyrene does not have the functional group as the grafting agent for this study, and (2) commencial MSQ does not dissolve in THF. As a result, polystyrene (PS) with a –CH2-CH(Ph)-C3H6-Si(OCH3)3 siloxane functional group, which can be grafted
onto MSQ precurosor as a templating porogen, are first synthesized in this study. Furthermore, MSQ is freshly prepared from methyl–trimethoxy silane (MTMS) monomer by sol-gel method, which can be then dissolved in THF. The as-prepared PS-grafted MSQ is named MSQ-g-PS for simplicity thought the nest of this thesis.
In this thesis, the synthesis and characterization of PS-siloxane, MSQ and MSQ-g-PS will be first carried out. The relationship between the content of initiator and PS molecular weight in PS-siloxane will be further investigated. The structure properties of porous low k film based on MSQ-g-PS, such as pore size, porosity, and morphology will be examined. The factors for controlling pore size such as PS molecular weight and solvent effect are also studied. Finally, comparison between the PS/MSQ hybrid film and the MSQ-g-PS film is made to examine any improvement in pore size/distribution.
This thesis included five chapters: Chapter 1 Introduction, Chapter 2 Literature Review, Chapter 3 Experimental, Chapter 4 Results and Discussion, and Chapter 5 Conclusion.
Chapter 2 Literature Review
For past 45 years, integrated circuit (IC) dimensions continue shrinking towards small size according to Moore’s Law [12]. Modern integrated circuit devices contain millions of transistor electrically connected by millions of wires fabricated on the top of transistors. The wires, or “interconnect”, transform transistors into a functioning device by local, semi-global and global wire layout. In 65 nm node, device has as many as 9-10 layers of interconnect which was so called multilayer interconnect. Typically, multilayer interconnect was fabricated using Al or Cu as the conductor and SiO2 as the dielectric. Figure 2.1 [13] shows structures of interconnect (a) Al
When IC dimensions continue to decrease, RC delay, crosstalk noise and power dissipation of the interconnect structure would become problems for ultra-large-scale integration (ULSI) of IC. Figure 2.2 shows a schematic diagram of a typical element in multilevel interconnects, where P represents line pitch, W the metal line width, S the spacing between line to line, T the thickness of metal line.
Figure 2. 2 Schematic diagram of a typical interconnect element.
RC delay can be calculated using a simple first-order model as Equation 2.1
⎟⎟ ⎠ ⎞ ⎜⎜ ⎝ ⎛ + =2 0 4 22 22 T L P L RC
ρκε
(2. 1) where ρ: metal resistivelyε0: the vacuum permittivity
κ: the relative dielectric constant of dielectrics L: the length of the metal line
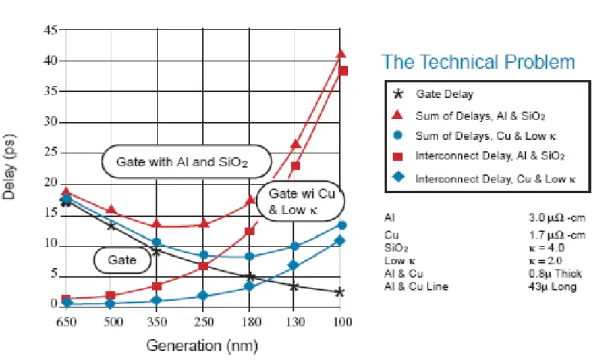
There are two sets of parameters could determine RC delay such as (1) material properties including the metal resistivity ρ and the dielectric constant κ, and (2) interconnect dimensions. Figure 2.3 shows relationship between generation node and RC delay in gat and interconnect for Al/SiO2 and Cu/low k [14]. As IC scaling
proceeds beyond the 250 nm node, the interconnect delay will exceed the gate delay [15].
Figure 2. 3 Relationship between generation node and RC delay in gate and interconnect for Al/SiO2 and Cu/low k
In order to solve RC delay issues, new materials with lower resistivity and dielectric constant have been developed and introduced to semiconductor widely. Cu
κ of about 3.0 [17].
The early adoption of low k preferred the modification of silicon oxide such as fluorinated silicate glass (FSG) with κ of about 3.5~3.7, then carbon-doped oxide with κ of about 2.5~3.2. κ value of dense carbon-doped oxide has a lower limit at 2.5-2.6 [18]. In addition to integration of porous material through many different backend processes models, the most important task is to design the low k material in the matrix and porogen to alleviate the subsequence relatively or process issue. However, porous low k may encounter reliability issues such as (1) low mechanical strength, delamination and cracks during CMP [19], and (2) Un-continue barrier coverage at the trench side-wall [20].
For porous low k material, it is desirable to have small pores, tight distribution, in well dispersed and closed-cell form at the same porosity. A study of how to solve issues of porous low k materials encounter is the most important task in the backend technology of 45 nm node and beyond. There, in corporation of porosity to achieve low k material with κ < 2.5 become necessary [21].
2.1 Definition of low dielectric constant materials
2.1.1 Dielectric constant
For a parallel-plate capacitor with dielectric as shown in Figure 2.4, the capacitance C0 of a capacitor can be expressed by Equation 2.2, where Q represent
charge and V represents voltage, A is electrode area of a parallel-plate, d is distance between the parallel-plate, ε is the permittivity of substance, and ε0 is vacuum
permittivity (8.85*10-12 F/m). d A d A V Q C0 = =ε =κε0 (2. 2)
Figure 2. 4 Capacitor with dielectric
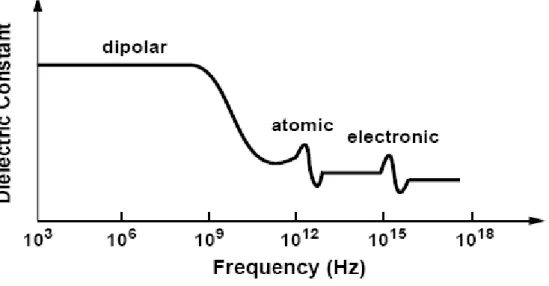
Dielectric constant (κ) is a frequency dependent and composed of electronic, atomic, and dipole orientational contributions [22,23].
2.1.2 Polarization of dielectric material
When a dielectric is placed between charged parallel-plate, the polarization of the medium produces an electric field opposing the field of the charges on the plate. The electric field would induce an electric dipole, and redistribution of positive and negative charges was called polarization. Material which contains polar molecules wouldill be in random orientations when no electric field is applied. The dipole moment of the polar material would be polarized when electric field is applied. The dipole moment in unit volume represented the degree of polarization called polarization strength.
There are four styles of polarization such as electronic polarization, ionic polarization, orientation polarization, and space charge [24]. A neutral atom has
field was called electronic as shown in Figure 2.5. Moreover, atomic polarization is defined when the electronic cloud is deformed under the force of the applied field, so the negative and positive charge are formed. Atomic polarization was also called Electronic polarization.
Figure 2. 5 Electronic polarization
Positive and negative ions in ionic crystals such as NaCl were displaced when electric field was applied. The phenomenon was called ionic polarization as shown in Figure 2.6.
A material was with built-in dipoles which were independent of each other. After electric field was applied, and only induced a little bit of average orientation in field direction. This phenomenon so call orientation polarization as shown in Figure 2.7.
Figure 2. 7 Orientation polarization
Figure 2.8 shows relationship between the dielectric properties of materials and operation frequency. The frequency which was contributed by electronic, atomic and orientation polarization related with dielectric constant [25]. Electronic polarization was the primary contribution at the optical frequency, because atomic and orientation can not respond so fast.
Figure 2. 8 Relationship between dielectric constant and applied electric field frequency
2.2 Requirements of low k materials for ILD applications
Materials which were used in ILD needed not only decreased dielectric constant but also excellent mechanical strength, low moisture, and thermal stability etc. Table 2.1 [26] summarized the requirements of low k materials which were applied in ILD.
Table 2. 1 Requirements of low k materials for ILD application
Electrical Chemical Mechanical Thermal
Low dielectric constant Isotropic Low dissipation Low leakage current Low charge trapping
High electric filed strength
Good chemical resistance Low moisture uptake <1% Etch rate and selectivity Low gas permeability No metal corrosion Thickness uniformity Good adhesion Residual stress <100Mpa Low shrinkage Crack resistance Tensile modulus High thermal stability CTE <50 ppm/oC Low thermal shrinkage High thermal conductivity
2.3 Porous low k materials
Recently, low k material which had dielectric constant at 2.6~2.9 was widely used in 0.65 μm technology node. However, future technology nodes would need lower dielectric constant. Porous materials was announced to decrease dielectric constant, which incorporated air (κ=1) into matrix. Porosity can be affected by the volume fraction of air which related with pore size, shape, and distribution. There were some methods to manufacture porous low k material such as sol-gel method, nano-clustering method, and templating method.
(1) Sol-gel method
Inorganic glasses were modified to become polysiloxane [27] using sol-gel method. Sol-gel procedure involved (1) hydrolyzing silicon alkoxides, and (2) copolymerizing the hydrolyzate with a hydroxyl-terminated polysiloxane. Figure 2.9 shows the procedure of sol-gel [28]. In porous low k material, colloids were dispersed in solvent, and then the reaction would form 3-dimension network structure. During drying process, the liquid was replaced with air. Pore size was un-controllable using sol-gel method.
Time condensation colloids 3-D sturcture dry final product
a
b
c
Figure 2. 9 Procedure of sol-gel
(2) Nano-clustering silica (NCS) method
NSC mixed silica source monomer and particular compounds such as amine or PTAOH in a solvent. The silica source monomers would hydrolyze and get around with compounds, and make small size clusters. Cluster would polymerize in thermal heating process. Silica clusters were cured to keep pore situated in the silica cluster. Mesopore among the silica clusters were formed. Figure 2.10 [29] shows the mechanism of NSC method.
Figure 2. 10 Mechanism of NSC method
(3) Template method
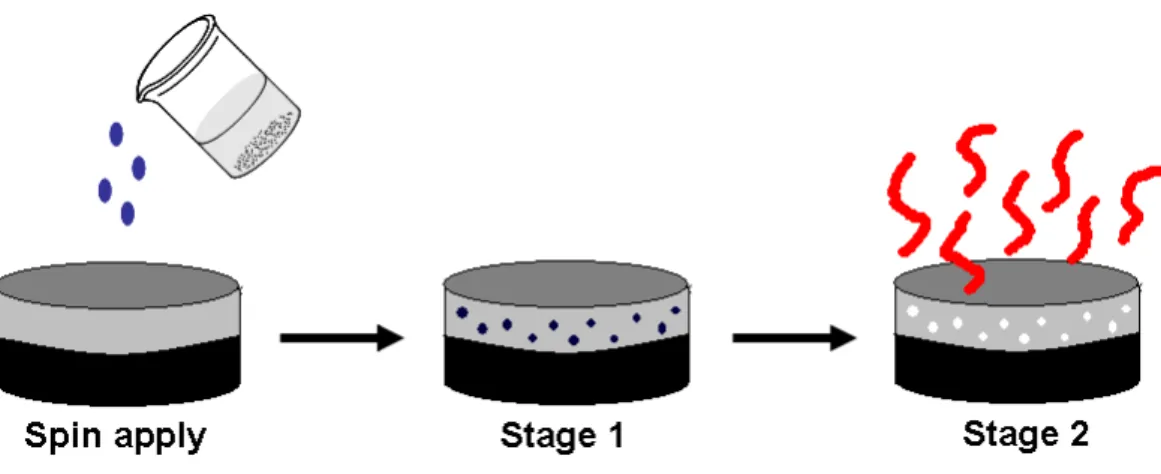
Templated polymerization has been used in monomeric and polymeric surfactants [30]. Porous structure can be quite regulated in silica phase. The templated polymerization was affect on the continuous formation of a variety of self-assembled structures and strong interactions between these structures and the vitrifying medium. Surfactants were removed in curing process, and would have porous structure in silica phase. There were three steps of templated polymerization: (1) synthesis, (2) drying, (3) template removal. Figure 2.11 [31] shows the general processing scheme to produce nanoporous structure, where stage 1 was templated resin polymerization, and stage 2 was porogen decomposition.
Figure 2. 11 General processing scheme to produce nanoporous structure using templating methed
2.4 High-temperature porogen
Template has been used for a long time, and the microstructure of template materials could be disorder [32] and order which included lamellar [33], cubic [34] or hexagonal [35] structure as shown in Figure 2.12. The interaction of surfactant (S) and inorganic matrix (I) would cause the difference of structure. The interaction include electrostatic [36], hydrogen bonding [37], hydrogen bonding/ electrostatic [38], covalent [39]. However, the surfactant (ammonium) and matrix (silica) were toxic, expensive, and impractical for used in IC industries. Table 2.2 shows the upper opening temperature of the backend processing step. Therefore, the decomposition temperature of high-temperature porogen should higher than 300 °C. Order templates have been studied for a long time, but disorder templates which were controllable and easy making, have been widely used in the preparation of low k materials. The conventional method of making spin-on during the cure low k material was hybrid porogen into matrix. However, porogen would aggregate and to mix porogen into matrix to form a hybrid system to pore aggregation on the thin film. In order to solve this problem, “Grafting the porogen onto matrix” was proposed. The grafting method for functionalized porogen will be reviewed in the next section 2.6.
Figure 2. 12 Morphologies of template structures
Table 2. 2 Opening temperatures of key backend processing steps Processing step Upper limit (°C) Solid-FirstTM (°C)
ILD deposition or cure 400 250~300
Lithography < 160 < 160
Plasma etching < 150 30 (RIE N2H2)
Wet clean <100 < 100
Barrier/seed deposition < 250 < 100
Electroplating < 70 < 100
Annealing (Cu or low-k) 300 150
CMP R.T. R.T.
2.5 Challenge of porous low k integration
Porous low k materials have lower dielectric constant than traditional silicon dioxide. However, there were some disadvantages of porous low k film such as weaker mechanical properties and chemical resistance.
2.5.1 Mechanical strength
Pore aggregation caused low mechanical strength, and led to dielectric layer can not survive under chemical mechanical polish (CMP) process [40]. Figure 2.13 shows the worm pore which was caused by pore aggregated [6], and Figure 2.14 shows the delamination during CMP process [10].
Figure 2. 14 Delamination during CMP process
2.5.2 Porosity versus modulus
Modulus decreased rapidly with increasing porosity [ 41 ] as described by Equation 2.3 [42]. These values were similar to those measured for other porous materials with irregularly shaped pores. This was reasonable because the nature of the phase-separation mechanism used to generate pores in materials provides isotropic porous structures with random morphology [ 43 , 44 ]. Figure 2.15 shows the relationship between porosity and modulus [45].
(
)
nf
E
aP
E
=
01
−
(2. 3)Where
Ef = modulus of thin film
Figure 2. 15 Porosity versus modulus
Figure 2.16 shows the unpublished data which produced by NIP Lab in NCTU [11]. In the same porosity condition, thin film which has smaller pore would have higher mechanical strength. Large pore decreased strength of thin film. For highly porous low k films, it is desirable to have small pore size at even high porosity in order to retain a better mechanical strength.
Figure 2. 16 Pore size verse mechanical strength with the same porosity
2.5.3 Moisture uptake
Porous low k may absorb moisture in wet etching, wet cleaning, or resist cleaning processing steps, and lead to dielectric constant increase (κwater~80). Besides,
low k film could be destroyed by solvent in manufacture process if its chemical resistance is poor. Figure 2.17 shows the damage of dielectric layer by solvent [10].
Figure 2. 17 Damage of dielectric layer by solvent
2.5.4 Cu diffusion
In the etching process, pore on the sidewall would be etched and become open pore, which may result in non-continuous sidewall. The barrier can not protect low k layer completely. Copper may diffuse into low k layer and destroyed the function of low k layer [46].This damage would increase leakage and decrease breakdown voltage, and lead to circuit failure. Figure 2.18 shows copper diffused into dielectric layer.
Figure 2. 18 Copper deposited into dielectric layer
In order to solve these problems, Shipey Company announced a Solid-FirstTM scheme which can eliminate the problem of non-continuous barrier coverage and ensured dielectric layer can survive under CMP process. The procedure of Solid-FirstTM scheme included (1) high-temperature porogen and silicon matrix were deposited, (2) patterning steps such as lithography, etch, and clean, (3) metallization and CMP, and (4) removed high-temperature porogen at 300~400 °C. The decomposition temperature of high-temperature porogen should higher than 300 °C, while the common temperature of backend processing under than 300 °C. Figure 2.19 shows the processing step in Solid-FirstTM scheme.
Figure 2. 19 Solid-FirstTM scheme
2.6 Living radical polymerization
General ConsiderationsConventional chain polymerization systems, both of radical and ionic would break molecule chains. In contrast chain polymerization without chain-breaking reactions is living radical polymerization (LRP). LRP allowed the synthesis of block copolymer. The situation was very different for conventional (nonliving) radical polymerization since the lifetime of radicals was very short [47]. Compared with ionic polymerization, LRP have good commercial potential for materials synthesis. Figure 2.20 shows the mechanism of living radical polymerization, where RZ is initiator and M is monomer.
R-Z
R
+
Z
Reactive radical Stable radical MRM
RMn-Z
Propagating radical Dormant specied Bimolecular terminationFigure 2. 20 Mechanism of living radical polymerization (LRP)
In general living radical polymerization included atom-transfer radical polymerization (ATRP), stable free-radical polymerization (SFRP), and reversible addition-fragmentation transfer (RAFT). Both of ATRP and SFRP proceed with reversible termination, but RAFT proceed with reversible chain transfer.
2.6.1 Atom Transfer Radical Polymerization (ATRP)
Atom-transfer radical polymerization (ATRP) involved an organic halide undergoing a reversible redox process catalyzed by a transition metal compound such as cuprous halide [48]. Figure 2.21 shows the mechanism of ATRP, where RBr is initiator, CuBr is catalyzed, L is ligand, and M is monomer. Ligand could combine with cuprous salt and solubilize cuprous salt in the organic reaction system.
RBr
+
CuBr (L)
k
ak
dR
+
CuBr
2(L)
M
RMn
CuBr
2(L)
RMn-Br
+
CuBr (L)
Figure 2. 21 Mechanism of ATRP
ATRP reactivity was related with monomer, metal catalyst, organic halides, temperature, and solvent. A number of different types of copolymers can be prepared by ATRP such as statistical (random), gradient, block, and graft copolymers [49]. Block copolymers have been synthesized via ATRP by two methods: (1) one-pot sequential, and (2) isolated macroinitiator [ 50 ]. Figure 2.22 shows the block copolymer mechanism of ATRP. AB diblock copolymer is synthesized by polymering monomer A, and then added B when most of A has reacted. In the isolated macroinitiator method, polyA which with halogen-terminated is isolated, and then polyA is used as a macroinitiator worked with CuX to polymerize monomer B. In this thesis, ATRP method is used to synthesize polymer. Polydispersity index is controllable in ATRP, and the final polymer could have functional group from the initiator chose.
Figure 2. 22 Block copolymer mechanism of ATRP
2.6.2 Stable Free-Radical Polymerization (SFRP)
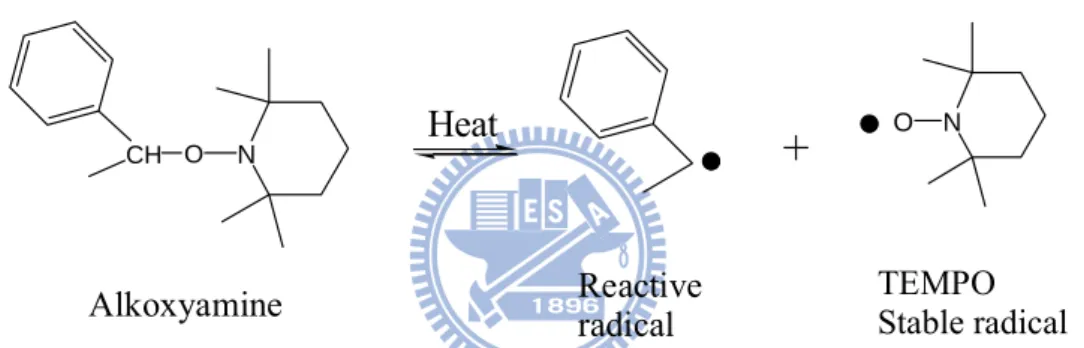
Stable free-radical polymerization used nitroxide, triazolinyl, dithiocarbamate, and tritly as the mediation or persistent radical. Cyclic nitroxide radical: 2,2,6,6-tetramethyl-1-piperidinoxyl (TEMPO) have been extensicely studied [51]. Figure 2.23 shows the thermal decomposition of an alkoxyamine “2,2,6,6-tetramethyl-1-(1-phenylethoxy)piperidine” into a reactive radical and a stable radical. Nitroxide radical which have steric hindrance were sufficiently stable.
CH O N Alkoxyamine Heat
+
O N Reactive radical TEMPO Stable radicalFigure 2. 23 the thermal decomposition of an alkoxyamine into a reactive radical and a stable radical
SERP process is analogous to ATRP as shown in Figure 2.24. The reactive radical initiate polymerization with the stable nitroxide radical, and the stable nitroxide radical mediate the reaction by reacting with propagating radicals to lower concentration. The nitroxide radical may not react with itself, and the nitroxide radical reacte rapidly with the propagation radical to decrease the concentration of the propagation radical. In SERP, the conventional bimolecular termination is negligible.
R-ONR'R" ka kd R + ONR'R" M ONR'R" RMn-ONR'R" RMn
Figure 2. 24 Mechanism of SERP
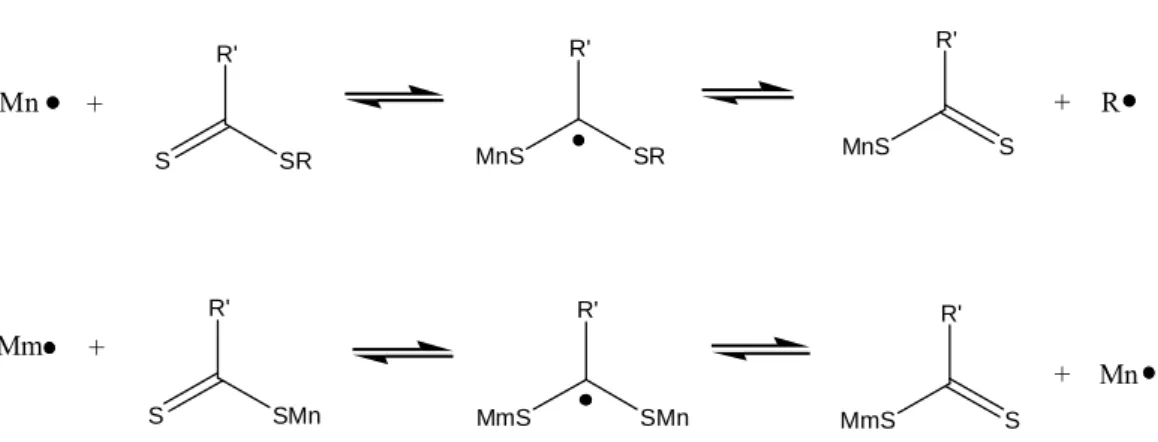
2.6.3 Radical Addition-Fragmentation Transfer (RAFT)
Radical addition-fragmentation transfer living polymerizations controlled chain growth through reversible chain transfer [52]. A chain-transfer agent transferred a labile end group to a propagating chain as shown in Figure 2.25. The transfer reaction in RAFT is not a one-step transfer of the labile end group, but involve radical addition to the thiocarbonyl group of the dithioester. A new dithioester and new radical are form after the reaction ended.
Mn S R' SR R' MnS SR R' MnS S R S R' SMn R' MmS SMn R' MmS S Mm Mn + + + +
2.7 Cross-linking of siloxane
There are four classes siloxanes cross-linking reactions: (1) peroxide-induced free radical reaction, (2) condensation reactions, (3) hydrosilylation addition reactions, and (4) hydridosilane/silanol reaction. In this thesis, we focus on the condensation reactions as shown in Figure 2.26. Silicon would react with water to produce silanol groups, and silanol groups would further react with the starting materials or another silanol group to produce a siloxane cross-link.
SiOR4 H2O Si(OH)4 4ROH
Si(OH)4 Si CH3 HO CH3 O Si OH CH3 CH3 Heat - H2O Si CH3 O CH3 O Si O CH3 CH3 Si O O O Si O O H+ + + +
(1)
(2)
Figure 2. 26 Condensation reaction in the siloxane cross-linking
Figure 2.27 shows methyltrimethyl silane (MTMS) was sol-gel to methylsilsesquoxane (MSQ). After the sol-gel reaction was ended, MSQ would cross link to form a polymer. The final result was polytrimethylsiloxane with cage and network structures. The MSQ has good oxidative resistance, good thermal stability, and chemical stability.
Si MeO OMe OMe Si Si O Si O Si O O Si O Si O * O Si O Si O O O Si Si O * O O Si O Si O * O Si OH * OH HO OH HO H2O acid
Figure 2. 27 Sol gel MTMS to MSQ
2.8 Characterization Methodologies
2.8.1 Nuclear Magnetic Resonance Spectroscopy (NMR)
The theory of NMR spectroscopy was proposed by W. Pauli in 1924. W. Pauli suggested that certain atomic nuclei should have the properties of spin and magnetic moment. In 1946, Bloch and Purcell demonstrated that nuclei absorb electromagnetic radiation in a strong magnetic field as a consequence of the energy level splitting that was induced by the magnetic field. Many atomic nuclei have a property called spin: the nuclei behave as if they were spinning. Spin angular momentum would show on odd mass, odd atomic number, or both have a quantized spin angular momentum and a magnetic moment. The more common nuclei that possess spin include: H1
1 , H12 , C 13 6 , N 14 7 , O 17 8 , and F 19
3 . A hydrogen nucleus may have a clockwise (+1/2) ot
counterclockwise (-1/2) spin, and the nuclear magnetic moment (μ) in the two cases are pointed in opposite directions. The nuclear magnetic resonance phenomenon occurs when nuclei aligned with an applied field are induced to absorb energy and change their spin orientation with respect to the applied field. Many nuclei are capable of exhibiting magnetic resonance; the organic chemist is interested in proton and
carbon resonances. Si for semiconductor related fields not all protons has resonance at the sane frequency. The protons are shielded by the electrons that surround them. The resonance frequency would be controlled by shielded. A field-independent measure called the chemical shift (δ). From the different chemical shift, the organic compound structure can be demonstrated. The signal would through Fourier transform to become readable signal. Noise is random electronic signals that are usually visible as fluctuations of the baseline in the signal, and increase scan time would decrease noise signal. There were two general types of NMR spectrometers: (1) continuous-wave (CW) and pulsed, and (2) Fourier transform (FT NMR). In 1970, Ft NMR became the mainly NMR spectrometer.
2.8.2 Gel Permeation Chromatography (GPC)
GPC, also called size exclusion chromatography (SEC), the most widely used method of determining molecular weight distribution [53,54,55]. GPC column equips with a highly porous material with solvent to separate the polymer molecules size. Small molecules diffuse into the pores of the column more efficiently, hence small molecules travel through the column more slowly. Larger molecules would travel out the column first. From the plot of detector response against time of polymer molecules going through the column could in ensue polymer molecular weight. Figure 2.28 shows the schematic diagram of GPC [56].
Figure 2. 28 Diagram of GPC
2.8.3 Different Scanning Calorimetry (DSC)
DSC is a thermal technique in which differences in heat flow into a substance and a reference are measured as a function of sample temperature while the two are subjected to a controlled temperature program. There were two types of DSC: (1) power compensated DSC, and (2) heat flux DSC. The instrumentation for the two was fundamentally different [57]. In this study, a heat flux DSC is used for measuring Tg.
Figure 2.29 shows the schematics of a heat flux DSC cell [58]. For heat flux DSC, heat flowed into both the sample and reference material via an electrically heated Constantan thermoelectric disk. The differential heat flow to two disks was monitored by Chromel/Constantan area thermocouples formed by the junction. The sample temperature was estimated by Chromel/Alumel junction under the sample disk.
Figure 2. 29 Schematic of a heat flux DSC cell.
2.8.4 Thermal Gravimetric Analysis (TGA)
The mass of a sample in a controlled atmosphere is recorded as a function of temperature or time at fixed temperature. A plot of mass percent as a function of time is called a thermal decomposition curve. TGA instrument include: (1) a sensitive analytical balance, (2) a furnace, (3) a purge gas system for providing an inert atmosphere, and (4) a microcomputer/microprocessor for instrument control and data acquisition and display. Modern thermoblances used a computerized temperature control routine. The automatically compared the voltage output of the thermocouple with a voltage versus temperature table that was stored in read-only memory (ROM). The microcomputer used the difference between the temperature of the thermocouple and the temperature in ROM to adjust the voltage to the heater [59]. Typical run-to-run reproducibility fro a particular program fell within 2 °C throughout an
Figure 2. 30 Components of a thermal balance: A: beam, B: sample cup and holder, C: counterweight, D: lamp and photodiodes, E: coil, F: magnet, G: control amplifier, H:
tare calculator, I: amplifier, J: recorder.
2.8.5 Fourier-transform infrared spectroscopy (FTIR)
A molecular was combined by atoms. Atoms had vibrational and rotational motion. For chemical purposes, “vibrational” portion of the infrared region was interested.
Hooke’s law [60] (Equation 2.4) shows the relationship between the frequency of the vibration, the masses of atoms and the bond strength.
2 1 2 1 2 1 m m m m k c v + = π (2. 4)
where v= the vibrational “frequency” in cm-1
c= the velocity of the light in cm/sec
k= the force constant of the bond in dynes/cm
1
m = the mass of atom 1 in grams m = the mass of atom 2 in grams
Chemists prefer to use wavenumbers as unit, thus, the vibrational infrared extends from 4000 to 400 cm-1.
FTIR has been applied to qualitative analysis, especially on organic compounds analysis. Pure silicon wafer which was as background, which would be first put on the FTIR holder, and nitrogen (N2) was blow into FTIR. Infrared data is collected in the
wavenumber from 4000 to 400 cm-1 using a total of 32 scans at 4 cm-1 resolution. Porous low-k film would be investigated on the same way.
2.8.6 Scanning Electron Microscope (SEM)
SEM images the sample surface by scanning it with high-energy electron source which is “Field emission source”. The detector gather secondary electrons signal, and transfer into an SEM photo through with amplifier. The sample has to coating metal layer (ex. Au, Pt) to alleviate charging effect.
In this study, SEM is Dual beam[focused ion beam & electron beam] system (FIB/SEM). The ion beam focused by electromagnetic lens to cut and etch in small dimension. Typical ion beam used liquid metal Gallium (Ga) ion source. The properties of ion source were low melting point, low vapor pressure and large resistance of oxidation. Equipments of FIB included liquid metal source, electromagnetic lens, second ion detector, scanning electrode, sample stage and vacuum system. Figure 2.31 shows schematic diagram of a FIB/SEM system.
Figure 2. 31 Schematic diagram of a FIB/SEM system
2.8.7 X-ray reflectivity (XRR)
XRR is a non-contact surface analytical technique used in thin films, chemistry and material science. The source is copper Kα (λ=0.154 nm), and the scan angle is from 0 to 2 degree. When the incident angle is very small (grazing incident angle), there has total reflection of X-ray from film surface. Beside, the reflection would decreased fast when the incident angle is larger then critical angle. In a rough surface, X-ray reflection would decrease faster than in a smooth surface. Therefore, there shows Kieddig interference fringe in X-ray reflection curve when thin film was coated on the wafer. The frequency of would become larger when the difference between substrate and thin film get bigger. The period of Kieddig interference fringe and thickness of thin film are opposite. More layers on the substrate and would have more
difference periods of Kieddig interference fringe. Film thickness, film density and surface roughness could be investigated from Kieddig interference fringe [61,62]. Figure 2.32 shows Kieddig interference fringe of XRR.
Chapter 3 Experimental
3.1 Materials
3.1.1 Chemicals
(1) Initiator(3-chloropropyl)(triethoxy)silane
CAS No. 5089-70-3, purity=95%, product by TCI
Si
MeO
OMe
OMe
Cl
(2) Catalyst(a) Copper (I) bromide
CuBr(I), CAS No. 7787-70-4, purity = 98%, product by Sterm Chemicals
(b) N,N,N’,N”,N”-pentamethyldiethylenetriamine
PMDETA, CAS No. 3030-47-5, purity = 99+%, product by ACROS
N
NH
(3) Monomer Styrene
St, CAS No. 100-42-5, purity = 99%, product by SHOWA
(4) Polymer Polystyrene
PS,CAS No.9003-53-6, standard, MW:90,000 g/mole, product by Aldrich
* *
3.1.2 Matrix
methyltrimethoxysilane
MTMS, CAS No. 1185-55-3, purity = 97%, product by ACROS
Si
O
O
O
3.1.3 Solvent
(1) TolueneToluene, CAS No.108-88-3, product by TEDIA
(2) Tetrahydrofuran
THF, CAS No. 109-99-9, purity =99.9, product by ECHO
(3) Ethanol
EtOH, CAS No.64-17-5, purity =95, product by ECHO
OH
(4) n-Hexane
Hex, CAS No.110-545-3, purity >95 (HPLC), product by Aldrich
3.1.4 Acid
Hexafluorophosphoric acid
HPF6, CAS No. 16940-81-1, purity = 60wt%, product by ACROS
H
+
P
-F
F
F
F
F
F
3.2 Preparation
3.2.1 Purification of styrene (St) and CuBr(I)
CuBr was sublimated before using. CuBr (20~30g) were added into a 250 mL flask with equipped magnetic stirring bar, and then added 1L acetic acid. The flask was wrapped by aluminum foil overnight. Acetic acid would be removed by methanol, and then removed methanol at 80 °C oven. The result was CuBr(I). Styrene was sublimated before using. Styrene was distilled to remove the inhibitor.
3.2.2 Synthesis of α-siloxane-polystyrene (PS-siloxane)
In this experiment, CuBr(I) (0.28g, 0.001 mole) was added to a 250mL flask, equipped with a magnetic stirring bar, and then the flask was degassed. Initiator SiCl (0.4g, 0.002 mole) was dissolved in 100 mL Toluene three freeze–pump–thaw cycles. Styrene (5.6g, 0.054 mole) was added in a 100 mL flask and degassed with three freeze–pump–thaw cycles. PMDETA (0.328g, 0.0002 mole) was transferred into the 250mL flask which carried CuBr(I) through a syringe, and CuBr(I) would dissolve in PMEDTA. PMEDTA was chosen as ligand to chelate CuBr(I), and activated CuBr(I). Toluene and initiator were transferred into the flask through a syringe. After 1 min, styrene was transferred into the flask through a syringe and stirred at 80 °C for 12 h under nitrogen atmosphere. The polymerization would be stopped by adding THF and Cu2+ was removed by an alumina column. The polymer (polystyrene-siloxane, PS-Silocane) was obtained by precipitating the solution into alcohol and dried in the vacuum overnight. Yield: 1.3g (58.6%).
In this study, the ratio of styrene and initiator would be adjusted to change PS molecular weight. Table 3.1 shows the recipe of ATRP reactions for various PS molecular weight .
Table 3. 1 The recipe of ATRP reaction for various PS molecular weight.
styrene [I] CuBr PMDETA Toluene Time
(1) 5.6 0.4 0.28 0.328 3ml 12 h
(2) 5.6 1.2 0.28 0.328 3ml 12 h
(3) 5.6 2.4 0.28 0.328 3ml 12 h
3.2.3 Synthesis of MSQ from MTMS using sol-gel
MTMS (3.3g, 0.024 mole) was added into an alumina pan, DI water (0.285g, 0.018 mole) was added to hydrolysis MTMS, and added HPF6 (0.0375g, 0.0003 mole)
to dehydrate MTMS and start the sol-gel reaction. The pan was put into the oven at 80 °C for 7.5 mins to yield the final product, MSQ.
3.2.4 Grafting PS onto MSQ through siloxane-PS
Siloxane-PS was first dissolved in 2 mL THF in a 100 ml flask. Upon the completion of the sol-gel reaction, MSQ (1g) was immediately added into the flask. The reaction proceeded at 50 °C under oil bath for 14 h. The product was MSQ-g-PS, which was stored in freezer prior to usage.
3.2.5 Preparation of porous low-k film
MSQ-g-PS was dissolved in THF to form a 20 wt% solution. Before spin coating, the solution was initially filtered through a 0.45 μm PTFE filter (Millipore Inc.) in another bottle. The MSQ-g-PS solution was spin coating onto a silicon wafer to obtain the desired film thickness. The MSQ-g-PS film was then cured on a hot plate preheated at 200 °C for 30 mins, and at 400°C for 60 mins.
study to compare the PS sizes to that in pure THF solvent. Typically, THF was first added to dissolve MSQ-g-PS. Then ethanol or hexane was added to the MSQ-g-PS solution in order to examine coils size of PS long chain. Meanwhile, the thin film preparation method was the same as MSQ-g-PS porous low k film.
3.3 Experimental techniques
3.3.1 Nuclear Magnetic Resonance Spectroscopy (NMR)
1H-NMR was employed to study the chemical structure of PS-Siloxane using
Varian Unity-300 NMR. Chemical compound was dissolved in CDCl3. The relative
sensitivity was 1.00 ppm, and the sample was scanned for 32 times.
29Si-NMR was employed to study the chemical structure of using Bruker
DSX-400WB NMR. Time was 0.0246260 sec, Repetition was 4096 times. Sample was solid.
3.3.2 Gel Permeation Chromatography (GPC)
GPC was employed to calculate the molecular weight of PS-Siloxane using GPC Water 1515, and sample was dissolved in THF. The ratio of sample/THF was 2mg/1mL. Flow was 1 mL/min at 45 °C.
3.3.3 Different Scanning Calorimetry (DSC)
DSC was employed to study the glass transition temperature of PS-Siloxane, which was produced by Perkin-Elmer. Sample weight must higher than 2 mg. The heating rate is 10 °C/min from 0 °C to 250 °C in nitrogen.
3.3.4 Thermal Gravimetric Analyses (TGA)
MSQ-g-PS using TA Q500. Sample weight must higher than 5 mg. The heating rate is 10 °C/min from 0 °C to 900 °C in nitrogen.
3.3.5 Fourier-transform infrared spectroscopy (FTIR)
Fourier-transform infrared spectroscopy (FTIR) was employed to study chemical structures of PS-Siloxane, MSQ, and MSQ-g-PS using MAGNA-IR Technology Protage 460 (Nicolet Inc.) from 400 to 4000 cm-1. A transmission mode is typically used for porous low-k films onto a silicon wafer, which is infrared transparent. The total number of scans was 32 and the resolution was 4 cm-1.
3.3.6 Scanning Electron Microscope (SEM)
A dual beam FIB/SEM system was used to examine the pore size of porous low-k films. Voltage was kept at 5 kV, while current was 98 pA.
3.3.7 X-ray reflectivity (XRR)
XRR was employed to characterize the porosity of porous low-k films using Beamline 13A1 in NSRRC, Taiwan. The scanning angle ranged from 0° to 2°, while the resolution was at 0.002°.
Chapter 4 Results and Discussion
There were three major topics in this chapter: (1) Synthesis and characterization of PS-siloxane, MSQ, and MSQ-g-PS, (2) Structure properties of MSQ-g-PS porous low k film such as pore size, morphology, porosity, and solvent effect for pore size, and (3) The comparison between PS/MSQ hybrid film and MSQ-g-PS film.
4.1 Synthesis and properties of PS-siloxane
4.1.1 Synthesis of PS-siloxane
Styrene monomer was polymerized to siloxane-polystyrene by ATRP method using (3-chloropropyl)(triethoxy)silane as an initiator as shown in Figure 4.1. The structure of PS-siloxane was validated by 1H-NMR spectrum as shown in Figure 4.2.
Typically, PS has two major chemical structures: long chain and aromatic ring [63], while PS-Siloxane has additional siloxane as the end group. Therefore, there were three peaks of PS-Siloxane in 1H-NMR spectrum: δ=1.25-1.84 ppm (PS long chain), δ=6.45-7.18 ppm (aromatic ring), and δ=3.6 ppm (-OC2H5 of siloxane). The
region of PS long train signal was separated to two portions: a: δ=1.25-1.54 ppm, and b: δ=1.61-1.84 ppm. “b” has higher chemical shift than “a” because of the electronegativity effect [64] on aromatic. Aromatic ring also has two peaks: c: δ=6.45-6.90 ppm, and d: δ=7.03-7.18 ppm because the aromatic ring current [65] made aromatic π-electron deshield aromatic protons, and caused peak separating. The content of siloxane was too low to affect the chemical shift of PS long chain. Therefore, PS-siloxane has almost the same 1H-NMR spectrum as typical PS. The only difference is the distinctive siloxane signal (δ=3.6 ppm) in PS-Siloxane. ATRP method can control radical stably, thus, PS-Siloxane was synthesized one by one from
styrene monomer. Siloxane initiator was the only radical source to start the polymerization and synthesized PS-Siloxane. Once signals of typical PS were shown in 1H-NMR spectrum, the chemical structure was PS-Siloxane definitely.
Si Cl EtO OEt OEt
+
CuBr
PMDETA
Si EtO OEt OEt Cl mFigure 4. 1 Synthesis scheme of siloxane-polystyrene
10
9
8
7
6
5
4
3
2
1
0
Si EtO OEtOEt
Cl m a b c d e chemical shift (ppm)
a
b
c
d
e
approach is to vary the amount of initiators in the ATRP synthesis of PS-Siloxane. Figure 4.3 showed the relationship between PS molecular weight and the content of initiator based on GPC measurement. PS molecular weight decreased from 80,000 to 5,000, when initiator weight loading increased from 0.4 g to 2.4 g. The relationship between initiator concentration and polymer molecular in ATRP method can be described by Equation 4.1 [66]. The molecular weight of polymer using ATRP synthesis was inversely proportional to both initiator and Cu+ concentrations. It is believed that the numbers of radical were increased when the concentration of initiator or activator was increased [67]. When the content of radical was increased, the reaction can act faster, and styrene has no time to be polymerized. Therefore, PS molecular weight was decreased when the content of initiator was increased.
The molecular weight distribution of PS-Siloxane, such as polydispersity index (PDI) could be obtained from GPC data using Equation 4.2. For commercial polymer, the difference between Mw and Mn (Mw > Mn) or PDI increases as the
molecular-weight distribution broadens [68]. When PDI value is close to 1, Mw value
and Mn value were very close, i.e. a very narrow molecular weight distribution.
PDI values of PS with Mn = 5000 g/mole, 100,000 g/mole, and 80,000 g/mole
were 1.38, 1.20, and 1.33, respectively, which were relatively low. In general, free radical polymerization would have PDI about 4 [69]. Low PDI value (~1.3) in this study was one of characteristic features of ATRP synthesis method.
0.0
0.5
1.0
1.5
2.0
2.5
0
20000
40000
60000
80000
m
ole
c
u
lar
w
eig
ht (
g/m
ole)
content of initiator (gram)
Figure 4. 3 PS molecular weight as a function of initiator weight loading
3 / 2 3 / 1 0 0 0
3
]
[
]
[
2
3
]
[
]
[
ln
t
k
Cu
I
K
k
M
M
t p⎭
⎬
⎫
⎩
⎨
⎧
=
+ (4. 1) Where[M]0 = initial concentration of monomer
[I]0 = initial concentration of initiator
[M] = monomer concentration [Cu+] = Cu+ concentration K = ka/kd,
ka = rate constant for activation
kd = rate constant for deactivation
PDI = Mw/Mn (4. 2)
Mw = weight average molecular weight
Mn = number average molecular weight
4.1.2 Thermal properties of PS-Siloxane
Next, the thermal properties such as thermal stability and glass transition temperature (Tg) of the functionalized porogen, PS-siloxane was investigated to
realize its basic properties. Figure 4.4 shows the thermo-gravimetric curve of PS-siloxane from room temperature to 800 oC. The weight loss below 100 °C was believed to be caused by the loss of solvent (THF). The complete decomposition of PS-siloxane occurred at 435 °C. Moreover, Td of PS-siloxane was 362 °C at which
5% weight loss occurred. Thus, the novel functionalized porogen, PS-siloxane possessed a high decomposition temperature, which was the primary requisite for high-temperature porogen in the Solid-FirstTM scheme. As a result, PS-siloxane is an excellent high-temperature porogen.
0
200
400
600
800
0
20
40
60
80
100
w
eight loss (
%)
Temperature oC
Figure 4. 4 TGA of PS-Siloxane
The glass transition temperature (Tg) of PS-siloxane was examined by scanning
calorimetry (DSC) as shown in Figure 4.5. Tg can be defined from the thermal linear
dimension change. Tg of PS-Siloxane was calculated at 122 °C based on the thermal
linear dimension changed from 103 °C to 138 °C. Tg was measured to realize another
100
120
140
160
Temperature (
°
C)
T
g
at 122
°C
Figure 4.5 DSC curve of PS-siloxane
4.2 Synthesis of MSQ
MTMS monomers were polymerized to MSQ under acid condition by sol-gel method as illustrated in Figure 4.6, where “cage” and “network” Si-O were two major chemical structures of MSQ matrix. FT-IR spectroscopy was employed to examine the chemical bonding and structural change of MSQ cured at different temperatures: (a) 60 °C and (b) 400 °C, as shown in Figure 4.7. The primary infrared absorption peaks and their chemical bonding assignments were summarized in Table 4.1 [70]. The important absorption peaks were the Si-O-Si (cage like structure) peak at 1130 cm-1, the Si-O-Si (network like structure) peak at 1023 cm-1, the methyl (CH3)
stretching band at 2969 cm-1, bending mode at 1275 cm-1, Si-OH absorption peak at 911 cm-1 and Si-C absorption at 780 cm-1.
destroyed and transformed into network structure as observed the increase of peak intensity at 1023 cm-1 from 60 to 400 °C.
Si
MeO OMeOMe
sol-gel
Si Si O Si O Si O O Si O Si O * O Si O Si O O O Si Si O * O O Si O Si O * O Si OH * OHHO OH HOFigure 4. 6 The schematic of MSQ synthesis from MTMS monomers
Table 4. 1Primary absorption peak position and their assignment
Wavenumber (cm-1) Chemical Bonding
781 SiC-H3 911 Si-OH 1023 Si-O-Si (network) 1130 Si-O-Si (cage) 1275 -CH3 (bend) 2969 -CH3 (stretch)
4000 3500 3000 2500 2000 1500 1000 500
abs
o
rbance (a.u.)
wavenumber (cm-1)
(a) MSQ_60
oC
(b) MSQ_400
oC
(a)
(b)
Figure 4. 7 FTIR spectra of MSQ cured at 60 oC and 400 oC
4.3 Grafting PS-siloxane onto MSQ
PS was grafted onto MSQ through the functional group, siloxane end-cap of PS-siloxane by sol-gel method as illustrated in Figure 4.8. In order to confirm whether PS has been grafted onto MSQ through functional siloxane end-group, thermal analysis of MSQ and MSQ-g-PS were carried out and compared as shown in Figure 4.9. For MSQ, H2O groups escaped during the thermal process from 200 °C to 550 °C
and caused weight loss. However, the decomposition curve of MSQ-g-PS showed not only the escaping H2O, but also other weight loss which was considered to relate with
PS loss. In order to analyze this weight loss in-depth, two curves in Figure 4.9 were transformed to their corresponding derivative curve as illustrated in Figure 4.10 and Figure 4.11, respectively. Figure 4.10 showed only slightly change from 200 °C to
550 °C in MSQ. However, there was obvious weight loss from 376 °C to 460 °C from the derivative curve of MSQ-g-PS in Figure 4.11. PS broke away from MSQ in this thermal range, and its thermal decomposition temperature, Td in MSQ-g-PS was
calculated as 383 °C. When PS was grafted onto MSQ through functional siloxane end-group, the rigid MSQ structure surrounding PS distributed the energy of breaking PS. Thus, the thermal property of PS was enhanced from 362 oC (pure PS) to 383 oC. Thermal decomposition data provide the other supporting evidence for the successful grafting of PS onto MSQ through PS-siloxane end-cap group.
Si
EtO OEtOEt
Cl m
+
Si Si O Si O Si O O Si O Si O * O Si O Si O O O Si Si O * O O Si O Si O * OH OH O Si OH * OHHO OH HOHCl
H2O
Si Si O Si O Si O O Si O Si O * O Si O Si O O O Si Si O * O O Si O Si O * PS PS O Si PS * PSSP PS SP200
300
400
500
600
700
800
900
90
92
94
96
98
100
Weight los
s
(
w
t%)
Temperature (
°
C)
Pure MSQ
MSQ-g-PS
Weight loss~1 wt%
Figure 4. 9 TGA data of MSQ and PMS-g-PS
200
300
400
500
600
700
800
900
-0.06
-0.04
-0.02
0.00
∂
weight los
s (%
) /
∂
T (
°
C)
Derivative of MSQ
Temperature (
°
C)
Figure 4. 10 Derivative of TGA data of MSQ200
300
400
500
600
700
800
900
-0.06
-0.04
-0.02
0.00
∂
wei
g
ht loss
(%
) /
∂
T (
°
C)
Temperature (
°
C)
Derivative of MSQ-g-PS
Figure 4. 11 Derivative of TGA data of MSQ-g-PS
The changing of silane group was a evidence to demonstrate whether PS-Siloxane was grafted onto MSQ. This section would employ FTIR, TDS, and
29Si-NMR to investigate silane group of MSQ-g-PS structure. Figure 4.12 shows IR
spectra of MSQ-g-PS. PS signal did not show in FTIR spectra, because PS only have 1 wt% of MSQ and the resolution of FTIR was 5 wt%. Table 4.1 shows the peak assignment of IR spectra. Figure 4.13 shows TDA data of CH4 escaped from MSQ.
Figure 4.14 shows 29Si-NMR spectra of MSQ and MSQ-g-PS structures. Table 4.2 summarizes the peak assignment of 29Si-NMR spectra [71]. The mechanism of how PS-Siloxane is grafted onto MSQ will be discussed on next page.